REIT - The State Of REITs: January 2024 Edition
2024-01-14 11:32:29 ET
Summary
- The REIT sector closed the year out strong with a +11.40% total return in December, pushing into positive territory for the full year (+8.66%).
- Small cap REITs (+13.39%) outperformed in December. Large cap REITs (+9.55%) averaged a lower return than their smaller peers.
- 90.79% of REIT securities had a positive total return in December with 66.25% in the black for the full year.
- 17 out of 18 REIT property types averaged a positive total return in December led by Malls (+34.96%) and Self Storage (+18.19%). Infrastructure(-0.61%) was the only REIT property type in the red.
- The average REIT NAV discount narrowed from -20.50% to -12.94% during December. The median NAV discount narrowed from -19.74% to -11.21%.
REIT Performance
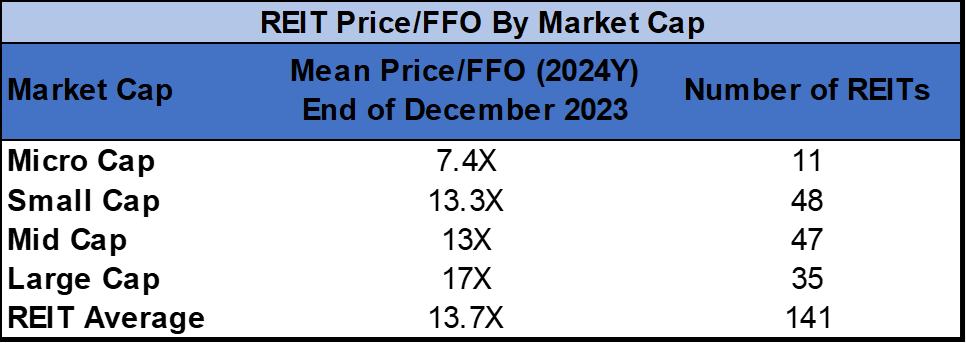
The REIT sector followed up a strong November performance (+9.50%) with an even better December (+11.40%). The average REIT total return in December far exceeded that of the broader market with more than double the return of the NASDAQ (+5.6%), Dow Jones Industrial Average (+4.9%) and S&P 500 (4.5%). The market cap weighted Vanguard Real Estate ETF ( VNQ ) fell short of the average REIT in December (+9.43% vs. +11.40%), but outperformed YTD (+11.79% vs. +8.66%). The spread between the 2023 FFO multiples of large cap REITs (17.0x) and small cap REITs (13.3x) narrowed again in December as multiples expanded 0.6 turns for large caps and 0.7 turns for small caps. Investors currently need to pay an average of 27.8% more for each dollar of FFO from large cap REITs relative to small cap REITs. In this monthly publication, I will provide REIT data on numerous metrics to help readers identify which property types and individual securities currently offer the best opportunities to achieve their investment goals.
Source: Graph by Simon Bowler of 2nd Market Capital, Data compiled from S&P Global Market Intelligence LLC. See important notes and disclosures at the end of this article
In December small cap (+13.39%) and mid cap REITs (+11.16%) averaged double digit total return, exceeding the high single digit returns of micro caps (+9.82%) and large caps (+9.55%). For full year 2023, small caps (+13.30%) narrowly outpaced mid caps (+12.99%) and large caps (+11.92%). Micro caps (-26.44%), however, had a dismal year and fell 3,510 basis points short of the average REIT. Small caps outperformed large caps by 138 basis points in 2023.
Source: Graph by Simon Bowler of 2nd Market Capital, Data compiled from S&P Global Market Intelligence LLC. See important notes and disclosures at the end of this article
17 out of 18 Property Types Yielded Positive Total Returns in December
94.4% percent of REIT property types averaged a positive total return in December. There was a massive 35.57% total return spread between the best and worst performing property types. Malls (+34.96%) handily outperformed all other REIT property types in December.
Infrastructure (-0.61%) was the only property type in the red in December, dragged down by the poor performance of CorEnergy Infrastructure Trust ( CORR ) (-23.91%), which more than offset the positive returns of Uniti Group ( UNIT ) (+7.26%), Power REIT ( PW ) (+6.51%), American Tower ( AMT ) (+4.21%) and SBA Communications ( SBAC ) (+2.73%).
Source: Table by Simon Bowler of 2nd Market Capital, Data compiled from S&P Global Market Intelligence LLC. See important notes and disclosures at the end of this article
Infrastructure (-26.77%) and Land (-10.12%) were the only REIT property types to average a negative total return in 2023. Office (+0.48%) and Triple Net (+1.05%) narrowly finished the year in the black. The number of REIT property types in the black in 2023 increased from 7 to 16 during December. Health Care (+37.99%) and Data Centers (+37.25%) were the best performing REIT property types in 2023.
Source: Table by Simon Bowler of 2nd Market Capital, Data compiled from S&P Global Market Intelligence LLC. See important notes and disclosures at the end of this article
The REIT sector as a whole saw the average P/FFO (2024Y) increase 1.2 turns in December from 12.5x up to 13.7x. The average REIT has now seen multiple expansion in 100% of property types in back-to-back months. Land (42.1x), Data Centers (24.8x), Timber (19.9x), Single Family Housing (19.3x), Industrial (19.2x) and Manufactured Housing (19.2x) currently trade at the highest average multiples among REIT property types. Malls (6.8x), Hotels (8.5x) and Office (8.6x) all average single digit FFO multiples.
Source: Table by Simon Bowler of 2nd Market Capital, Data compiled from S&P Global Market Intelligence LLC. See important notes and disclosures at the end of this article
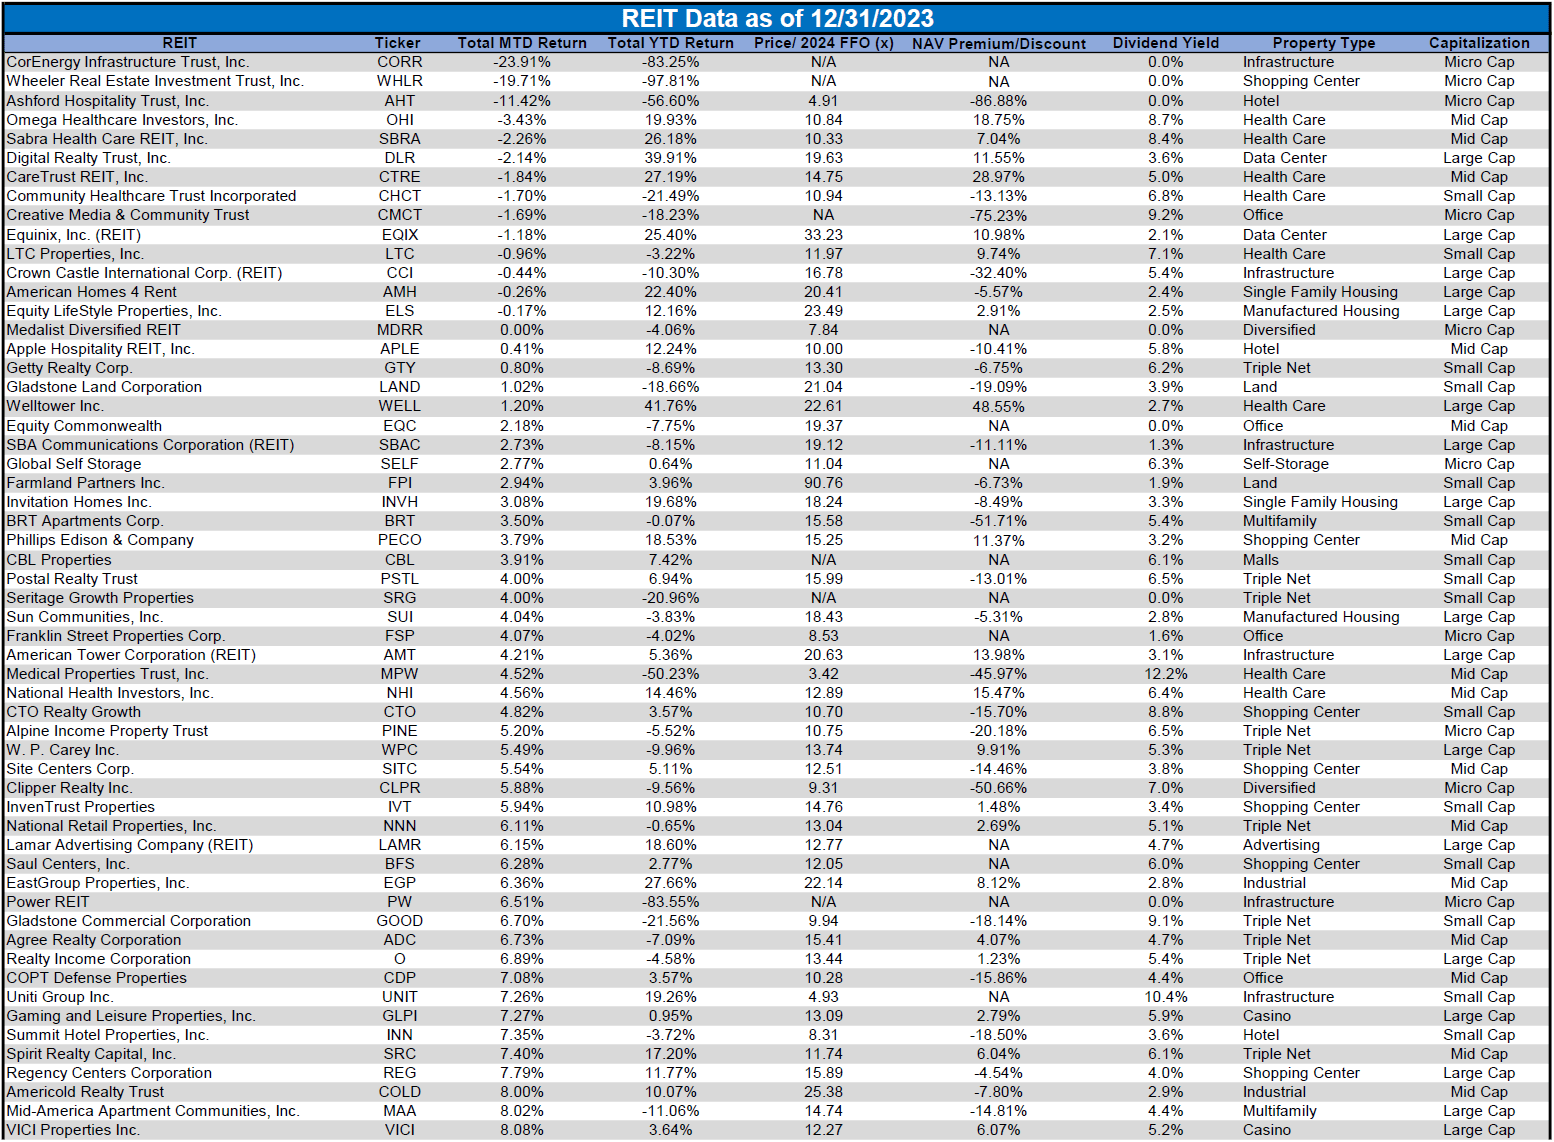
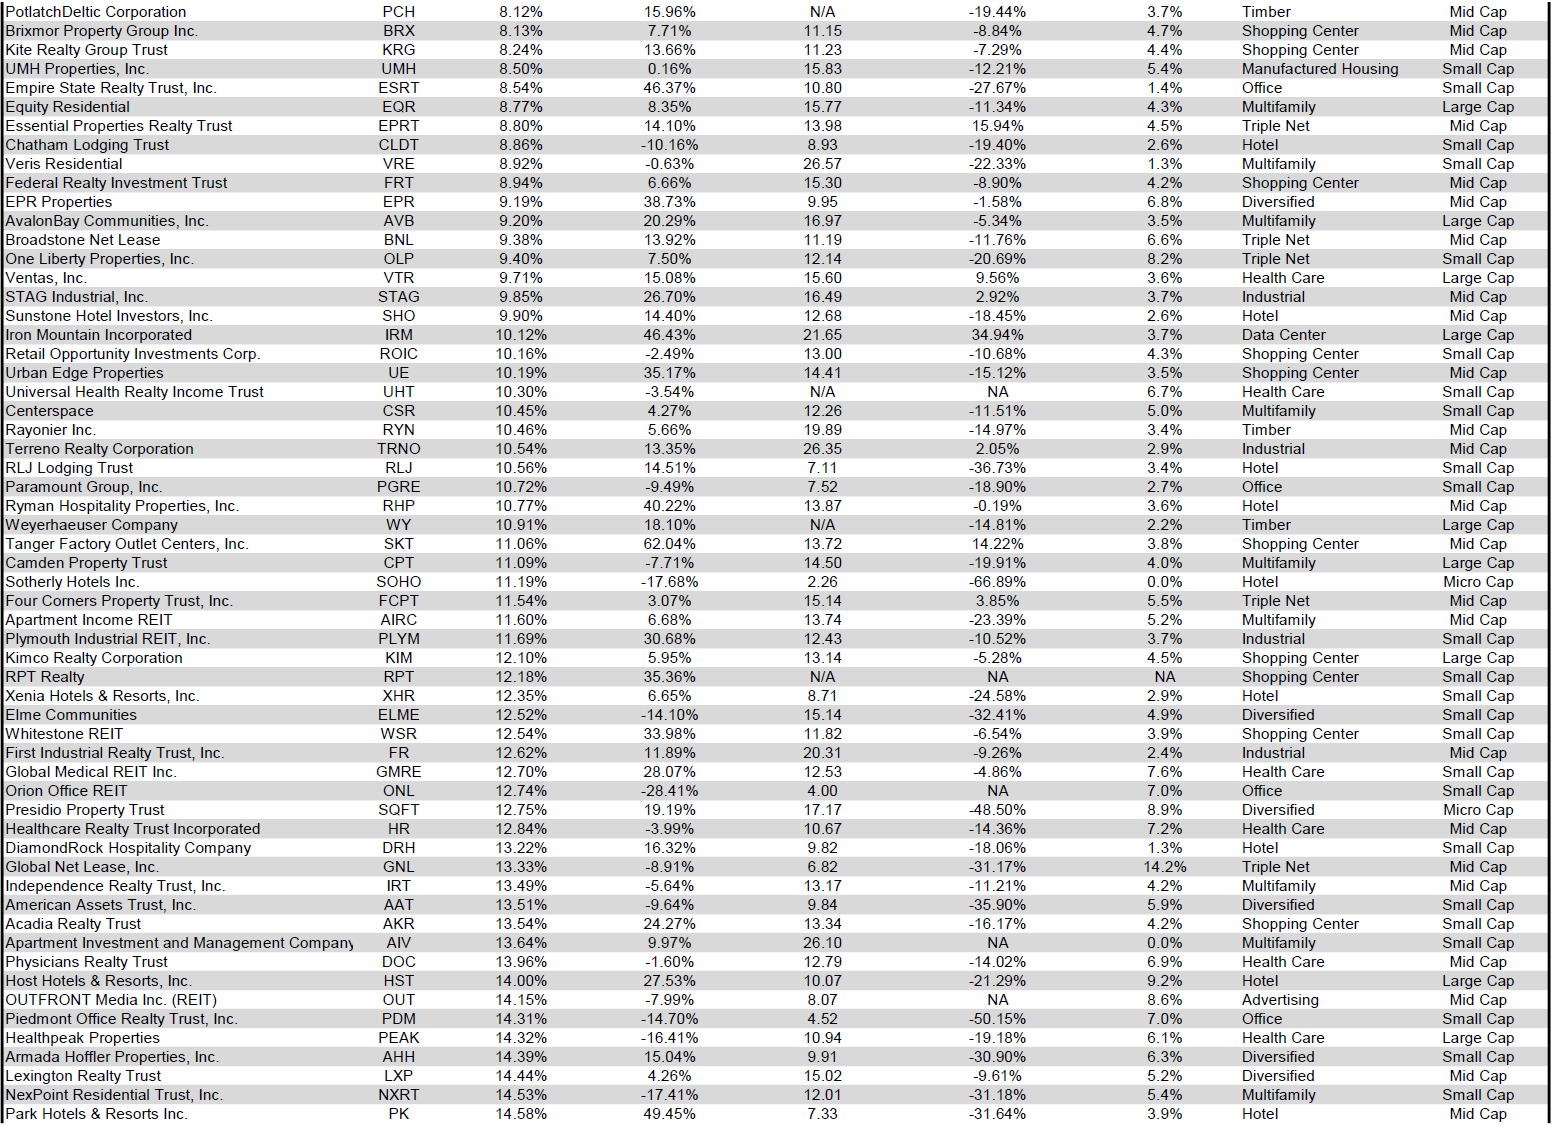
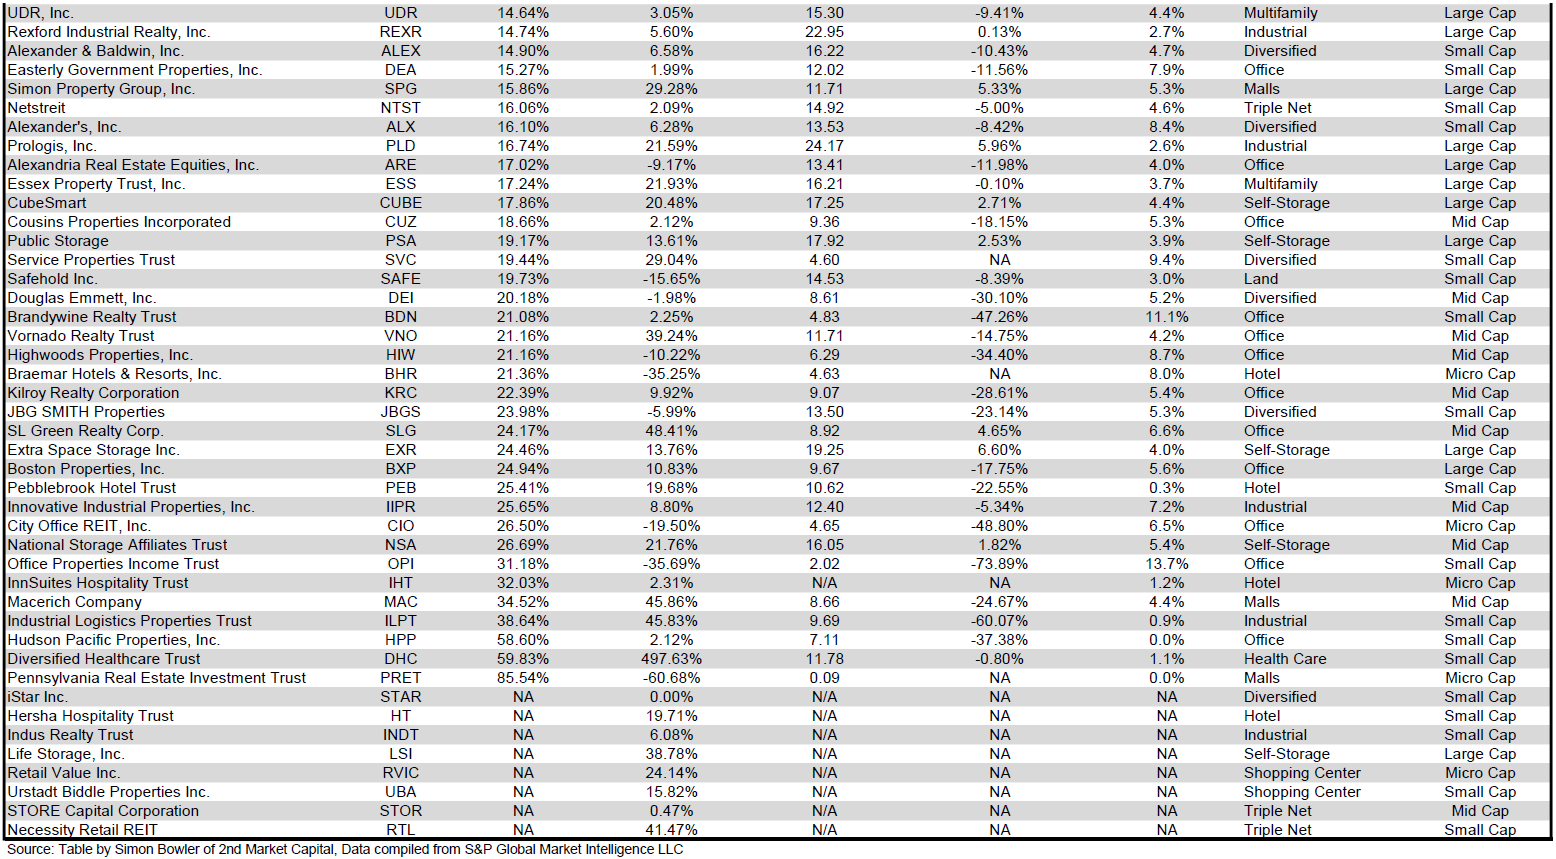
Performance of Individual Securities
RPT Realty (RPT) was acquired by Kimco ( KIM ) in an all-stock transaction with the closing announced before market on January 2 nd . 2024. The final trading date for RPT was the December 29 th , the last trading day of 2023. RPT shareholders received 0.6049 shares of KIM for each share of RPT held.
Pennsylvania REIT ( PRET ) (+85.54%) saw a sharp spike upwards on the announcement on December 11 th that although the current common and preferred shares will be cancelled in its Chapter 11 bankruptcy, shareholders will not be completely wiped out. Instead, preferred and common shareholders will each get a portion of a $10M payment. Despite the huge December gain, PRET finished the year with the 4 th worst REIT total return in 2023 (-60.68%). Diversified Healthcare Trust ( DHC ) was the 2 nd best performing REIT in December (+59.83%) and significantly outperformed all other REITs with an extraordinary +497.63% total return in 2023.
CorEnergy Infrastructure Trust ( CORR ) (-23.91%) fell sharply in December after being delisted from the NYSE on December 4 th . CORR is still trading on the OTC marketplace. CORR’s brutal -83.25% total return in 2023, however, was only the 3 rd worst REIT performance with even steeper losses seen by Power REIT ( PW ) (-83.55%) and Wheeler REIT ( WHLR ) (-97.81%).
90.79% of REITs had a positive total return in December with 66.25% in the black year to date. During full year 2022 the average REIT had a -23.56% return. The average REIT finished 2023 in the black with an +8.66% average total return.
Source: Table by Simon Bowler of 2nd Market Capital, Data compiled from S&P Global Market Intelligence LLC. See important notes and disclosures at the end of this article Source: Table by Simon Bowler of 2nd Market Capital, Data compiled from S&P Global Market Intelligence LLC. See important notes and disclosures at the end of this article Source: Table by Simon Bowler of 2nd Market Capital, Data compiled from S&P Global Market Intelligence LLC. See important notes and disclosures at the end of this article
For the convenience of reading this table in a larger font, the table above is available as a PDF as well .
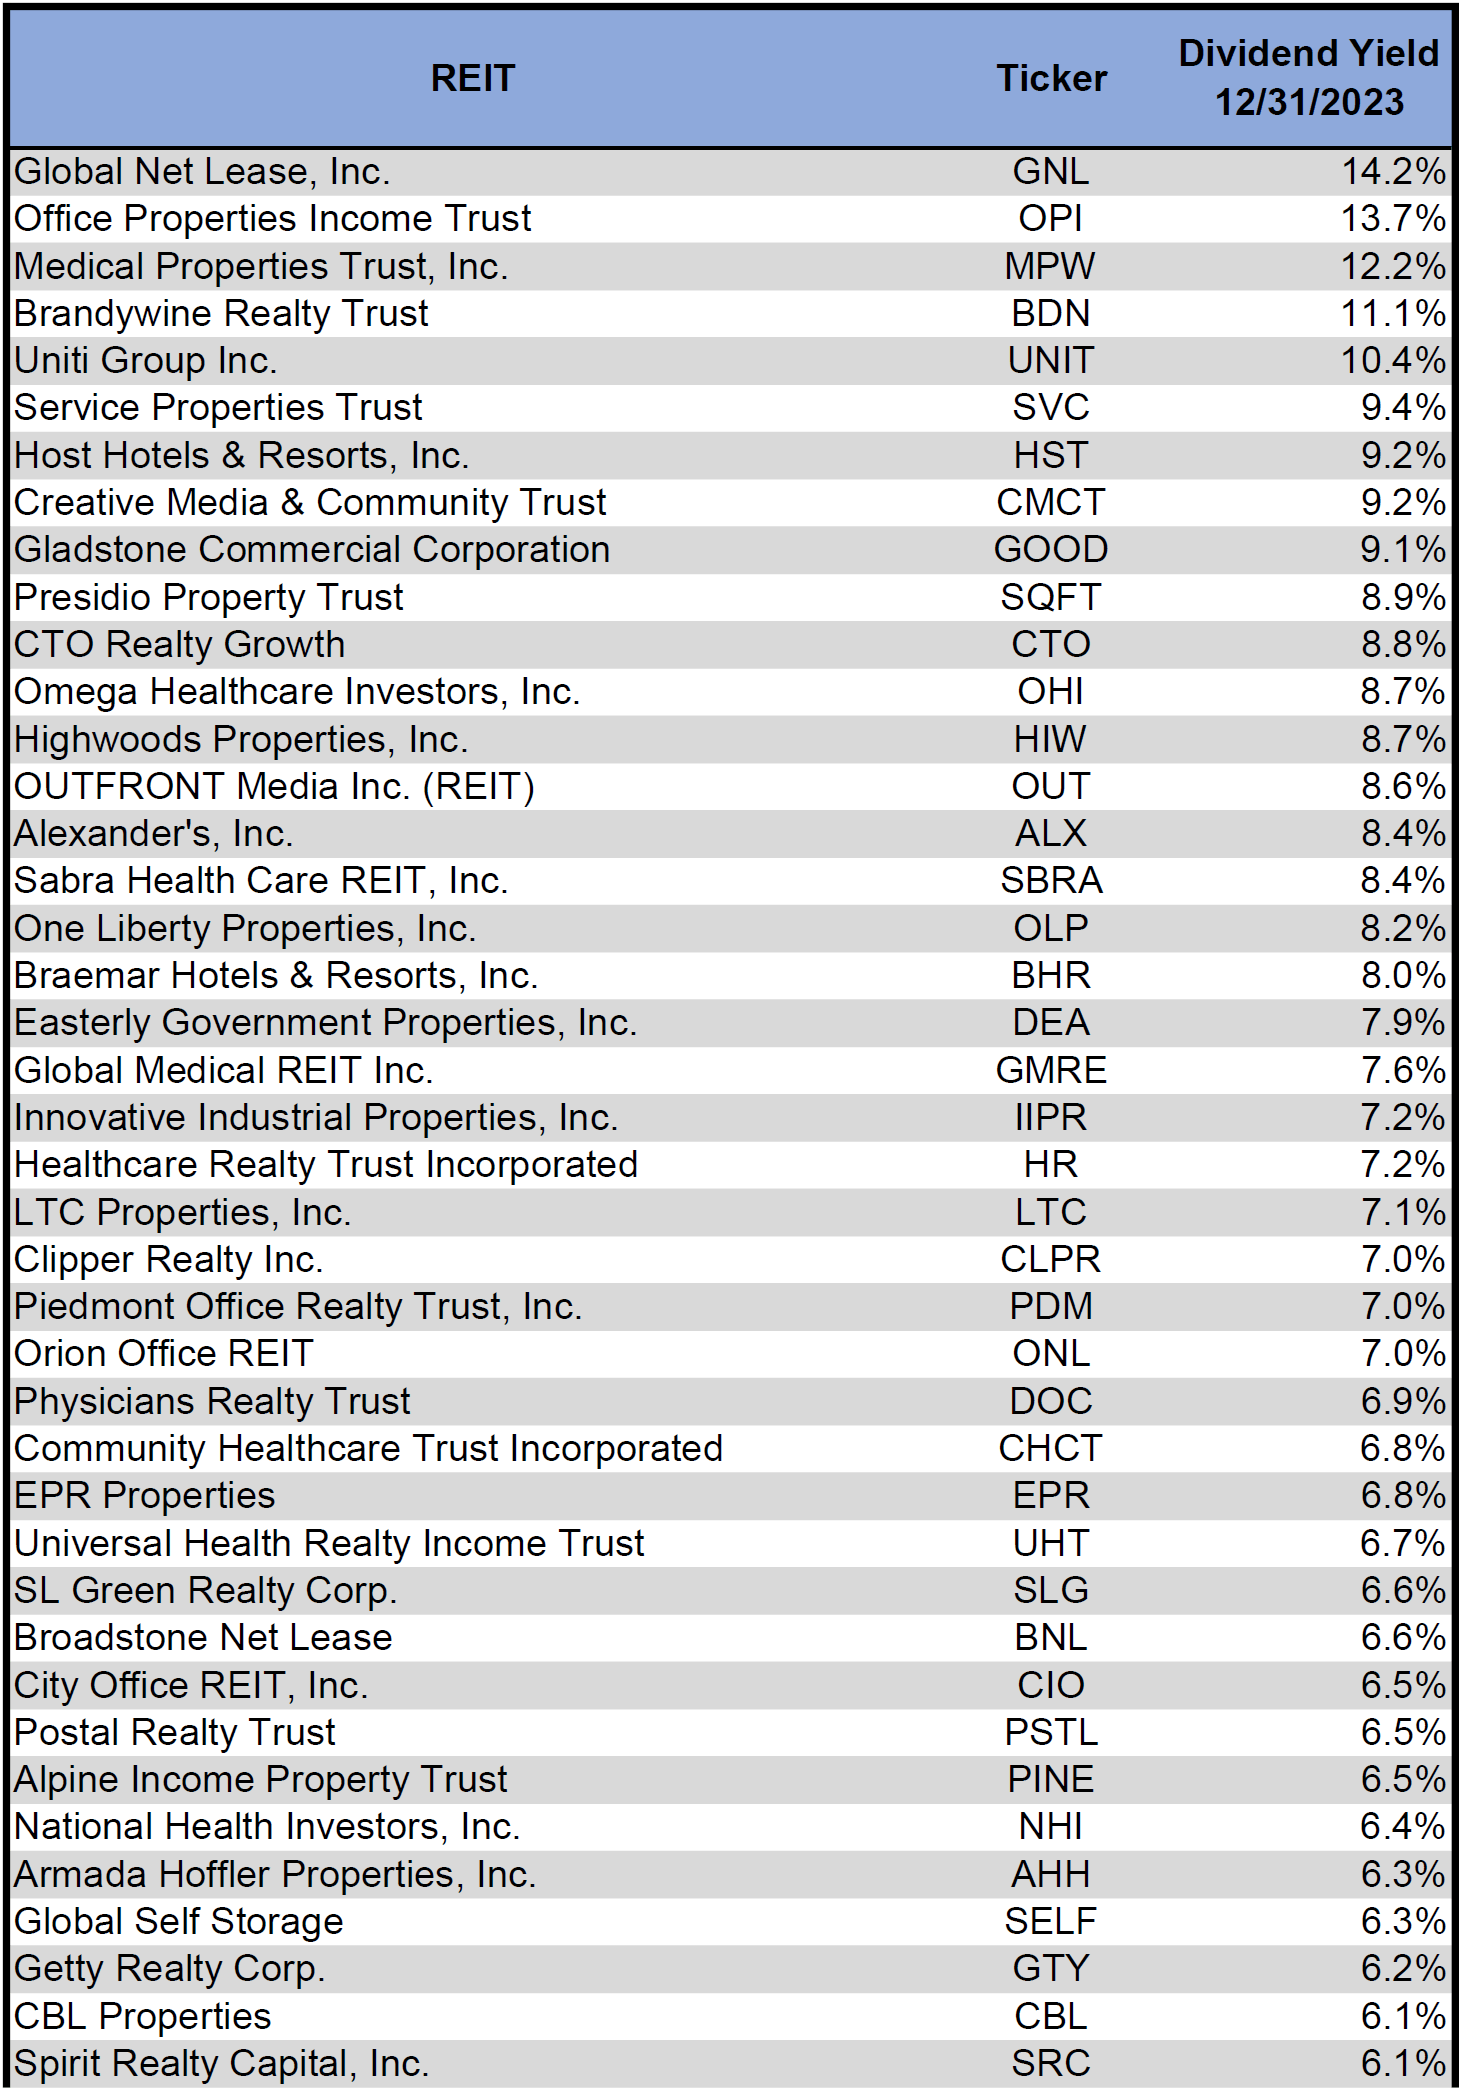
Dividend Yield
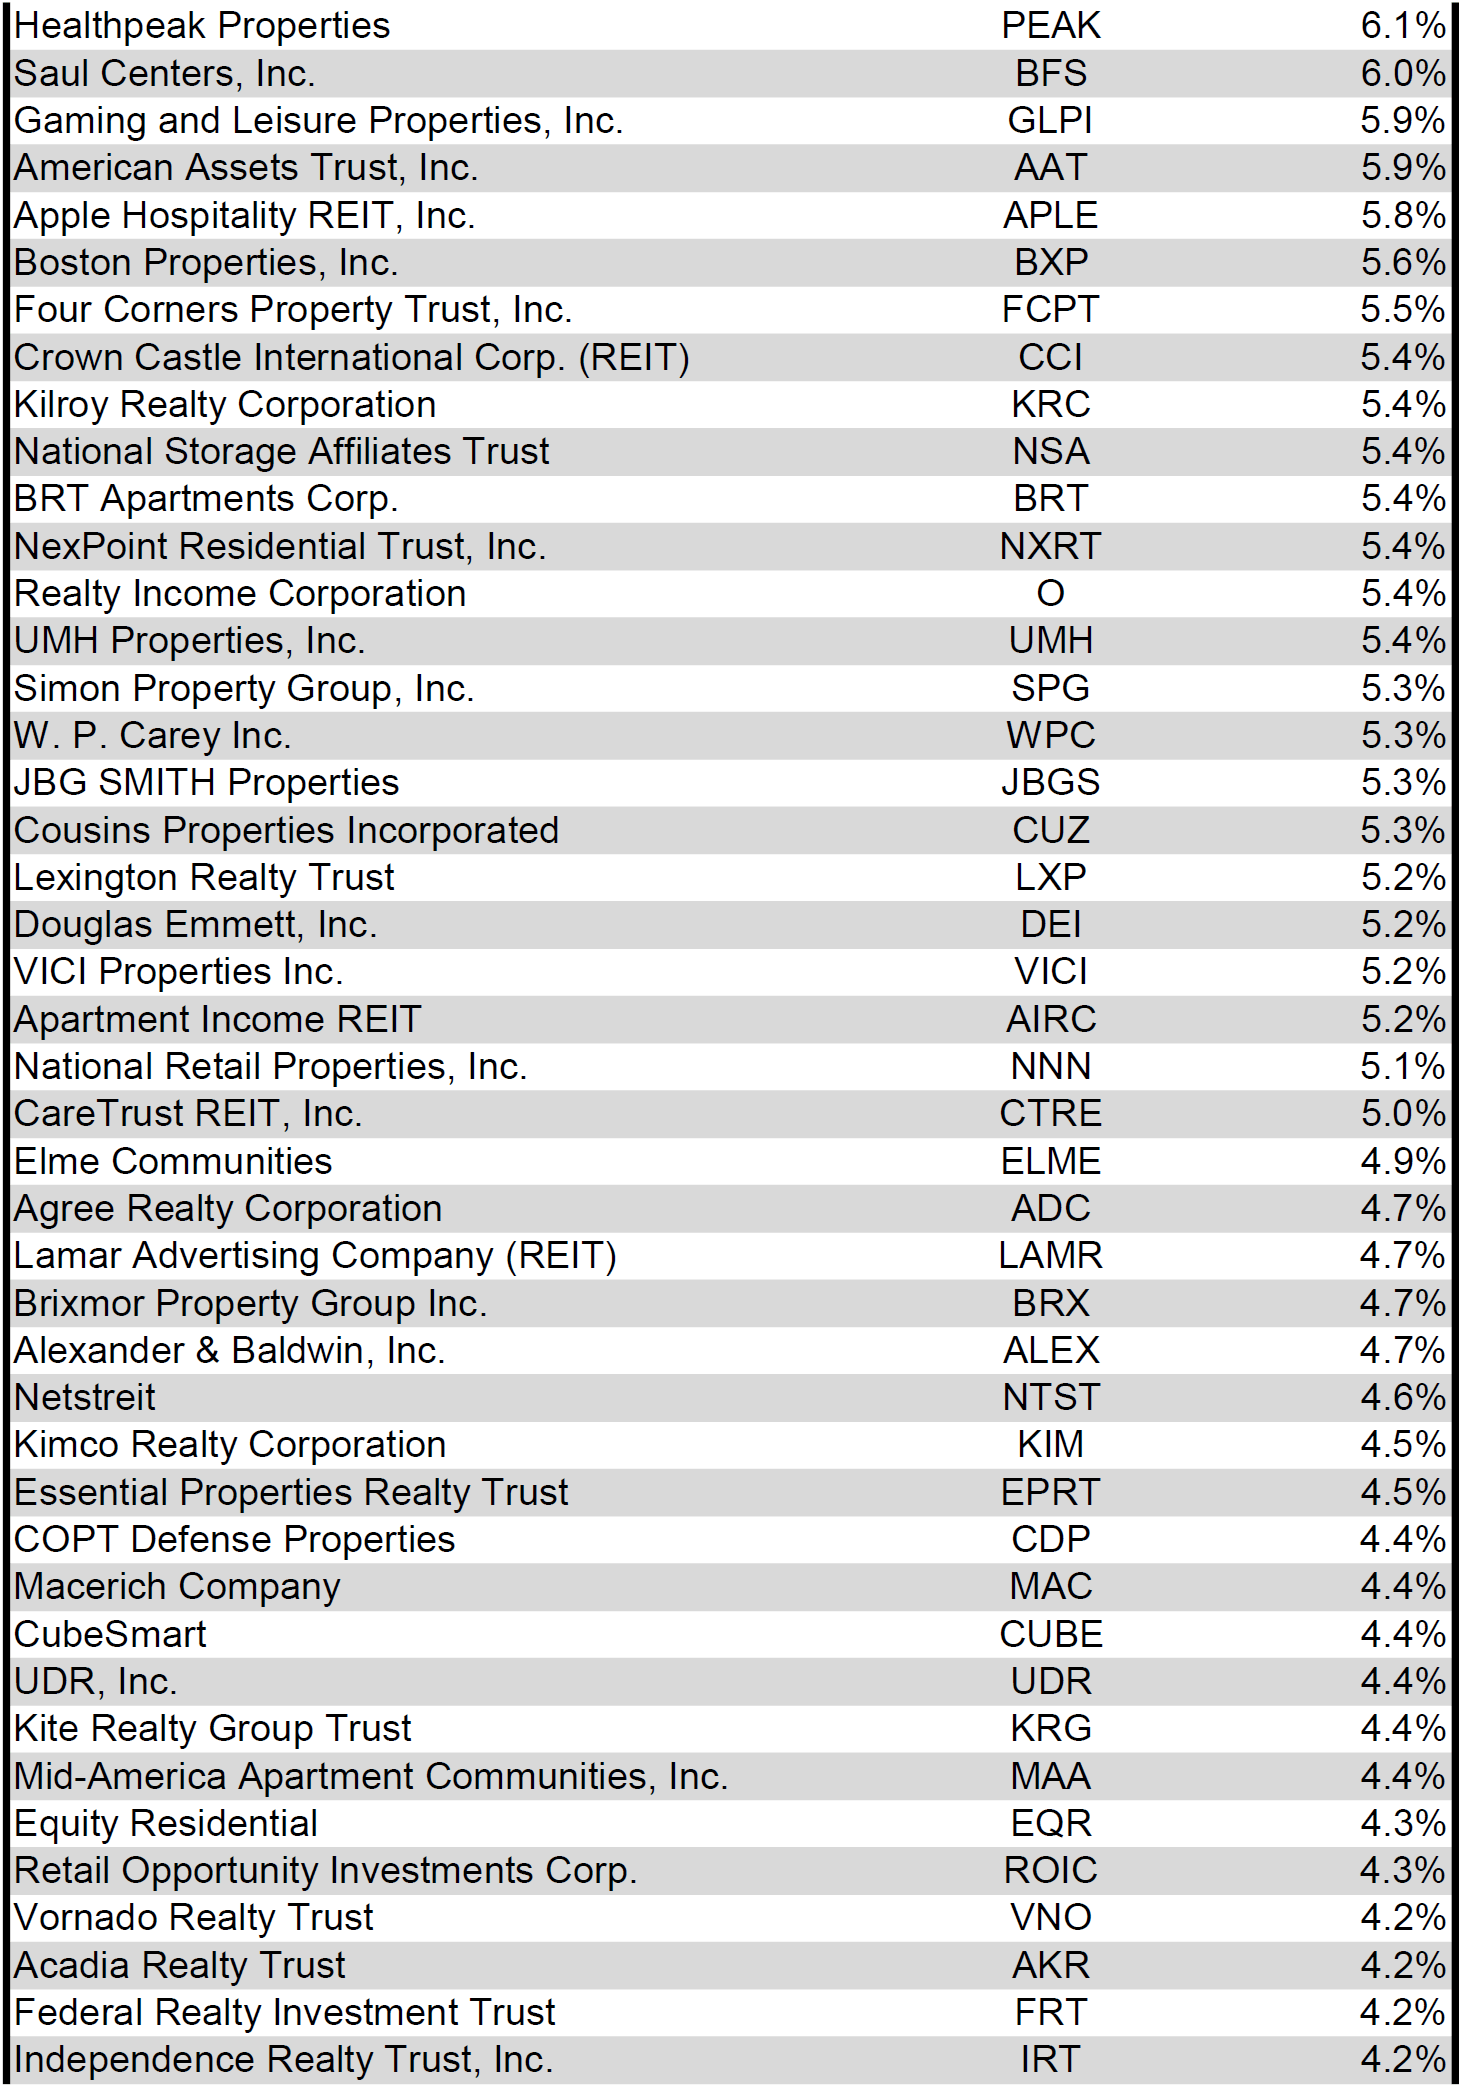
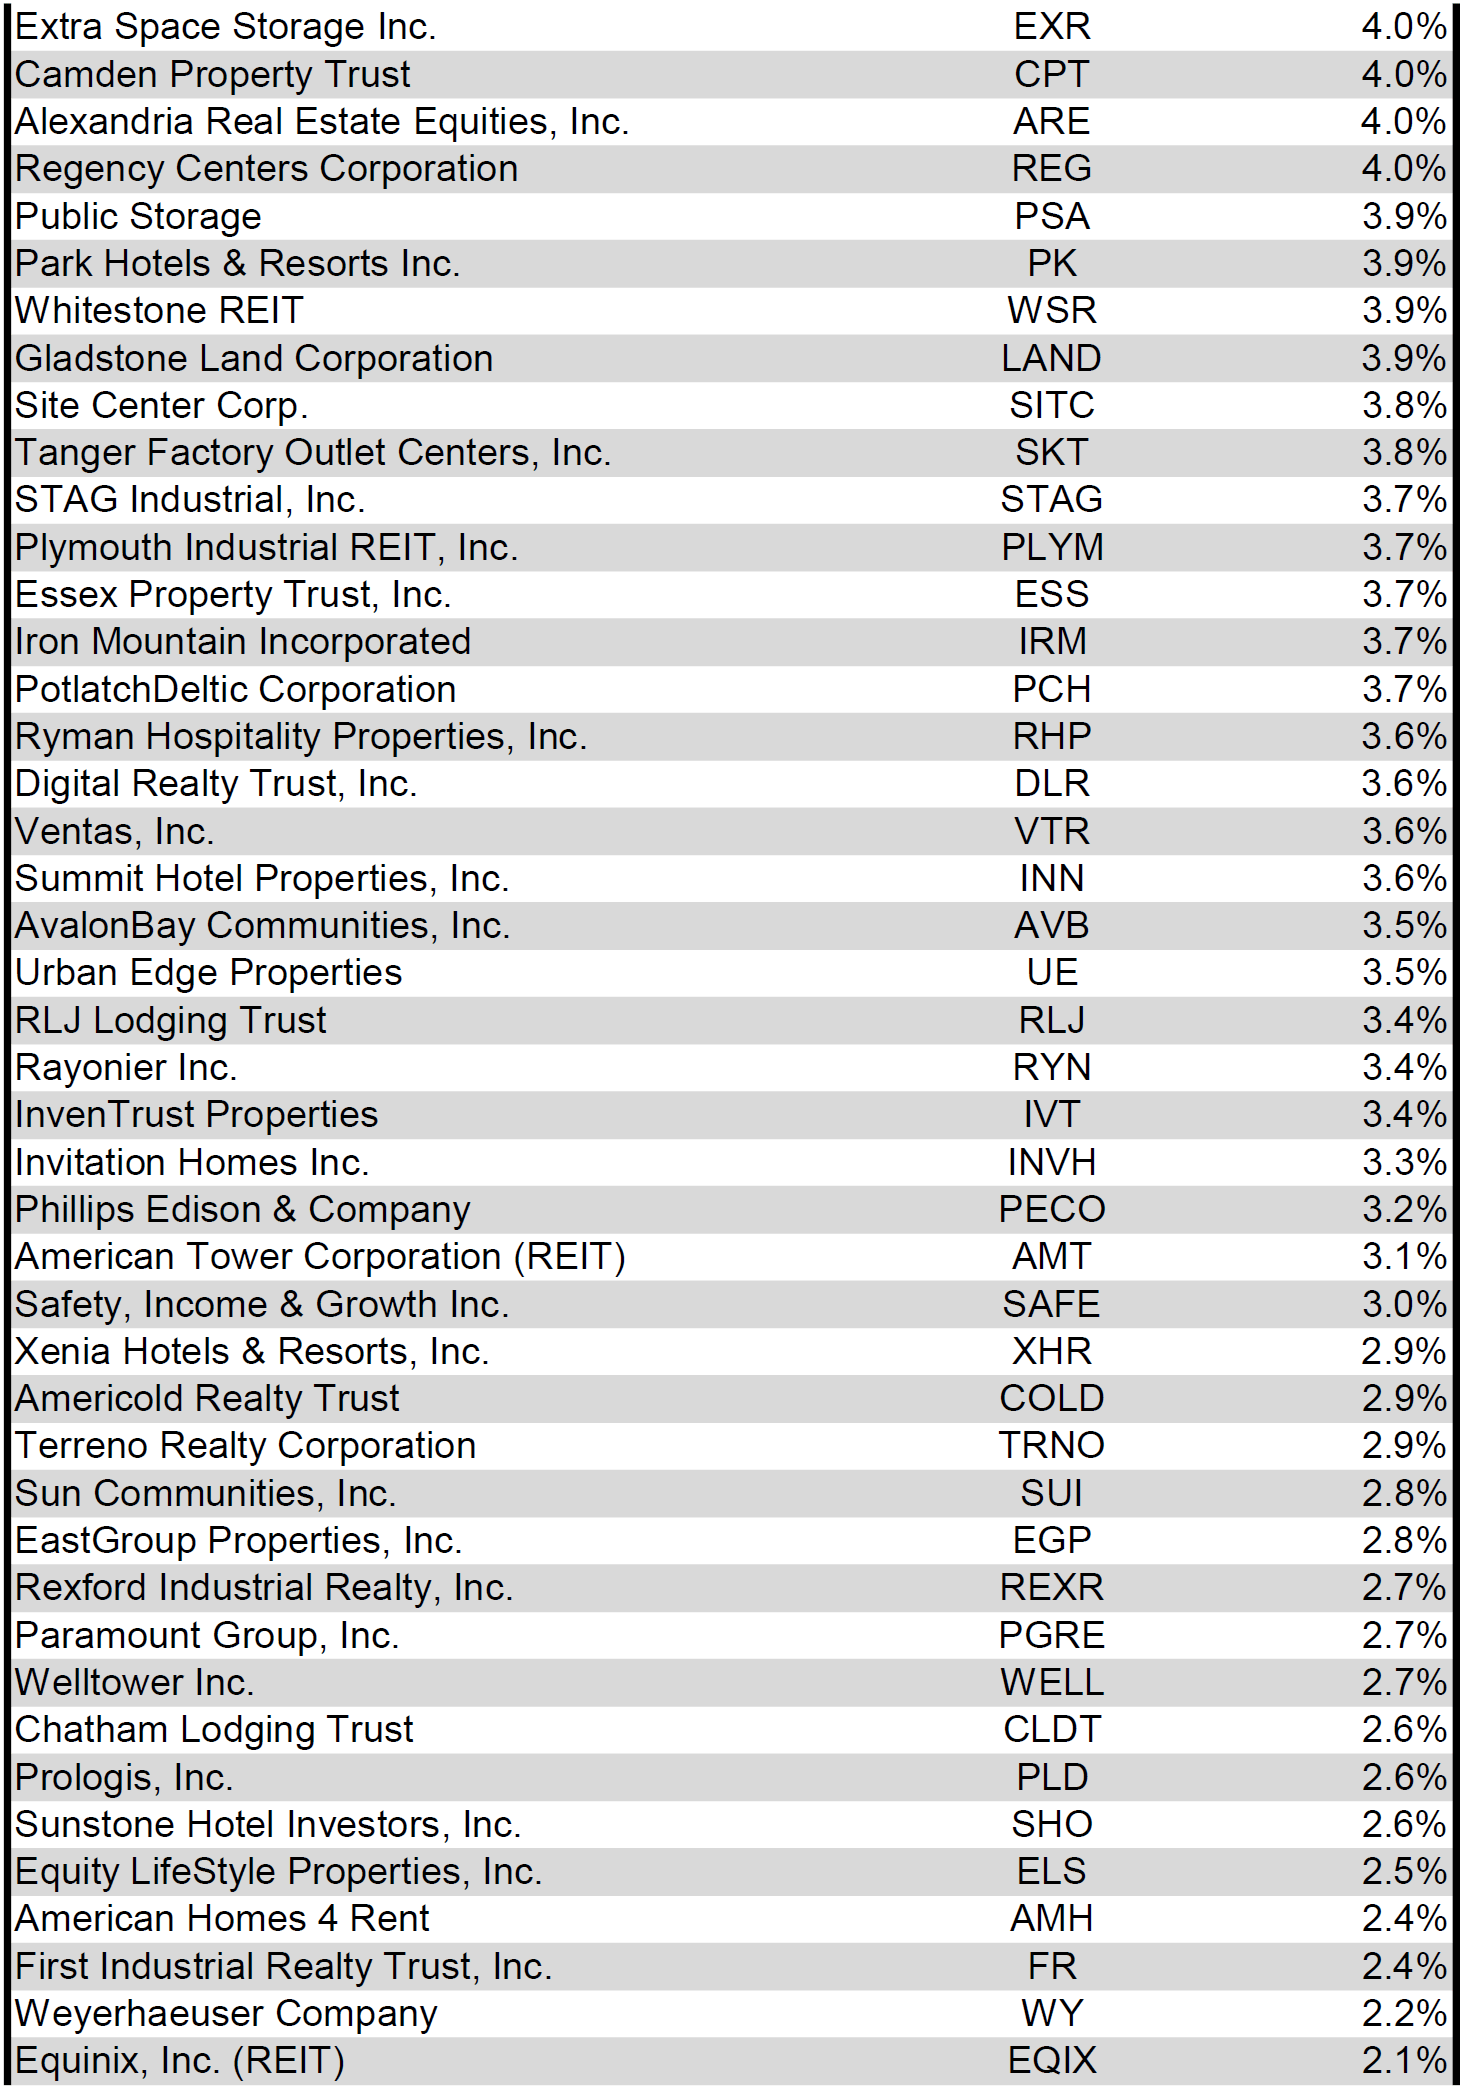
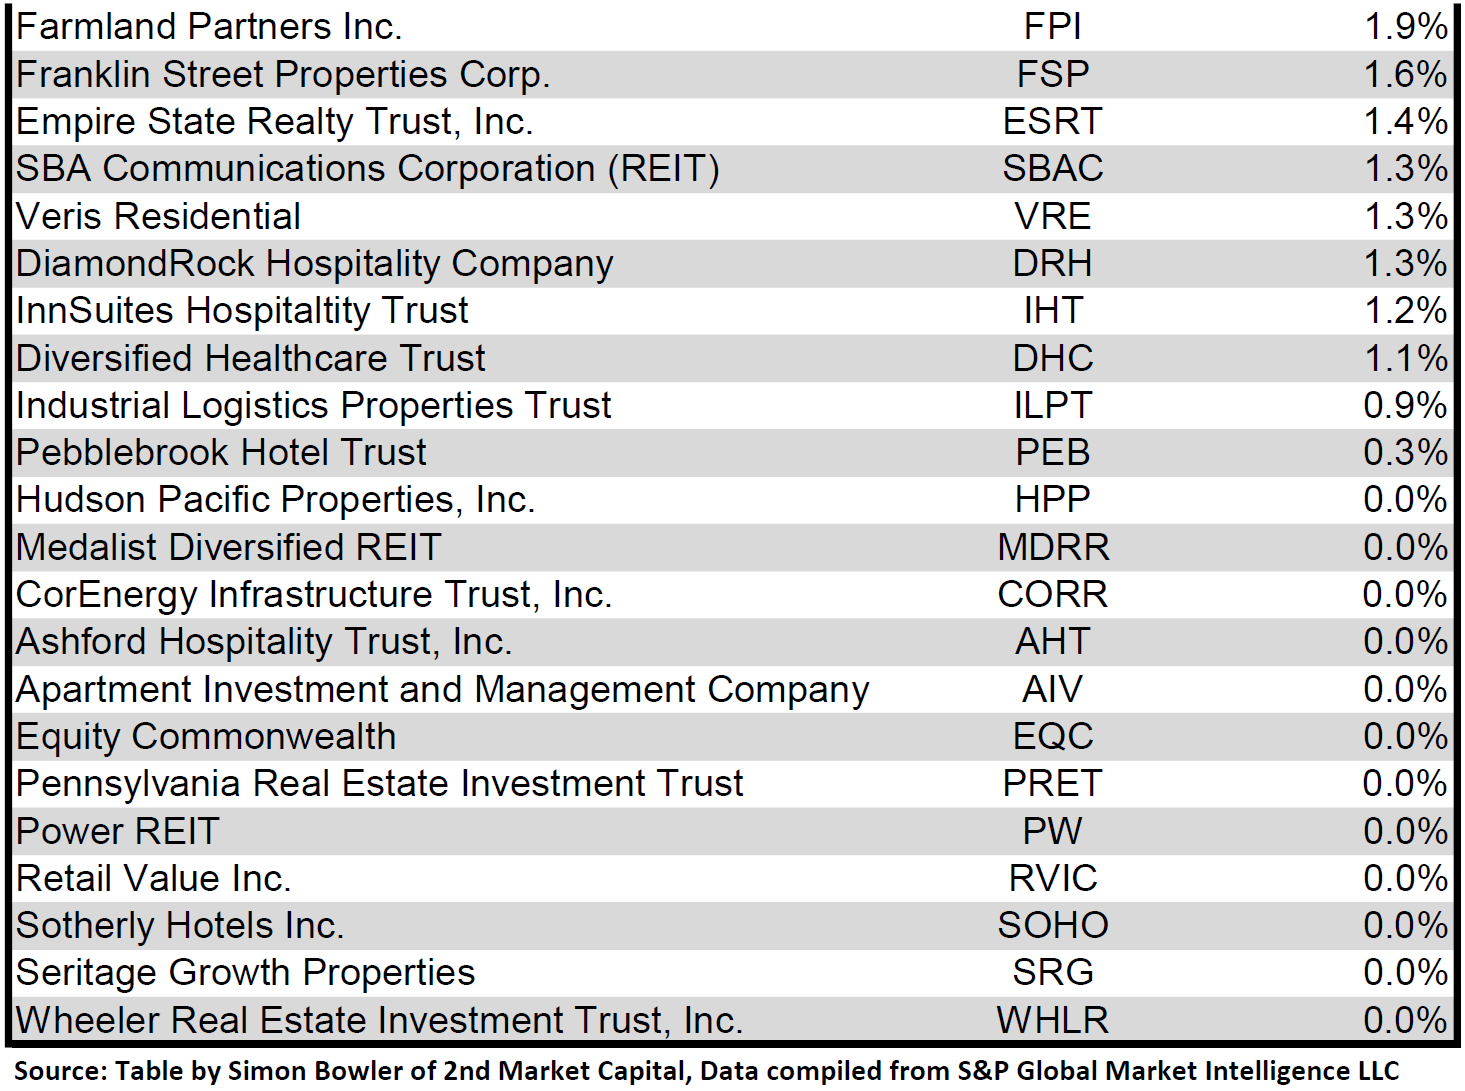
Dividend yield is an important component of a REIT's total return. The particularly high dividend yields of the REIT sector are, for many investors, the primary reason for investment in this sector. As many REITs are currently trading at share prices well below their NAV, yields are currently quite high for many REITs within the sector. Although a particularly high yield for a REIT may sometimes reflect a disproportionately high risk, there exist opportunities in some cases to capitalize on dividend yields that are sufficiently attractive to justify the underlying risks of the investment. I have included below a table ranking equity REITs from highest dividend yield (as of 12/31/2023) to lowest dividend yield.
Source: Table by Simon Bowler of 2nd Market Capital, Data compiled from S&P Global Market Intelligence LLC. See important notes and disclosures at the end of this article Source: Table by Simon Bowler of 2nd Market Capital, Data compiled from S&P Global Market Intelligence LLC. See important notes and disclosures at the end of this article Source: Table by Simon Bowler of 2nd Market Capital, Data compiled from S&P Global Market Intelligence LLC. See important notes and disclosures at the end of this article Source: Table by Simon Bowler of 2nd Market Capital, Data compiled from S&P Global Market Intelligence LLC. See important notes and disclosures at the end of this article
For the convenience of reading this table in a larger font, the table above is available as a PDF as well .
Although a REIT’s decision regarding whether to pay a quarterly dividend or a monthly dividend does not reflect on the quality of the company’s fundamentals or operations, a monthly dividend allows for a smoother cash flow to the investor. Below is a list of equity REITs that pay monthly dividends ranked from highest yield to lowest yield.
Source: Table by Simon Bowler of 2nd Market Capital, Data compiled from S&P Global Market Intelligence LLC. See important notes and disclosures at the end of this article
Valuation
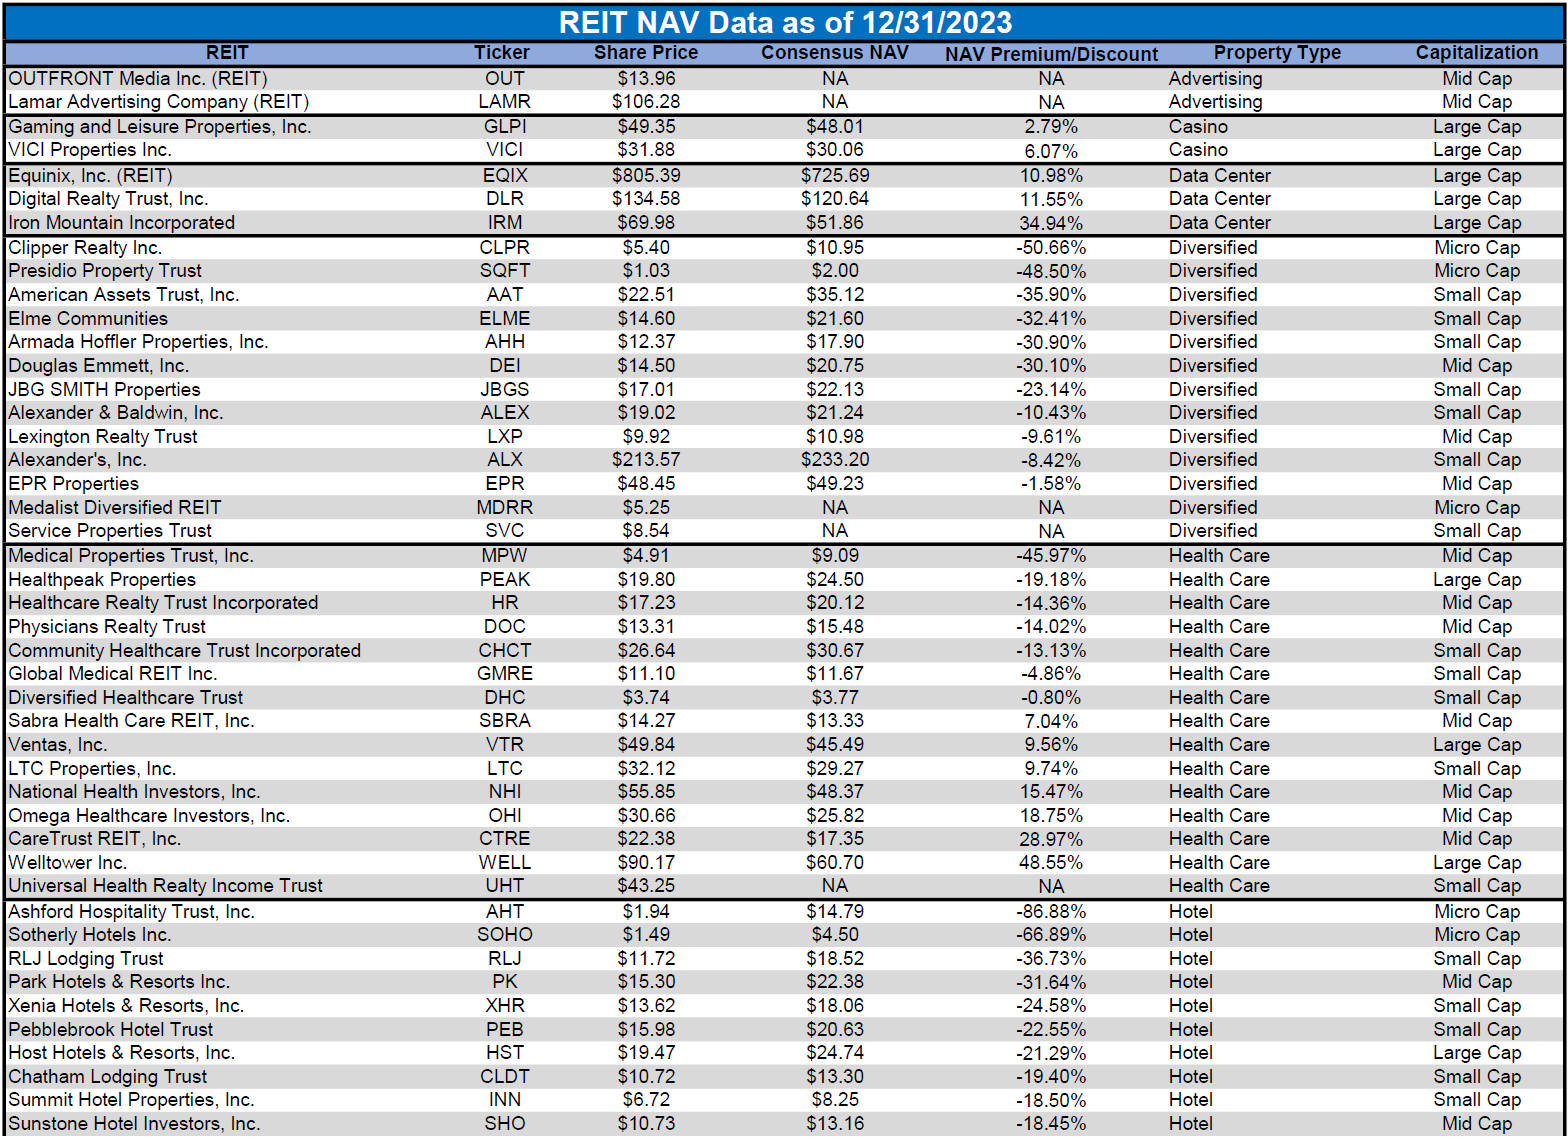
REIT Premium/Discount to NAV by Property Type
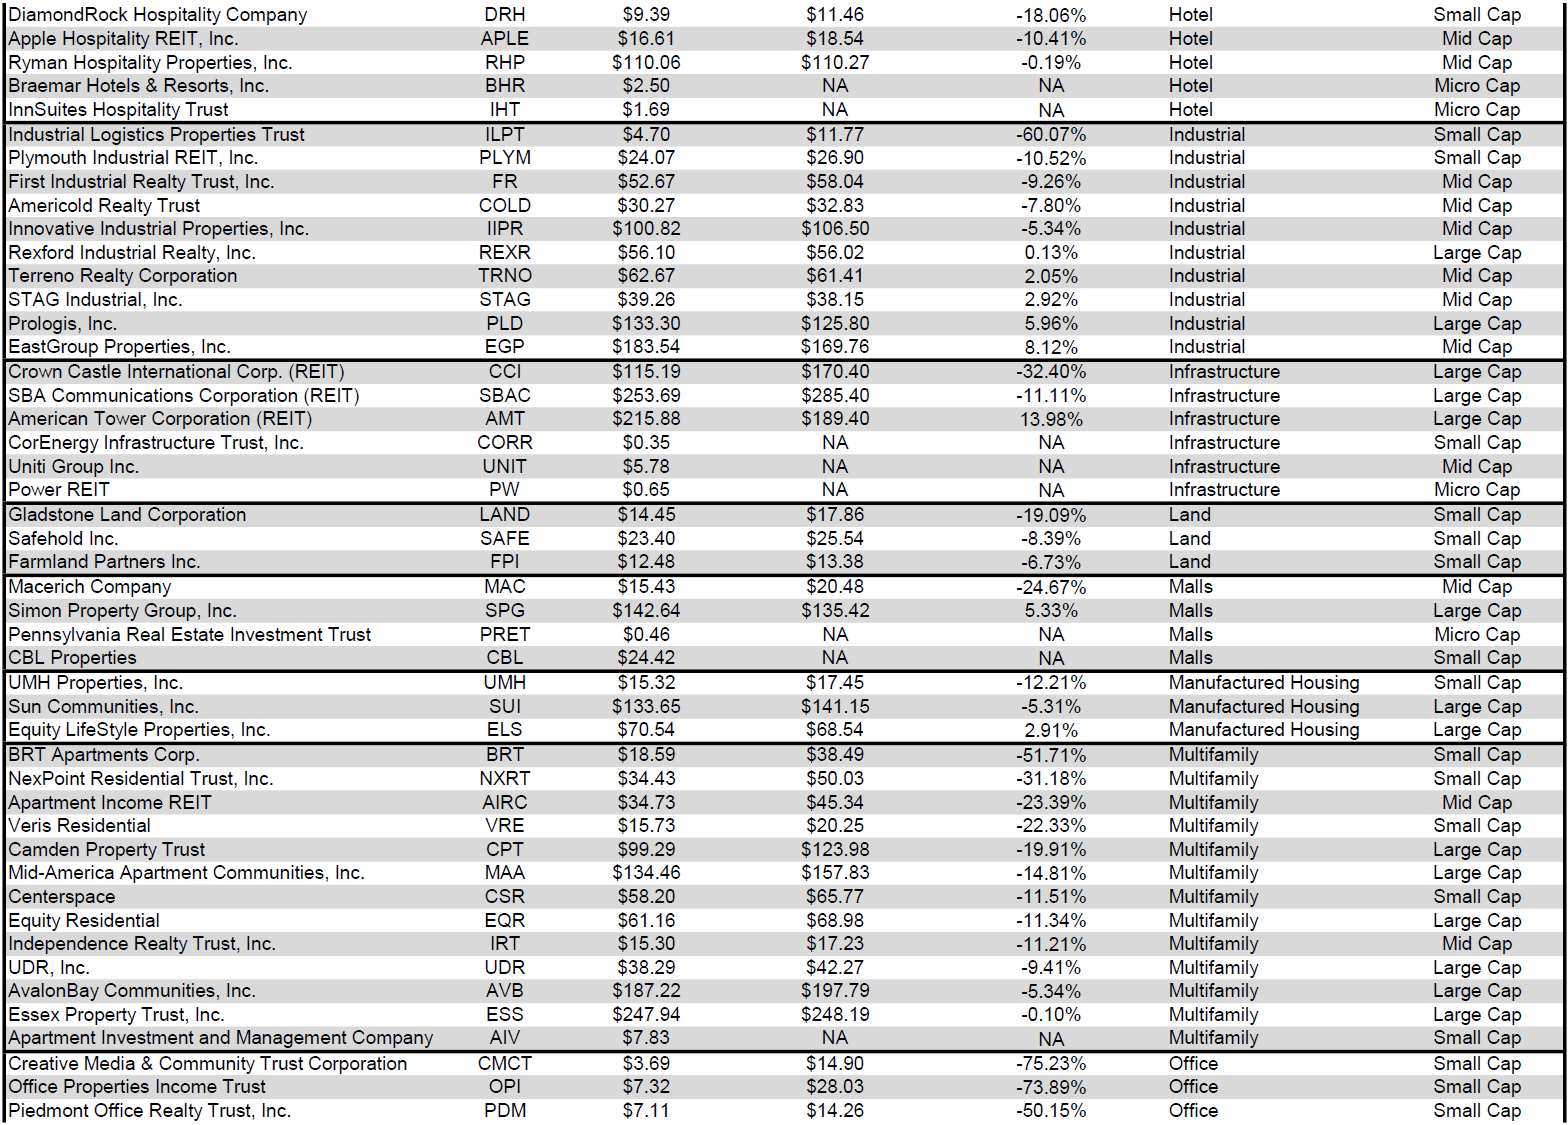
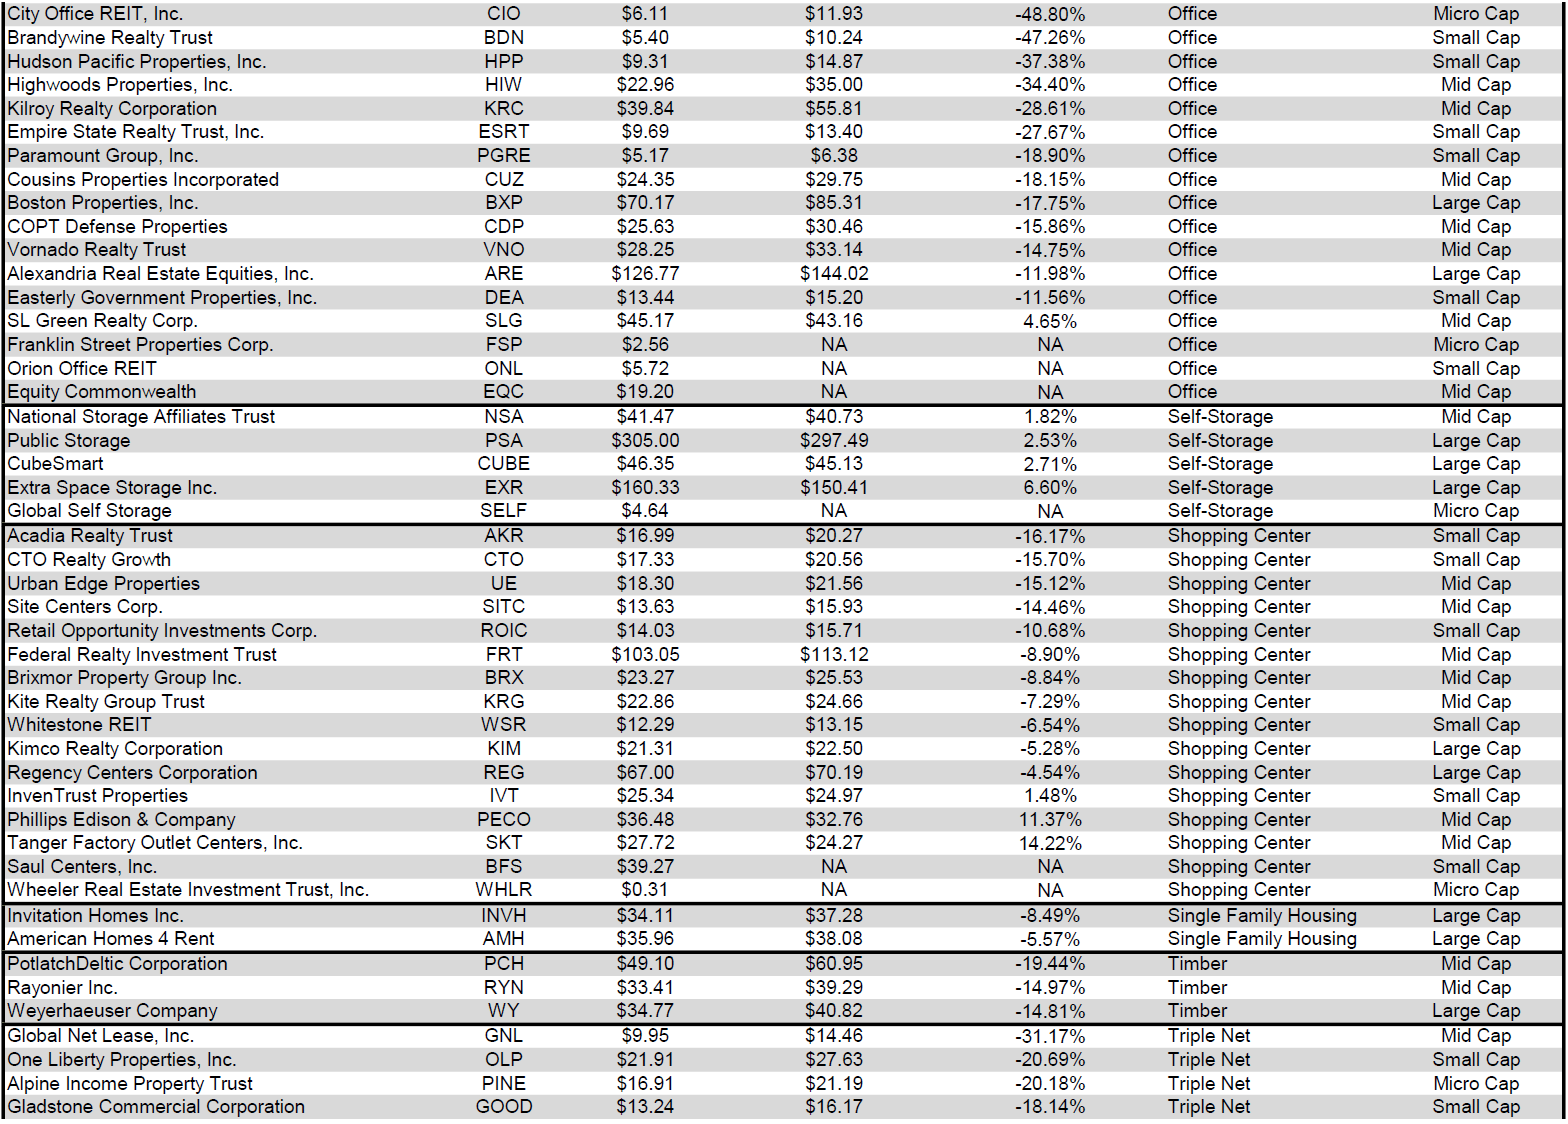
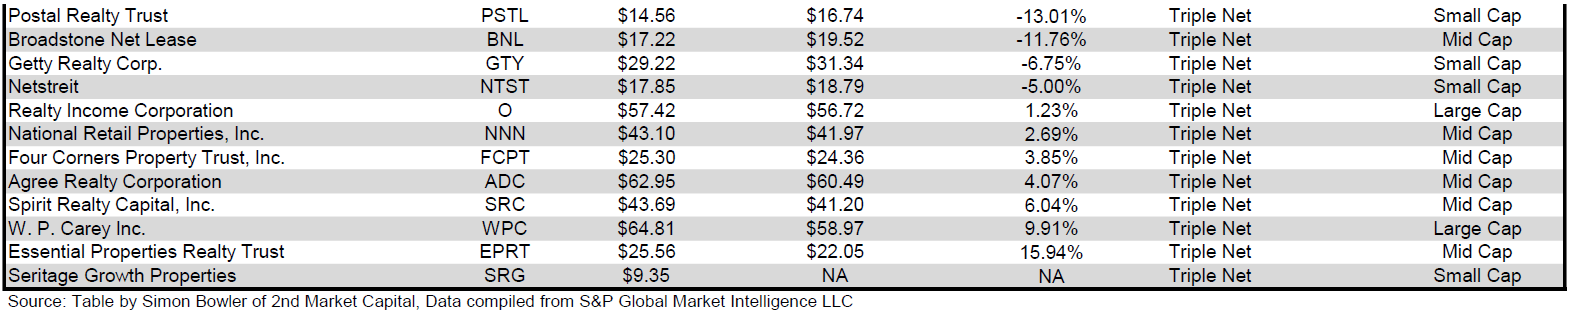
Below is a downloadable data table, which ranks REITs within each property type from the largest discount to the largest premium to NAV. The consensus NAV used for this table is the average of analyst NAV estimates for each REIT. Both the NAV and the share price will change over time, so I will continue to include this table in upcoming issues of The State of REITs with updated consensus NAV estimates for each REIT for which such an estimate is available.
Source: Table by Simon Bowler of 2nd Market Capital, Data compiled from S&P Global Market Intelligence LLC. See important notes and disclosures at the end of this article Source: Table by Simon Bowler of 2nd Market Capital, Data compiled from S&P Global Market Intelligence LLC. See important notes and disclosures at the end of this article Source: Table by Simon Bowler of 2nd Market Capital, Data compiled from S&P Global Market Intelligence LLC. See important notes and disclosures at the end of this article Source: Table by Simon Bowler of 2nd Market Capital, Data compiled from S&P Global Market Intelligence LLC. See important notes and disclosures at the end of this article
For the convenience of reading this table in a larger font, the table above is available as a PDF as well .
Takeaway
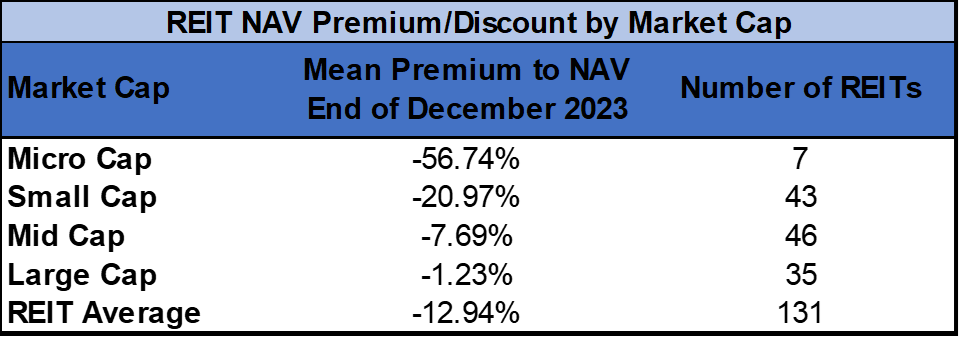
The large cap REIT premium (relative to small cap REITs) narrowed in December and investors are now paying on average about 28% more for each dollar of 2024 FFO/share to buy large cap REITs than small cap REITs (17x/13.3x - 1 = 27.8%). As can be seen in the table below, there is presently a strong positive correlation between market cap and FFO multiple.
Source: Table by Simon Bowler of 2nd Market Capital, Data compiled from S&P Global Market Intelligence LLC. See important notes and disclosures at the end of this article
The table below shows the average NAV premium/discount of REITs of each market cap bucket. This data, much like the data for price/FFO, shows a strong, positive correlation between market cap and Price/NAV. The average large cap REIT (-1.23%) trades almost on par with NAV. Mid cap REITs (-7.69%) trade at a high single digit discount to NAV, while small cap REITs (-20.97%) trade at just under 4/5 of NAV. Micro caps on average trade at less than half of their respective NAVs (-56.74%).
Source: Table by Simon Bowler of 2nd Market Capital, Data compiled from S&P Global Market Intelligence LLC. See important notes and disclosures at the end of this article
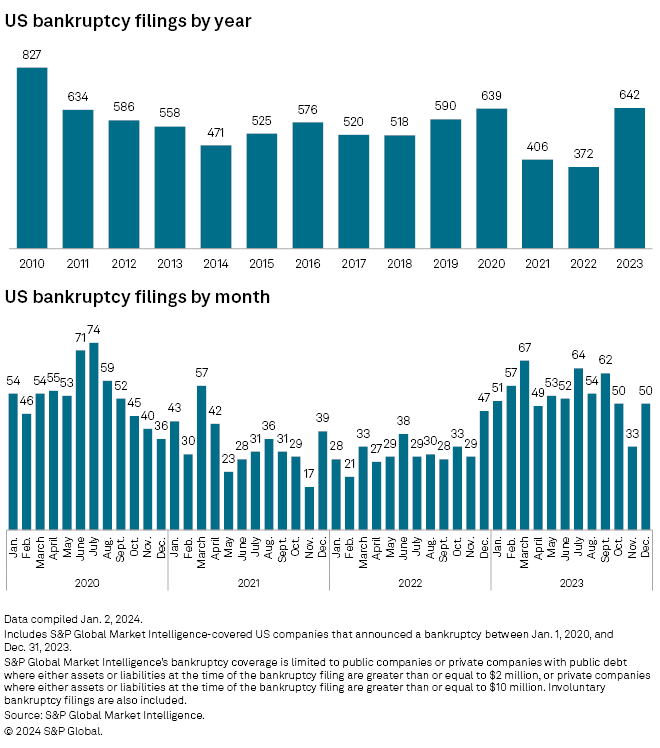
In December the number of bankruptcy filings reaccelerated and marked the 15 th straight month of year-over-year increases in filings. 2023 had the most bankruptcy filings of any year since 2010, even exceeding the elevated number seen during the government-imposed lockdowns of 2020. With great uncertainty surrounding the timing and number of 2024 rate cuts by the Fed, struggling businesses will continue to face a challenging lending environment and it is likely that elevated bankruptcy filing will continue into Q1 2024.
S&P Global Market Intelligence
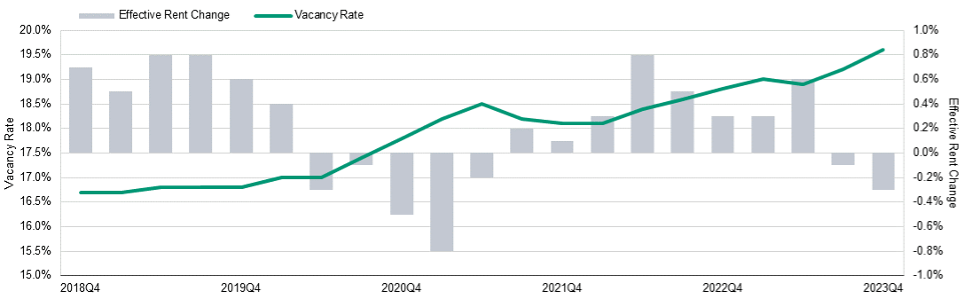
Rising bankruptcy filings is certainly not the only concerning trend worth watching. The office vacancy rate rose to a new record high of 19.6% in Q4 2023, surpassing the prior record of 19.3% that had been reached in 1986 and again in 1991.
Source: Graphic from Wall Street Journal. Data from Moody’s Analytics
Although office vacancy has been trending upward since the beginning of the pandemic, this negative impact had been partially offset by 8 straight quarters (Q3 2021 – Q2 2023) of gains to effective rent. For each of the past two quarters, however, the sharp uptrend in office vacancy has instead been accompanied by declining effective rent changes, magnifying the pain for office landlords.
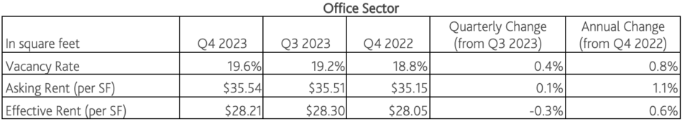
The Q4 2023 office vacancy rate increased by +0.4% quarter over quarter and +0.8% year over year. Although the asking rent per square foot did increase quarter over quarter in Q4 2023, the effective rent declined -0.3%. Despite negative effective rent changes in each of the past 2 quarters, the office sector did still see a +0.6% year over year increase.
This national data, of course, does not suggest that all markets are seeing the same trends. Some markets have seen a disproportionately severe deterioration of fundamentals, most notably San Francisco which saw both the largest increase in vacancy (+5%) and worst negative effective rent growth (-3.6%). Whereas other markets, such as Columbia (-4.0%) and Knoxville (-3.4%), have actually bucked this trend and seen vacancy rates materially improve over the past year.
Source: Moody’s Analytics
This goes to show that it is important to follow both the overall trend and how individual markets and individual REITs compare to it. As office fundamentals rapidly declined nationally in 2023, office REITs appropriately underperformed on total return (+0.48% vs. +8.55%). However, office REITs with NYC-focused portfolios dramatically outperformed. SL Green Realty ( SLG ) (+48.41%), Empire State Realty Trust ( ESRT ) (+46.37%) and Vornado Realty Trust ( VNO ) (+39.24%) all outperformed the REIT sector by more then 3,000 basis points in 2023. With careful investment research and thorough due diligence, significant alpha can be achieved. A key part of that process is understanding fundamentals by market and knowing which REIT portfolios are positioned in the right markets.
For further details see:
The State Of REITs: January 2024 Edition