REIT - The State Of REITs: May 2024 Edition
2024-05-20 03:59:12 ET
Summary
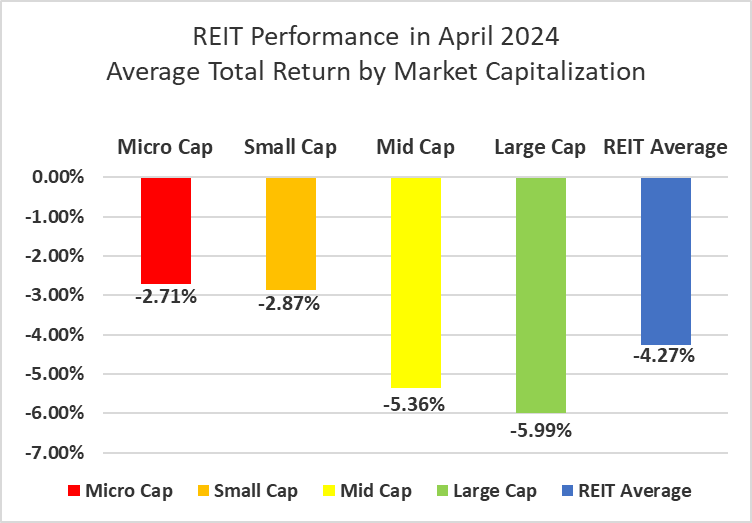
- With a -4.27% average total return in April, REITs have now seen declines in 3 of the first 4 months of 2024.
- Micro caps (-2.71%) and small caps (-2.87%) averaged low single digit declines in April, while mid-caps (-5.36%) and large caps (-5.99%) performed even worse.
- 78.71% of REIT securities had a negative total return in April.
- Only 3 out of 18 REIT property types averaged a positive total return in April. Multifamily REITs (+3.73%) outperformed, while Timber REITs (-13.89%) averaged the largest declines.
- The average REIT NAV discount widened from -15.96% to -20.02% during April. The median NAV discount widened from -15.63% to -19.77%.
REIT Performance
April was a tough month in the stock market, and REITs were not spared from the downturn. Equity REITs averaged a -4.27% total return in April, which was largely in line with the broader market. REITs outperformed the Dow Jones Industrial Average (-4.9%) and NASDAQ (-4.4%), but fell short of the S&P 500 (-4.1%). The market cap weighted Vanguard Real Estate ETF ( VNQ ) saw deeper declines than the average REIT in April (-7.94% vs. -4.27%) and has underperformed year-to-date (-9.12% vs. -7.65%). The spread between the 2024 FFO multiples of large cap REITs (15.8x) and small cap REITs (12.2x) narrowed in April, as multiples contracted 1.1 turns for large caps and 0.3 turns for small caps. Investors currently need to pay an average of 29.5% more for each dollar of FFO from large cap REITs relative to small cap REITs. In this monthly publication, I will provide REIT data on numerous metrics to help readers identify which property types and individual securities currently offer the best opportunities to achieve their investment goals.
Source: Graph by Simon Bowler of 2nd Market Capital, Data compiled from S&P Global Market Intelligence LLC. See important notes and disclosures at the end of this article