ACTV - The Week On Wall Street - A Lack Of Conviction
Summary
- I'm not buying the “Wishful Disinflation” and “Wishful Pivot” theories regarding Inflation and the Fed.
- "Fundamentals" and "Technicals" both suggest stocks could stay rangebound in the coming months.
- The investment backdrop is so fragile any forecast comes with little to no conviction behind it.
The Macro View
Equities have staged an impressive rally in January - S&P 500 +6%, Nasdaq Composite +10%, and Russell 2000 +9%. Along the way, we've seen how the S&P 500 broke multiple technical resistance levels, including the defined downtrend that capped rallies in 2022. That ignited investor optimism over a potential "soft landing" scenario, and there are reasons for some optimism-China reopening, warmer winter pushing natural gas prices significantly lower, and Europe's economy seemingly holding up.
While we are starting to get some clarity on specific issues that caused investor anxiety, there are also some headwinds still out there that can muddy the waters. Those issues are now back in the spotlight, causing near-term investor angst. During the recent surge in equities, I have continued to warn an overly optimistic view is not warranted now. Instead, I recommend exercising some patience-a V-bottom with a BIG move higher for equities remains unlikely.
Economy
The U.S. economy looks to be downshifting. While real GDP growth expanded solidly to close 2022, the quarter ended with considerably less momentum than when it began, with monthly economic data pointing to a clear weakening in growth as the year wound down. That loss of momentum may carry over to Q1. Although consumer spending was robust in January analysts expect spending will be essentially flat in Q1-2023. Despite slightly lower mortgage rates in recent weeks, a continued slide in building permits indicates that residential investment should remain a significant drag on headline growth.
Furthermore, after adding to real GDP in Q4-2022, inventory investment is shaping up to subtract from overall economic growth in Q1. In fact, if you take out the inventory build in Q4, that GDP number is cut in half. Should that forecast come to fruition, a slowing of real GDP growth would reignite concerns that the economy will slip into recession. I suspect the soft-landing holdouts will finally get the reality of the situation when the recession does eventually hit. With Q1 and Q2'22 posting negative GDP growth, some will recognize this as the start of a double-dip recession. After all, if economists cite the Q4 GDP rebound as a sign of a strong economy it's also important to note the contraction in the first half of last year.
Soft Landing Vs. Hard Landing
While more pundits are highlighting the real possibility of a soft landing, at the same time it is difficult to ignore the ten-month slide in the Leading Economic Index, which has a strong historical association with a coming recession. The trend decline in the LEI encapsulates ongoing weakness in the residential and manufacturing sectors of the economy, which remain under significant pressure from waning demand and higher interest rates.
I would like to be proven wrong but I'm not buying the "Wishful Disinflation" and "Wishful Pivot" theories being tossed around by what now seems to be a consensus regarding inflation and monetary policy. I can agree that headline inflation peaked last year, but there is plenty of evidence that it could prove troublesome for the Fed for a while longer. All we have to do is look at the recent CPI, PPI, and PCE reports. Inflation will grind back to the Fed's 2% core target but there exists a decent probability that it may not happen this year. The last CPI report indicates year over year inflation remains at 6.4%.
Moving to the consumer, the HIGH end and upper-middle-income contingent has NOT been affected as much but the bulk of consumers have been hit very hard. I've said it from the outset, the LOWER end consumer will get destroyed and that is what is occurring. What's more, the excess savings for that majority won't last in perpetuity, and that puts pressure on many in that group. Hence the flat retail sales forecast for Q1. At some point, the labor market may start to show some weakness as layoffs expand beyond the tech sector.
In assessing the health of the consumer, it will be important to monitor data points such as credit card usage which is increasing. A downdraft in business investment also still seems likely amid a higher-cost environment and heightened economic uncertainty. Of course, the counterargument, and in my view the ONLY straw in the recession argument, is the Jobs Picture. However, there is a huge discrepancy in how the data is being interpreted. I do not have a rosy view, and that is based on the underlying facts that are always left out of the conversation.
Employment Reality
We discussed this last week. The danger is that the job market may not be as strong as everyone believes. The number of workers is only slightly higher than before the pandemic. The unemployment rate before COVID was 3.6%. It was 3.4% in January. There has been little to no job growth in over 2 years, yet economists are hanging their no-recession argument on this "straw". It seems like years, but the Fed just started raising rates 11 months ago. Those initial hikes are just now hitting the economy and there is an avalanche of hikes behind that first one.
The Tug Of War Continues
It sure appears that stocks already have discounted a soft landing-S&P 500 valuations have shot to 18.5-19x forward earnings on the risk rally. So while there are reasons for cautious optimism, it is offset by the most aggressive rate hiking scene in history. Simply stated, we have never been here before. The soft landing argument says a combination of easing inflation and solid income growth can keep consumer purchasing power stable. Real disposable income growth has been flat or positive every month since July. The counterargument indicated the lagged effects of higher interest rates will lead real disposable personal income to backtrack sharply as the year progresses. How these data points resolve in this push-pull backdrop will help us figure out what comes next. The debates are fierce with each side making their points, but I come away with the notion that ANY forecast by ANYBODY is lacking in conviction because of the uncertainty that is around. Given the start of the year, I've questioned the conviction in the forecasts for new market lows, just as I question the conviction in those that are calling for a new BULL market.
However, at some point, the stock market is apt to take that same approach to this MACRO scene, as the data is one confusing mess. At that point, there will be little to no conviction on either a BULL case or a BEAR case. That will present investors with more volatility as we start to enter Q2. Entering 2023, many market pundits were calling for a challenging first half. Some were calling for new lows during Q1. It hasn't turned out that way primarily because the late-year selling that stretched the market so far to the downside, produced a snapback rally. Many areas of the market have seen violent moves to the upside. This action has distorted the technical scene to the point where no one can forecast market direction with any acceptable level of conviction.
Ladies and Gentlemen, when both fundamental and technical analysis present views that are so shaky that the level of conviction is near zero we have a stock market condition that is treacherous. Despite the talk of soft landings, etc., this is still a BEAR market. That leaves no room for complacency. My short-term bias is the same. A sideways grind (or consolidation), as the market digests its recent strength and assesses the future. I continue to advocate a tactical defensive investment posture, with a focus on less-expensive value, some international exposure, and stocks that are in BULL market trends.
The Week On Wall Street
Investors came back to start the shortened trading week in a sour mood. Interest rates and the US Dollar continue to show near-term strength, and that added to a poor backdrop. All of the major indices sold off with the S&P closing down 2% at 3997. At the end of the day, all of the major averages were in the red for the month. The DJIA had been somewhat of a laggard in '23 and finished the day showing that all of the gains for the year have disappeared.
Wednesday started with the 10-year Treasury trading at the highs for the year (3.95%) and the highest level since last October when the S&P was trading at the BEAR market lows. After yesterday's across-board selloff, the markets traded near support levels seeking to stabilize. However, an intraday bounce failed, and that sent the S&P to a modest loss on the day. The NASDAQ and Russell 2000 posted modest gains keeping investors confused and guessing what may come next.
After four straight days of losses, it was a cliffhanger for the BULLS on Thursday. The S&P set a new low for this recent swoon before stepping back from the cliff in the afternoon session and closing 0.53% higher at 4012. Friday was another step to the edge of the cliff with yet another low set for the week. All of the major indices posted losses for the week. The DJIA's losing skein was extended to four weeks. The S&P made it three losing weeks in a row dropping 2.9% this week.
The Economy
Since this data point is in the rearview mirror it has little effect on the market.
4Q GDP revised down two-tenths.
US GDP Annualised (Q/Q) Q4 S: 2.7% (est 2.9%; prev 2.9%)- US GDP Price Index Q4 S: 3.9% (est 3.5%; prev 3.5%)- US Core PCE (Q/Q) Q4 S: 4.3% (est 3.9%; prev 3.9%)- US Personal Consumption Q4 S: 1.4% (est 2.0%; prev 2.1%)
The one component that is an issue for the market was that Core PCE, the Fed's preferred measure of inflation, is at 4.3%, above expectations of 3.9% . Overall core inflation was revised higher from 4.7% to 4.8%. Inflation data continues to be reported higher than expected then revised higher.
More bad news on Inflation.
Personal Income was weaker than expected (0.6% vs 1.0%) while Personal Spending was higher than expected (1.8% vs 1.4%), so consumers are earning less and spending more. Maybe that's due to higher-than-expected inflation where the headline PCE came in HOT.
The PCE price index rose 0.6% versus gains of 0.2% in December and 0.2% in November. The annual rate was up 5.4% from the prior 5.3% year over year and has slowed from June's 7.0% y/y which was the fastest since 1982. The core rate jumped 0.6% from December's 0.4% The 0.63% rate from April 2021 is the cycle high and compares to the all-time peak of 1.03% from June 1974.
The 12-month rate accelerated to a 4.7% y/y pace from 4.6%.My view remains the same as it has been since mid '22 -- When it comes to Interest rates, Investors better get accustomed to "Higher for Longer".
Manufacturing
Improved U.S. PMI readings, but Manufacturing remains in a contractionary state.
PMI Composite Output Index at 50.2 8-month high.
Services Business Activity Index at 50.5 8-month high.
Manufacturing Output Index at 48.4 4-month high.
Manufacturing PMI 47.8 4-month high.
Housing
A mixed picture
Existing home sales declined 0.7% to a 4 million rate in January, weaker than expected, after slumping 2.2% to 4.03 Million in December. Sales have dropped for twelve straight months and the January pace is the slowest since October 2020. Single-family sales fell 0.8% to 3.59 million. The month's supply was steady at 2.9 for a second straight month and is down from 3.3 in November. The median price fell to $359,000 in January from $366,500. CONSUMER
New home sales climbed another 7.2% to 670k in January after jumping 7.2% to 625k in December. The two consecutive months of gains broke a string of eleven straight months of declines. This is the strongest pace since March. The month's supply of homes fell to 7.9 from the prior 8.7 and is down from the robust 10.1 clip from July and September. The median sales price declined 8.2% to $427,500 after bouncing 1.6% to $465,600.
Consumer
The auto-loan crisis may yet turn into a major storm as the rate of severely delinquent loans has hit levels not seen since the Great Recession. People are not paying their car loans. Not a crisis just yet but watch this trend closely.
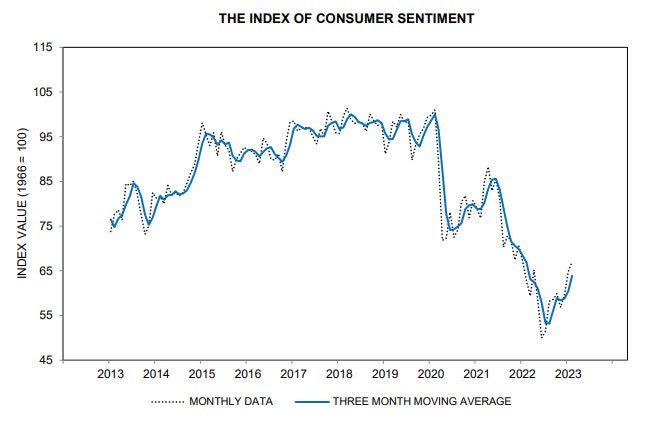
Consumer sentiment improved to 67.0 in the final February print from the University of Michigan survey , up from 66.4 in the preliminary. It is 2.1 points above 64.9 in January and is the highest since January 2022.
Consumer Sentiment (sca.isr.umich.edu/)
Despite the increase, sentiment remains well below the pandemic lows.
The Global Scene
A return to growth adds a more positive narrative to the global scene.
The UK
PMI Composite Output Index at 53.0. 8-month high.
Services PMI Business Activity Index at 53.3. 8-month high.
Manufacturing Output Index at 51.6 9-month high.
Manufacturing PMI(4) at 49.2 (Jan: 47.0). 7-month high .
Eurozone
PMI Composite Output Index at 52.3. 9-month high.
Services PMI Activity Index at 53.0. 8-month high.
Manufacturing Output Index at 50.4. 9-month high.
Manufacturing PMI at 48.5. 2-month low.
Japan
Composite Output Index , February: 50.7
Services Business Activity Index, February: 53.6
Manufacturing Output Index, February: 44.9
However, p erhaps the recent data indicating the EU may escape a recession was a bit premature.
Germany's GDP contracted in Q4 '22. Inflation and the energy crisis took their toll on household consumption and capital investment sending the German economy into contraction by -0.4% in the fourth quarter of 2022.
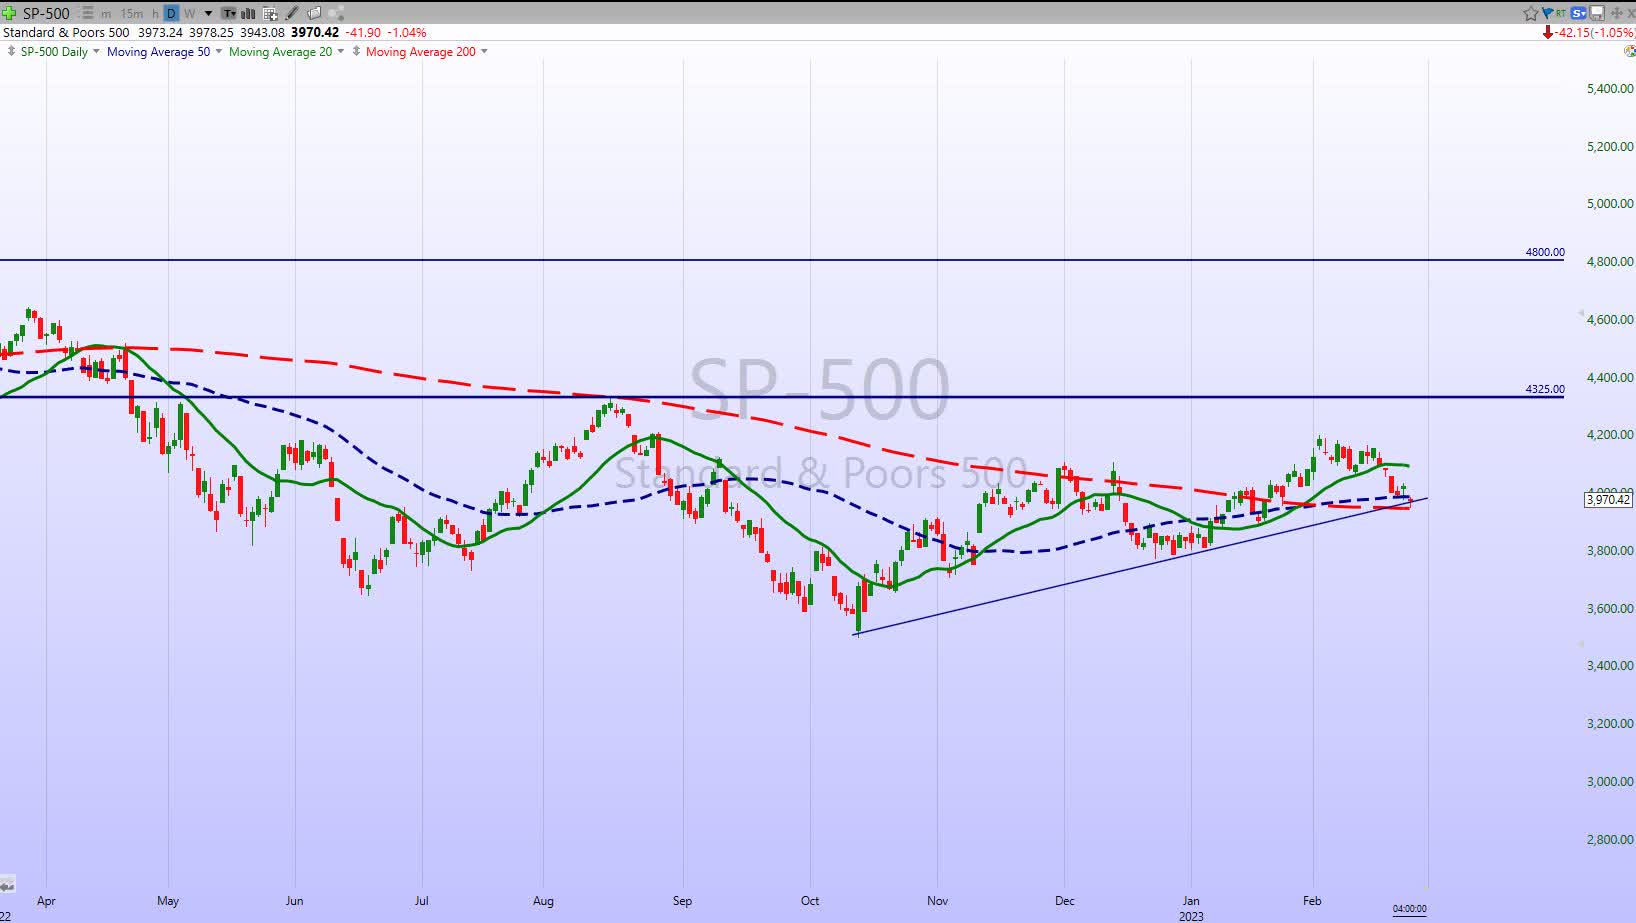
The Daily chart of the S&P 500 ( SPY )
The S&P struggled for the second week in a row and is teetering on the trend line that I penciled in on the chart below.
Below that support line and the 3800-3850 range can come into play. That is precisely where the S&P was the last time the 10-year was above 3.85%. The 10-year closed at 3.95% on Friday. The short-term BULL case that has been bandied about since the start of the year is starting to fade and it appears to be shaping up as a LOW probability outcome. The BEARS are a step away from taking control of the short-term outlook again.
Investment Backdrop
After a sprint out of the gate to start the year. The S&P 500 has moved sideways for the last 20+ trading days. The BULLS say it's a mere consolidation of the rally. The BEARS say the rally is dead and it's time to test support. Not much has changed in this very uncertain investment scene.
Higher inflation expectations over the past couple of weeks, resulting in higher odds of tighter Fed policy, are pushing bond yields higher. The US 2-year yield is up to 4.78%, and now above cycle highs from early November. The US 10-year yield has risen to the highs for the year (3.95%) and the highest level since last October when the S&P was trading at the BEAR market lows. This continues to act as a headwind to equities as P/E multiples have held a solid inverse correlation to bond yields over the past two years. These fixed-income moves add to the near-term caution. If bond yields continue to rise, the market will continue to struggle.
The BULLS will point to the fact that while February hasn't been a fun month so far, considering the fact that the 10-year yield is up over 40 basis points month to date, it could have been a lot worse than this pullback in the indices. Even after this month's weakness, the S&P 500 is still up nearly 4% YTD. I'll chime in and say those gains have come with a good deal of volatility. Friday was the 36th trading day of the year, and already nearly half of all trading days have seen daily moves of at least 1%.
Looking at the charts of the major indices, we are once again left with plenty of unanswered questions. Some indices are sitting on support, and others have broken below the first-level support areas. I see the same picture when I look at individual sectors and stocks. Given the BEAR trends that are still in place, it is hard to have any conviction to suggest this is a time to get aggressive.
We can call this a sort of limbo, for me it presents a very frustrating period. One that I suggest we have to carefully navigate our way through or around it. I added the "around" comment because there are alternatives where we can park some assets and get very decent risk-free returns. Everyone should consider what these alternatives are offering.
Growth Vs. Value
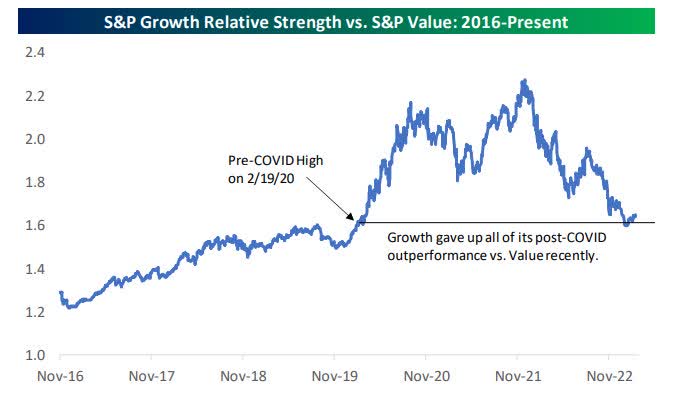
It's worth pointing out the long-term chart of growth versus value again. As you can see below, the first 18 months post-COVID saw growth stocks surge relative to value stocks, but that trend was flipped on its head at the start of 2022. By the end of last year, growth had given up all of the huge post-COVID outperformance it saw versus value, and now things are right back to pre-COVID levels. It has been a round trip.
Growth vs Value (bespokepremium.com)
Since the start of 2023, growth has been outperforming value once again, but this new trend barely shows up on the chart so far.
Fixed Income
The highest-yielding Treasury on the curve right now is the 6-month T-Bill, which managed to close above 5% recently for the first time in 15 years. As shown below, the last time we saw a 5% yield on the 6-month was back in 2007.
6-month T Rate (bespokepremium.com)
That's a pretty good rate of return on a short-term "risk-free" investment and something many investors new to the game have never experienced.
With Treasuries paying this much, it makes the bar for owning "riskier" stocks significantly higher. At 5%, a million dollars will now return you $25k in six months. Owning something else instead, better have a high probability of returning more than that. Therein lies an issue for anyone that is making an aggressive BULLISH case for stocks.
Sectors
Energy
With WTI selling off, the Energy complex ( XLE ) also broke below initial support and is now at a 2-month low. The Long term trend is not in jeopardy and I continue to recommend the Explorers that offer variable dividend plans. Diamondback Energy ( FANG ) is one that I own and have mentioned before. the company posted a solid EPS report and then announced a $2.95 basic and variable dividend payment for the quarter.
Financials
The Financial sector ETF ( XLF ) followed the general market and has now posted losses for 3 consecutive weeks. What appeared to be a potential break out into a BULL market trend has once again fizzled. If we are to see the rally continue this group will have to participate. This failure at resistance presents a poor outlook for the group in the near term.
Commodities
Gold, Silver, and Uranium have all broken short and now intermediate-term support. As noted last week, my trading positions in Gold and Silver were sold. I continue to hold the Uranium position as a long-term play and wait for a better entry level for a trade in the other precious metals.
Healthcare
Healthcare ( XLV ) remains in a short-term funk, but the longer-term trend remains positive. My sector ratings were issued this week and Healthcare remains in an overweight position with Biotech and Medical Equipment as my favored sub-sectors.
Biotech
After a brief run at the $90+ level, the Biotech sector ( XBI ) has pulled back to what should be a good support level. Unless we get a larger market selloff, I expect XBI to consolidate and move higher. It continues to be a favored group for '23
Semiconductors Sub-Sector
The semiconductor ETF ( SOXX ) entered the week at a fairly critical support level. After a robust rally of 14+% in January to start the year, the group has now given back ~ 8% in February. Initial support was taken out and like the rest of the market, the ETF finds itself searching for stability.
Final Thoughts
As I looked over the entire landscape this week, I am once again left with plenty of unanswered questions. Far too many indices, sectors, and individual stocks look very questionable. Similar to last week, there isn't enough evidence to tell me that this rally is dead, but it surely is now on life support.
An anti-business backdrop, inflation that remains stubborn, an aggressive rate hiking cycle, geopolitical tensions, and leading indicators that all point to a recession, are all "issues". That is what investors are working with when they view the investment scene. I'll leave the forecasts for new market highs, and new BEAR market lows to others. The S&P has been in a range since November. If and When the index breaks Above or Below that range, I'll reassess the situation. Until then it's the same approach where selectivity is paramount. Bottom Line: This isn't a market backdrop for amateurs.
THANKS to all of the readers that contribute to this forum to make these articles a better experience for everyone.
Best of Luck to Everyone!
For further details see:
The Week On Wall Street - A Lack Of Conviction