ACTV - The Week On Wall Street: A Sneak Peek Into Q2
Summary
- January started off with the bulls in charge and now we have our first real test of that rally.
- The indices are rangebound and until there is a break either way the backdrop will remain frustrating.
- Earnings will remain the key and so far they haven't cratered. That could keep the market in a trading range.
- Q2 is shaping up as more of the same. A confusing, volatile situation that will be driven by headline data.
"The man who reads nothing at all is better educated than the man who reads nothing but newspapers." - Thomas Jefferson
The Macro View
investors charged aggressively into 2023 to load up on last year's laggards, pressing against what many viewed as negative sentiment and risk-off positioning. That enthusiasm- emboldened by hopes for a post-COVID reopening in China and a benign end to the warm winter in Europe-left the S&P 500 Index up more than 6%, with the tech-heavy NASDAQ Composite's gains approaching nearly double that amount for one of the best Januarys in history. Certainly, some news has been welcome, as the Fed's hiking cycle has matured alongside inflation metrics that have decisively peaked following last June's highs. But given deteriorating economic data, uncertainty remains extreme, with the odds of recession increased to more than 60%. I believe earnings risk is high and current valuations unforgiving in a mild or hard landing recession scenario.
First, I'm going to highlight the landmines that exist before we can start to look at the horizon. The stock market has grown increasingly concerned that the economy and inflation are too strong for the Fed's liking. Recent CPI, PPI, and PCE reports certainly did not provide any ammo to the camp that's expecting inflation to quickly revert to pre-COVID norms.
The Economy Is Good?
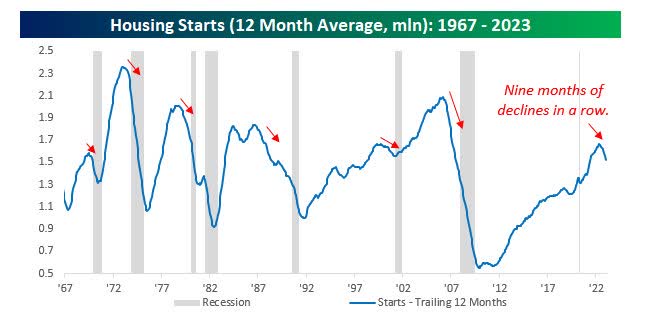
Regarding the economy, Retail Sales came in significantly better than expected but with three straight significantly stronger-than-expected Januarys in a row, seasonal adjustments may not be entirely accurate in the post-COVID world. Outside of the consumer, recent economic data isn't entirely indicative of a booming economy either. While Jobless Claims remain near historical lows, indicators like Small Business Optimism, Leading Indicators, Fed District Manufacturing reports, Industrial Production, Capacity Utilization, Building Permits, and Housing Starts were recently shown to all be in contraction. During January, Housing Starts fell over 4% on a month-over-month basis and more than 20% year over year. Single-family units, which tend to have a greater economic impact than multi-family units, were even weaker falling by 27% while single-family Building Permits fell by 40% y/y.
When looking at the 12-month moving average of Housing Starts, what started as a gradual deterioration has turned into a more dramatic decline that looks increasingly reminiscent of prior rollovers that occurred during or leading up to recessions. We all know by now these aren't the only landmines in the economic data that show a weak economy. This notion that the economy is strong is once again all built around the job picture. The entire "soft landing" viewpoint is focused on that. Just about EVERY data point signals recession and the FED is reacting to inflation which isn't receding so quickly. It was a warning issued early last year. A poor economy with the Fed raising rates to fight inflation is a bomb waiting for a detonator.
Cyclical transitions are difficult to navigate, and as I have said for a while investors will have to be patient in '23 and perhaps well into '24. The near-term focus remains the same. Diversification, Income, Selectivity, and Valuation. I'm not expecting the early chase for the beaten-down areas of the market to continue well into the year. Most of those stocks are entrenched in a deep BEAR market trend that won't revert to BULL mode so quickly or easily.
There isn't enough evidence present for me to change the opinion that recent price action is another in a series of bear market rallies - as opposed to the start of a new bull market. Longer-term investors always have a reason to look past the next recession to the next business cycle on the horizon. Some areas may be poised to drive new market leadership including energy transition, infrastructure/cybersecurity, automation/artificial intelligence, and real estate that revolves around de-urbanization. So while some of that will offer near-term opportunities, the unanswered question is when will that take root and drive a growth economy again? My initial answer is - not for a while. The landmines combined with a higher tax, and high regulatory backdrop are just too much to overcome in the near term.
The Soft Landing View
As we entered this year everyone had the same analysis for the stock market. A very difficult Q1 that could spill over to the next quarter, but stocks would rebound sharply at the end of the year. In keeping with the old axiom, "When everyone is thinking the same, no one is thinking", the stock market has frustrated the Q1 BEAR analysis. However, to be fair we have seen a "change" take place. That is due in part to China's reopening gaining steam and natural gas prices in Europe collapsing. The latter has avoided nasty economic consequences, that I for one was anticipating. All of this talk has morphed into the "soft landing" commentary so much so that it seems to be a consensus view these days.
While there is some validity to this "reset" in investor views, it also seems to be responsible for another round of FOMO, that sparked the January rally. There is a crowd of investors that believe they are missing the bottom and if nothing else wants to get into those beaten-down stocks cause they see "value". I will admit, it has been a powerful shift, one that I certainly did NOT expect. However, I recognize that nothing goes down forever, and there is always a reversion to the mean. That is what the January rally was all about. I also know BEAR markets (yes this is still a BEAR market) have a way of fooling everyone before they're done.
The final stages of the bear market have a way of fooling investors. As we have seen and discussed, the rallies have failed at resistance. We could be experiencing another one of those moments right now. The net result is a bottoming process and recovery that are likely elongated, with normal back-and-forth trading along the way. In bear markets, investors lose confidence. They get frustrated very easily and start to question what is right in front of them. The crosscurrents in the price action and data create a maze that increases their confusion. That is precisely the time to trust your work and ignore the noise. That isn't easy. Until I see said resistance taken out decisively, I will trust what I see in front of me and avoid speculating on a soft landing, hard landing, or no landing.
The FED is still in the picture, and the higher for longer view has a higher probability of occurring than any other scenario. Investors also need to lose this notion that the Fed is causing a lot of damage. It wasn't the Fed that caused this economic situation. The DAMAGE was done when spending and energy policy led to inflation. The stock market is slowly adjusting to that but inflation is still a question mark, and in this headline-driven market, negative surprises won't be tolerated. There is no need to go over every data point that points to a recession, so unless an investor truly believes this time is different, a period of contraction is HIGHLY probable. That domino then affects and topples the earnings domino.
Corporate Earnings At Risk
While everyone is talking about a soft landing no one is talking about the probability of an earnings recession and the economic data being reported increases that probability by the day. Once again, when I look at what is in front of me, I see the reality of poor economic data leading to a pullback in corporate earnings. All of this is simply a matter of timing and magnitude. Could I be wrong? Of course.
Corporate America is resilient and there is always a chance it avoids a significant earnings recession. We know at the end of the day earnings are what drives the stock market. A pro-business backdrop would increase that probability, but we don't have that now. It is more taxes and more regulations. Headlines abound painting the corporate world as the bad guy. That's not an opinion, there is plenty of evidence in the commentary we have heard since this BEAR market began. I also submit that tone, and the BEAR market is NO coincidence. But I digress.
Strategy
My near-term strategy is always formed by looking at the preponderance of the evidence. In doing so, I trust my work, avoid noise, and watch the data. Investors need to listen to the market. That implies they will need to see technical evidence painted by decisive turns in price action. On the fundamental side, it will be imperative that we I need to see a fundamental story that is growth oriented. When the evidence and picture change I'll change my near-term outlook. However, the clarity needed for sustained appreciation in the stock market is also likely to take some time.
I'm also very confident that I won't be late for the next party. When we adopt that "mindset" it allows us to be patient and let this uncertain backdrop play out. History suggests when the next BULL market emerges, there will be plenty of time to reap the rewards. We aren't there yet.
The Week On Wall Street
Trading opened today with stocks coming off their worst week of the year. The S&P is attempting to rebound after three straight weeks of losses, and the burden of proof has shifted to the BULLS. So heading into the last 2 trading days of February, the S&P 500 was down 2.6% for the month.
Those two days turned out to be dull, listless, and boring, with all of the indices chopping around as February came to a close. Other than turning the page on the calendar nothing changed on Wednesday. Another session filled with plenty of indecision on the part of investors. That sentiment lasted until Thursday afternoon and investors witnessed a big reversal that carried into the Friday Session.
All of the major indices posted a gain for the week. The S&P's 1.9% rally ended a three-week losing streak, and the 1.8% rally in the DJIA brought that four-week losing streak to an end. The NASDAQ was the standout rallying 2.6% for the week, while the Russell 2000 small caps added 2.1%.
Global Markets
We shift back to the global scene, and it looks reasonably steady as PMI data around the world stabilized and started to perk up. We have to cite China's reopening offering the hope of further normalization of supply chains and global activity, as the catalyst. As they often do the Euro markets sniffed it out a while ago.
European stocks have managed to make 52-week highs, with almost 10 different national indices reporting new 52-week highs over the last two weeks
Euro Markets (bespokepremium.com)
France is the poster child for equity market performance on the eastern edge of the Atlantic with the index closing at the best levels of the past year this week.
The Economy
Manufacturing reports continue to show an area of the economy in 'contraction'.
Durable goods orders dropped 4.5% in January, a little more than expected, after bouncing 5.1% in December. It is the weakest since April 2020. However, a lot of the drop was in transportation where orders declined -by 13.3%. Boeing accounted for the increase in December and the decrease in this report.
The Dallas Fed drop to -13.5 from an 8-month high of -8.4 in January left the index still above the -20.0 reading in December. Analysts now have a 10-month string of the only sub-zero figures since July 2020. The ISM-adjusted Dallas Fed fell to 48.6 from 49.8, versus a 2-year low of 47.8 last November. The only sub-50 readings since May 2020 were seen in four of the last five months. Today's Dallas Fed headline and component declines join headline and component drops for the Philly Fed but headline and component gains for the Empire State to leave a mix that's consistent with the 15-month pullback from robust peaks in November of 2021.
The Richmond Fed manufacturing index declined 5 points to -16 in February, missing estimates, after falling 12 points to -11 in January. This is the lowest since May 2020 . The index was at 3 last February. Weakness was broad-based with nearly every component in negative territory.
Chicago PMI was also weak rolling in at 43.6 missing the forecast of 45. The headline index signaled a sixth consecutive month of contractionary business activity. Production, Employment, and Prices Paid indicators declined over February, with Production recording the steepest deterioration.
US Manufacturing Purchasing Managers' Index posted 47.3 in February, up slightly from 46.9 in January, and remains in contraction territory. The latest data indicated a solid deterioration in the health of the goods-producing sector.
US PMI (pmi.spglobal.com)
The U.S. ISM index rose to 47.7 in February from a 3-year low of 47.4. That makes for four consecutive sub-50 readings which are the only contractionary figures since May 2020. Most of the various component categories are now in contraction territory.
This week's ISM report joins February declines for the Chicago PMI, the Richmond Fed, the Dallas Fed, and the Philly Fed, but an Empire State gain that, on balance, leaves a mix that's consistent with the 15-month pullback from robust peaks in November of 2021.
Construction spending missed estimates falling 0.1% month over month for January versus a 0.2% MoM gain expected by economists. The surge in mortgage rates amidst Fed tightening has driven a 10% (and counting) drop in spending on residential construction activity. Some of that drop has come from lower home improvement spending, down about 7% from the peak but picking up over the last couple of months.
Single-family spending, on the other hand, has collapsed at a tremendous pace falling 22% since the peak back in April of last year. One interesting detail is the 10% surge in office construction spending over the last four months, which has nearly returned office spending to the pre-COVID record.
It's a different story when it comes to the "services" sector.
Services PMI Business Activity Index registered 50.6 in February, up notably from 46.8 in January. The latest data signaled only a marginal uptick in business activity but brought to an end a seven-month sequence of contraction.
US Services PMI (pmi.spglobal.com)
The ISM-NMI services index saw a modest down-tick to 55.1 in February from 55.2. Analysts saw particular strength in the employment gauge, which popped to a 14-month high of 54.0 from 50.0.
Consumer
Consumer Confidence also disappointed, stumbling to 102.9 in February, much weaker than expected. It is down 3.1 points from the revised 106.0 in January. This is the lowest since November and was at 105.7 a year ago . All of the weakness was in the expectations component which dropped to 69.7, the lowest since July, from 76.0.
Housing
Pending home sales rose 8.1% to 82.5 in January, beating forecasts, after bouncing 1.1% to 76.3 in December. Increases were posted in every region, including a 10.1% pop in the West. The drop in mortgage rates and the better weather in January contributed to the gain. The second straight monthly gain follows six consecutive monthly declines and is only the third increase since November 2021.
The Global Scene
An overall improvement in the global scene as the re-opening in China is a positive catalyst.
Global manufacturing output returns to growth as supply chain constraints ease and mainland China reopens. Manufacturing PMI rises to 50.0 in February. New order intakes move closer to stabilizing while input cost inflation eases to a 28-month low.
Global PMI (pmi.spglobal.com)
China
At 51.6 in February, the headline seasonally adjusted Caixin China Purchasing Managers' Index increased from 49.2 in January and signaled an improvement in overall business conditions across China's manufacturing sector. Though modest, it marked the first improvement in seven months, with the reading the second-highest recorded by the survey since May 2021.
China PMI (pmi.spglobal.com)
The return to more normal business conditions and expectations of further increases in client demand pushed up business confidence regarding the year ahead to a 23-month high. Continued improvement in economic conditions in China will go a long way in helping the global economy stabilize.
Eurozone
The Eurozone Manufacturing PMI fell slightly to 48.5 in February, from 48.8 at the start of the year. The index was pulled lower by the sub-components for suppliers' delivery times.
Eurozone PMI (pmi.spglobal.com)
The "core" of the euro area - Germany and France - saw Manufacturing PMIs fall further below the 50.0 thresholds.
Euro Countries (pmi.spglobal.com)
The UK
Manufacturing Purchasing Managers' Index for the UK posted 49.3 in February, up from 47.0 in January. Although the PMI remained below the neutral mark of 50.0 for the seventh successive month, this was the best reading during that sequence.
UK PMI (pmi.spglobal.com)
Canada
The Canadian Manufacturing Purchasing Managers' Index recorded 52.4 in February. That was up from 51.0 in January, and the highest reading recorded by the survey since last July. It was also the second month in a row that the index has recorded above the 50.0 no-change mark that separates growth from contraction.
Canada PMI (pmi.spglobal.com)
India
India Manufacturing Purchasing Managers' Index was at 55.3 in February, little changed from 55.4 in January and signaling a strong improvement in the health of the sector. The headline figure was also above its long-run average of 53.7.
India PMI (pmi.spglobal.com)
One of the most stable manufacturing conditions since the pandemic.
Japan
At 47.7 in February, the headline au Jibun Bank Japan Manufacturing Purchasing Managers' Index dipped from 48.9 in January, indicating the sharpest deterioration in the health of the sector since September 2020 . The lower reading of the headline index was partly the result of a sharper decrease in new orders.
Japan PMI (pmi.spglobal.com)
Global Services PMI data was also reported on Friday, and similar to the U.S., "Services" are showing a much different picture than manufacturing.
CHINA - picked up from 52.9 at the start of 2023 to 55.0 in February, to signal a back-to-back monthly increase in business activity across China's service sector. Notably, the rate of expansion was the quickest recorded since August and stronger than the series average (53.7) .
The UK - 53.5 in February, up from 48.7 in January.
EUROZONE - rose to 52.0 in February, up from 50.3 in January and above the 50.0 level that separates growth from contraction for a second successive month.
INDIA - 59.4 in February up from 57.2 in January. The Business Activity Index was at its highest level in 12 years.
JAPAN - 54.0 in February up from 52.3 at the start of the year. The index reading was also the highest since last June . Firms often commented that demand was boosted as the impact of the pandemic receded.
Earnings
With more than 1300 reports so far, this earnings season is unofficially over at this point.
Bespoke Investment Group;
The total EPS beat rate actually rose sequentially from 64.6% last quarter to 65.5% this quarter; that's higher than 78% of previous earnings seasons since 2001.
Revenue beat rates are a bit of a different story: they're down to 64.0% and back below the earnings beat rate. The inverse of the EPS and revenue beat rate is the EPS and revenue miss rate. While the EPS miss rate is back near the high end of its historical range, the revenue miss rate still remains low by historical standards.
Turning to guidance, 7.8% of companies raised guidance this quarter, the lowest since the first reporting season after COVID hit. That guidance raise rate is almost the exact median for all earnings seasons since 2001, signaling a return to normal (though guidance may deteriorate further into the weakness of course).
Reporting companies cut guidance at a 10.9% rate this quarter, which is actually a slower rate than the 13.9% last quarter; 10.9% is in the 70th percentile of guidance cut rates historically though, suggesting more weakness than the guidance raise rate might let on. Companies that report guidance but do not raise or lower it (so-called "neutral" or "confirmed" guidance) also hit the highest levels since Q2 of 2007 in this quarter as management teams reiterated previous views."
The Daily chart of the S&P 500 ( SPY )
It sure appeared the S&P was ready to break down when it briefly fell below support on Thursday. The BULLS stepped up and pulled off a sharp rally that now has the BEARS scrambling.
When the dust cleared support held and the start of another rally back to the February highs may have started. We've witnessed "false" starts that have trapped both BEARS and BULLS in this BEAR market, so I'm not ready to declare an "all-clear" signal today.
Investment Backdrop
February is in the books and investors saw equities retreat across the board giving up some of the January gains. Regarding the major indices, only the Transports (+0.50%) posted a gain for the month, the S&P was modestly lower (-2.4%) with the DJIA (-4.2%) suffering the worst loss. Interestingly, the NASDAQ only gave back ~1% of its 10.6% January rally.
Energy led all sectors on the downside with a 6.9% loss. Utilities were also weak losing 5.9% in February, while the Technology ETF eked out a small gain. The metals I am tracking were all crushed in February.
For the year, the Transports (+9.9%), NASDAQ (+9.4%), and the Russell 2000 (+7.9%) are the strongest. The S&P 500 (+3.4%) is modestly higher, and the DJIA (-1.4%) is now in the red.
At the sector level, Semiconductors have helped the Tech indices with a ~18% rally. The other beaten-down ETF in '22 - Consumer Discretionary, shows a ~12% gain this year. Metals and Mining have also rallied 12% YTD. For the year I note that Small-cap Value and Small-cap growth are tracking very close to one another this year. Utilities (-7.8%), Health Care (-6.4%), and Energy (-4.5%) lead to the downside.
Tracking the metals, Silver has suffered the most this year, down ~13%, losing just about all of that in February. Bonds are flat on the year.
Breadth
New 52-week lows remain benign for the NYSE, still slightly elevated for the NASDAQ. Thus there's still no real trouble brewing according to what I see on that front. When I compare current levels with the spikes in 2022. It's easy to see what the difference is between then (trouble) and now. Like all charts, this can all change tomorrow, but we can only assess with the data at hand, and the current data is relatively benign.
Seasonality
Suggests an important low at the end of February, and a rally into the first week of March, followed by weakness into mid-March and then renewed strength. That can play out if the direction of "rates" cooperate.
Headwinds
Rising interest rates have made it tough for stocks lately and now with the chances of a 50 basis point hike increasing and rates surging, the dollar has resumed its move higher after a savage counter-trend selloff from October to January.
USD (bespokepremium.com)
The Bloomberg USD Index traded to two-month highs recently and is sandwiched between its 50-Day and 200-Day moving averages. Dollar strength and rising rates will continue to present problems for stocks in the short term.
The 10-year treasury is once again hovering around the 4% level, and that will continue to be a near-term headwind that the market will attempt to deal with. It is simple now. A move back to the 4.25% range that was seen last October keeps the pressure on equities, while a drop to the 3.75% level will add some fuel to any rally attempt. It was no coincidence that the October '22 stock lows were accompanied by a 4.25% 10-Year treasury.
After hitting a high of 4.08% on Thursday, the 10-year treasury closed this Friday at 3.97%. Given the inverse correlation between rates and stock prices, that added plenty of fuel to the rally on Friday.
I expect to see the market action in Q2 once again be driven by headlines, and the two catalysts mentioned earlier. The direction of the US Dollar and more importantly the direction of the 10-year treasury.
Sectors
The results posted earlier give an investor a good idea of what has taken place in the opening two months of the year. The HOT sectors of '22 have cooled off and the COLD sectors from last year are heating up. I don't know how long this new trend lasts, but I'm not chasing stocks or sectors that remain in long-term BEAR trends. That is a strategy that has been advised and employed since the start of this BEAR market.
Consumer Discretionary
The group ( XLY ) has outperformed the general market so far in '23. I would refrain from indiscriminate buying in the group. When we are talking about the general market environment, selectivity is key. When it comes down to the Discretionary sector it will be vitally important to select the correct stocks.
Even though input costs may come down with the possibility of lower inflation, that may not be enough to offset consumer spending and could come under pressure this year.
Energy
I've stated that I didn't expect another gangbuster year for the Energy ETF ( XLE ), and so far the group shows sideways action and is flat for the year. After last year's outperformance - I'll take the early results. Short-term support has held this week and the sector is grudgingly moving back to the middle of its trading range. With the sector still in a longer-term BULL trend I see no reason to abandon this group that offers some of the best dividend yields in the S&P 500.
Financials
The general market is weak and the Financials ( XLF ) are partly responsible for the poor showing in the indices. The banks are a sector that recently failed to push thru and move back into BULL mode.
The ETF broke below near-term support this week, and if the BULLS don't regroup quickly, it portends further weakness for the general indices as well.
Commodities
The shorter-term charts show that Gold and Silver have completely broken down. My trading position in the Silver ETF ( SLV ) was sold a couple of weeks ago for a modest gain. This past week, I decided to put another trade back on in the $19 range with a very tight stop loss.
The Metals and Mining ETF ( XME ) rallied strongly in January (+14%) and so far the pullback (-1.5%) has been minimal. This is the time to take a hard look at this area of the market as the "green initiative" is going to spur demand for this group of companies.
Healthcare
Healthcare ( XLV ) takes another leg lower as one of last year's bright spots has become the target of the BEARS. The group now leads the downside, it lost 6.5% this year while most sectors are showing positive results. This latest selling has now taken the sector back under the longer-term trendline and has the group aligned in a BEAR market again. We've seen that happen a couple of times last year, but each time the sector regrouped and moved back into BULL mode. It is now a "wait and see" situation. The group finally caught a bid on Friday adding 1.1% on the day.
Biotech
The Biotech ETF ( XBI ) was not immune to the selling and the group has made its way to support. One of the more resilient groups since mid-'22, the BULLS will have to muster some buying here to keep this BEAR to BULL reversal trend in place.
Technology
As of Friday's close, the tech ETF ( XLK ) is up ~13% for the year. It was punished last year (-28%) so this bounce is the start of a reversion back to the mean. How long this strength lasts is anyone's guess. Technology possesses the weakest long-term technical pattern of any other sector. That is no reason to abandon the group, but I'm going to chase anything here either.
Semiconductors Sub-Sector
The Semis ( SOXX ) started the year with a 16% gain in January and added another 1.5% in February. That's a decent performance and is a bright spot in the overall technical picture. I've used the recent strength to sell upside calls against most of my Semiconductor holdings. The longer-term chart view is still BEARISH for the SOXX. There is plenty of work needed to repair last year's damage.
Utilities
Here is one area of the market that I haven't paid a lot of attention to since early 2022. That was a time when everyone was starting to play "defense" and their search for "safety" led them to this sector. Other than a few CORE utility names that I own, admittedly I did miss the rallies to new highs. That move sent the group to ridiculously HIGH historical PE multiples.
Despite their declines from lofty levels, they are still 'expensive' when I look at my alternatives to achieve safety and yield. I'll take a 3-month CD at 4.5+% that I can roll over to achieve more income or simply stand pat and maintain liquidity, over a Utility stock paying 4-5%.
Until the group gets back to ridiculously LOW historical PE multiples, I'll continue to pass on the group.
Final Thoughts
The soft landing crowd is comprised of folks that are focused on ONE economic data point, Jobs. Admittedly that is a very important area to focus on when speaking about the overall economy. Those analysts, pundits, and investors, et al, have decided to dismiss the manufacturing reports, the Fed district Surveys, Economic leading indicators, Small business reports, Consumer confidence, and CEO commentary that are all aligned with a recessionary outlook.
I don't believe this is a time to be downplaying economic results that are showing stress. That isn't an opinion, the facts to support this view are well documented in the reports. The myopic views that are being presented by some analysts, pundits, and research firms will eventually be shown to be simple "cheerleading" analysis that is filled with an "agenda". I'm avoiding that like the plague.
One of the keys to being a successful trader is knowing when to not be an active trader. There are times to push it, to get aggressive, and try to make a significant portion of your annual gains in a short amount of time, and then there are times when you just reduce exposure and go do something else. The month of February has been one of those latter occasions, as the S&P 500 has spent the entire time pulling back within a tight range. That left the "BULL" case for a rally to S&P 4300 hanging on by a thread until Friday's rally.
It should come as no surprise that the decision to become less aggressive has a lot to do with expectations for risk versus reward. That comes down to a market participant's view of the ENTIRE situation. Both the technical and fundamental views have to be accounted for in deciding any near-term strategy, and leave the cheerleading to others.
THANKS to all of the readers that contribute to this forum to make these articles a better experience for everyone.
Best of Luck to Everyone!
For further details see:
The Week On Wall Street: A Sneak Peek Into Q2