AMZN - The Week On Wall Street - Don't Fight The Tape
Summary
- The "Glass Half-Full" party continues; don't dismiss the strength of this move.
- The Yield curve inversion sits at a four-decade high, while the "soft landing" theme gains momentum.
- The Mini-rally takes a breather.
"Change your thoughts and you change your world." - Norman Vincent Peale
The financial markets have gotten off to a hot start in 2023: stocks are up; bonds are up; gold is up; even Bitcoin is up. It has been the opposite of what we saw for much of last year, and, as a result, market sentiment has perked back up too. Inflation readings have slowed and optimism has emerged among investors that perhaps a "soft landing" that avoids a recession may be possible. The severely inverted yield curve and other leading indicators disagree and are not confirming that view.
Risk-taking appears to have crept back into the market, with many beaten-down stocks like ( TSLA ), ( COIN ), ( NVDA ), and highly speculative areas like ( ARKK ) already up a significant amount in just a few weeks. The major averages haven't exactly taken off like rockets, but with the S&P 500 up over 6% in this first month after the kind of year we experienced in 2022, it feels like a big move.
When we saw the market transitioning to a BEAR market last year, what did we say? Don’t fight the tape. That also applies to what appears to be a potential change in pattern. Whether you’re a bull or a bear from a fundamental perspective, do NOT ignore that the technicals started to turn more bullish. While it takes months and months for new longer-term uptrends to emerge after the type of negative action we saw in 2022, we’re seeing downtrends broken across large portions of the market right now and even in some of the most beaten-down areas like Tech and Communication Services.
The formerly popular NY FANG+ index made up of names like Meta ( META ), Amazon ( AMZN ), Netflix ( NFLX ), and Tesla ( TSLA ) fell 48% from peak to trough, but it’s now up ~30% from its lows and has broken its downtrend after making a higher high and higher low over the last couple of months. All of that is taking place when just about everyone is expecting the economy to weaken. That highlights the market theme that everyone should know by now. Stocks discount the future and are likely to bottom well ahead of the economy and fundamentals. That is the reason why an investor can't dismiss the technical view. There are times when we have to put the horrible economic data aside and defer to the price action.
As mentioned last week how long the glass-half-full party will continue is more than likely dependent on the earnings picture now. Earnings are front and center—and rightfully so. Over the last 20 years, more than 90% of the S&P 500’s price return has been explained by earnings. Therefore, accurate readings on earnings are incredibly important to determine the direction of the market. Since the earnings results we are receiving are for the fourth quarter of last year, the reports are effectively "old news." However, the accompanying forward-looking commentary from CEOs will provide us with valuable, real-time insights.
So far there are a couple of "themes" being established.
- Slowing Economic Activity Ahead, and
- Cost Cutting Needed to Maintain Margins
That leads us to see cautious guidance, and in reality, that shouldn't come as a shock to anyone. The poor fundamental backdrop remains a headwind for many sectors of the economy. For example, banks are increasing reserves on expectations of higher loan delinquencies, technology companies are citing broad-based weakness, cutting their workforce, and the railroads are noting muted volume growth.
It is why S&P 500 next-12-month earnings estimates have declined ~3% over the last three months, the largest decrease over that period since 2015 (ex-COVID environment). However, it's what happens next with this economic backdrop that the market will react to next. A bright sunny picture after this cloudy day, and the BEAR market turns into a BULL market. More clouds appear on the horizon, and the S&P stalls at resistance levels and signals the economic growth party is put on HOLD.
While investors will be trying to figure this all out, they will be swayed by the ever-present weather patterns that pop up from time to time, in the form of;
Tailwinds
- Strong Seasonal Period
- Downtrends Breaking
- Internals Strong
- Inflation Peaked
And...
Headwinds
- Recession Indicators Abound
- There Is An Alternative
- Short-Term Overbought
That said, I do not believe that equities are ready for sustainable upside quite yet. Here is the first problem. There is a disconnect that lies in Fed expectations. The market-implied fed funds rate bakes in ~50 basis points worth of hikes left (we just saw the first 25bps) in the first half of 2023, followed by ~50 basis points worth of cuts in the second half. I do not see that developing. First, it assumes inflation drops to near the Fed's target by mid-year. Secondly, I doubt the Fed will be hesitant to begin cutting rates and risk disrupting the inflation moderation so soon. They will want to avoid the stop-and-go policy of the 1970s that led to a prolonged period of high inflation and was very damaging to the economy.
Thus, my original view of "higher for longer" remains. The result is a bottoming and recovery process that may be more elongated in this cycle. What we are witnessing now is a stock market that is adjusting to this different scene. The second issue I'm wrestling with is "Valuation". Normally I would be on board with the market moving much higher in conjunction with a full-blown economic surge accompanied by an earnings spike. However, that is the direct opposite of what is being forecast. The
The economy is going to stagnate for a variety of reasons, the foremost being the weight of the recent rate hikes. The second reason, an overall anti-business, pro-tax, pro-regulatory scene that exists wouldn't suggest the next economic boom is around the corner. That would dictate any significant earnings rebound may not occur for a while, and as the indices move higher with earnings stagnated that means valuation is out of line with reality. Therefore, volatility is expected to persist and for the S&P 500 to trade in a more range-bound fashion over the coming months (potentially between ~3700-4300).
That is the view that I am working with today. The stock market has a mind of its own and perhaps it will look beyond the stagnating economy and maybe earnings won't be as bad as forecast. However, if that is indeed in the cards for this year then the major indices will flip into BULL mode very soon, and I will change my view accordingly.
Either way, it confirms my strategy that selectivity as being key this year. Unlike last year, though, I see the potential for more opportunities in different market areas. We have already seen that in the first few weeks of trading.
The Week On Wall Street
All indices entered the week in an overbought condition. The S&P posted gains in four of the last five weeks, while the NASDAQ was coming off a 5-week winning streak.
On Monday, the dollar continued its counter-trend run higher and so did interest rates with the 10-tear moving back above 3.6%. That helped keep the selling pressure elevated. The DJIA was the best-performing index with a modest loss of 0.10%. While the NASDAQ lost 1% and the Russell gave back 1.4%. That reflected a move away from growth and back to value and defensive sectors as the only groups posting gains were Utilities ( XLU ), and Consumer Staples ( XLP ).
More choppy action on Tuesday that was resolved to the upside and the trading patterns seen on Monday all reversed. Growth came back as the semiconductor ETF gained 3.2%. That rally was short-lived and it was back to sell mode on Wednesday. Almost all of the 52-point S&P gain on Tuesday was given back as the index fell 47 points. One day the BEAR market is declared over. The next, it's deemed nothing more than a Bear market rally. That notion was reinforced on Thursday when the S&P and every other index sold off again.
Stocks posted a modest rebound on Friday, but enough damage was done to end the S&Ps two week winning streak. All of the other major indices followed suit by posting weekly losses.
The Economy
It was an extremely light week in economic reports with no meaningful data hitting the headlines.
Consumer Sentiment was essentially unchanged at 1.5 index points above January. Recent developments in the economy, both positive and negative, have led to mixed attitudes among consumers with little net change in February.
After three consecutive months of increases, sentiment is now 6% above a year ago but still 14% below two years ago, before the current inflationary episode. Overall, high prices continue to weigh on consumers despite the recent moderation in inflation, and sentiment remains more than 22% below its historical average since 1978, and amazingly still below pandemic levels.
The Global Scene
German Factory Orders : December factory orders data in Germany beat estimates as a 15% surge in intermediate goods orders drove the headline beat (+3.2%); that included massive surges in order volumes for electrical equipment and batteries, two important categories to watch for decarbonization spending.
Eurozone Retail Sales : Consumer spending volumes continue to trail off (-2.7%) amidst high inflation in December, creating a downward revision risk for Eurozone Q4 GDP figures.
The Fed and The Yield Curve
The 10-year treasury closed this Friday at 3.74%, which is quite a gain from the close on February 1st at 3.39%. It's one of the "issues" that has slowed the recent rally in stocks. The "2-10 spread" is at its steepest inversion in four decades. US 2-year yields are now 76 basis points above rates on 10-year notes. In the meantime, the Fed's preferred method to measure recession risk is the 3M/10Yr spread. This inversion remains very steep with the 3-month at 4.79%, it is now 105 points above the ten-year. It has been as high as 122 basis points.
"Nuclear Power" and the Transition to "Green" - A case for Uranium
Global CO 2 emissions are not on track to meet the targets of the Paris Agreement: net zero (carbon neutrality) for industrialized economies by 2050, followed by emerging markets shortly thereafter, and there are reasons why that is occurring. Trillions have been poured into the transition with negligible results. Never mind that the targets are unreasonable, the strategy to reduce emissions is deeply flawed. The "transition to "electric" requires the use of fossil fuels more than ever. Without a ramp in carbon-related energy use, there can be no transition. That isn't an "opinion", it's fact. Until the BULK of power generation is done without carbon-based fuels that FACT remains the obstacle to carbon neutrality.
Until this "issue" is FIRST, recognized, and SECOND dealt with, carbon neutrality is a pipe dream. So far step one has not been addressed. In addition, the optimal approach is an “all of the above” strategy . (i.e., using the widest possible range of solutions to accelerate decarbonization). One such solution is nuclear power, and it is as controversial as things get. So much so that the environmental community driving the transition is divided on the question of whether nuclear has a place in a sustainable energy mix.
I'm not going to take sides in yet another, ideological/philosophical debate. If anyone is serious about zero carbon at ANY time in the future, given the technology we have today, it is THE solution. Yet because of "controversy", Nuclear is the world’s only significant source of electricity that had zero growth, in absolute terms, since 2010.
Power Generation (www.bp.com/en/global/corporate/energy-economics/statistical-review-of-world-energy.html)
As shown above, global nuclear generation in 2021 was essentially unchanged from the level in 2010. Bearing in mind that total electricity consumption increased 32% over the past decade, the nuclear portion of the global electricity mix declined from 13% to 10%. The plateau in nuclear generation reflects, quite simply, the fact that the global count of reactors in operation remains relatively flat — not just since 2010, but going back to the late 20 th century. The count as of year-end 2022 — 437 — is virtually unchanged from 435 in 2010, and up only slightly from 416 in 1990.
There is no secret as to why this has played out over time. The drawbacks to Nuclear Power have been presented by environmentalists for decades. They make valid points. Here again, I'm not here to debate that. What we know is by their nature, nuclear reactors have zero CO 2 emissions. No other electricity source can match nuclear’s level of operational reliability . Reactors in the U.S., for example, have achieved an average capacity factor of at least 90% every year since 2012, including 93% in 2021. Given existing technology, renewables are last on the reliability list, and therefore until that changes they cannot be a major reliable source of power generation. That leads us back to the original premise.
Until the BULK of power generation is done without carbon-based fuels that FACT remains the obstacle to carbon neutrality."
Finally, nuclear "wins" on energy density (i.e., the amount of output per unit of area). The Department of Energy notes that all of the used nuclear fuel produced by U.S. reactors over the past 60 years could fit on a football field at a depth of fewer than 10 meters. Energy density is less crucial in the U.S. and China, where space for wind and solar farms is plentiful, but that too will eventually become an issue. Solar and wind farms are not practical nor achievable in densely populated parts of the world. This helps explain nuclear’s high share in France, Japan, and South Korea. Japan and South Korea both have plans to restart reactors (17 by this summer).
Where are nuclear reactors currently being built? The answer is overwhelmingly emerging markets, particularly those where governments do not typically obsess over public opinion.
China plans to accelerate new nuclear projects to combat future electricity shortages, indicating that it could raise the number of new reactor construction approvals to ten or more per year. In 2022, there were ten approvals. It is clear some have received the right message, and are doing something about it.
There is also some uncertainty about the pace of retirements that were originally announced as part of the "Green" movement in the U.K., Germany, and Canada. Perhaps common sense will enter the "green" equation over there. Small module reactors are the next generation in Nuclear, but there are no plans for any until 2028.
So at the moment, it's NIMBY (not in my backyard) and it's zero carbon by 2050. Sorry, there is no cake for those with that flawed mindset. The green transition strategy has been flawed from the outset because it refuses to deal with realities. At some point, the environmentally obsessed have to fold their cards and deal with reality. Something they have shunned since the start of this movement.
The "Plays"
There are limited options to play the nuclear revival, but one way is through the shares of uranium suppliers, as uranium is the main commodity used in nuclear reactors. The uranium market is different from many other commodity markets. Like any commodity, it is impacted by supply/ demand fundamentals as well as funds flows, but given the size of the market, the concentration of uranium supply, and the political nature of uranium, large unexpected price moves can occur. Given that the majority of uranium (U3O8) is used in nuclear reactors, consumption is a function of how many reactors are operating and their output at any given time as the uranium required is an empirical function.
The one exception, however, is when a new reactor enters production there is additional consumption required as “the first core” needs more uranium to start the process. Demand will depend not only on consumption but also on the inventory practices of utilities as many utilities keep an inventory of uranium as the security of supply is critical to the operation of reactors. Utilities may also potentially have a strategic supply of uranium which is partly dependent on their view of future uranium prices.
If uranium is plentiful, and they perceive prices will fall, then they are more likely to keep a small strategic inventory. However, as in the past, if there is an unexpected supply shock (e.g., operating issues at a major mine or political changes) utilities get concerned about supply and not only want to buy uranium to ensure they can operate their reactors, but they may want to build up their strategic inventory given security of supply concerns. At the same time, holders of excess inventory may become less willing to sell if they also become concerned about the security of supply so there is less supply available. This psychological process adds to the volatility of uranium demand/supply.
I've recently published a research report for members that includes investment ideas to follow the nuclear revival theme. From a "technical" perspective, all of the "ideas" reside in a short, Intermediate, and long-term BULL trend. That fits nicely with the strategy I continue to employ in this difficult backdrop.
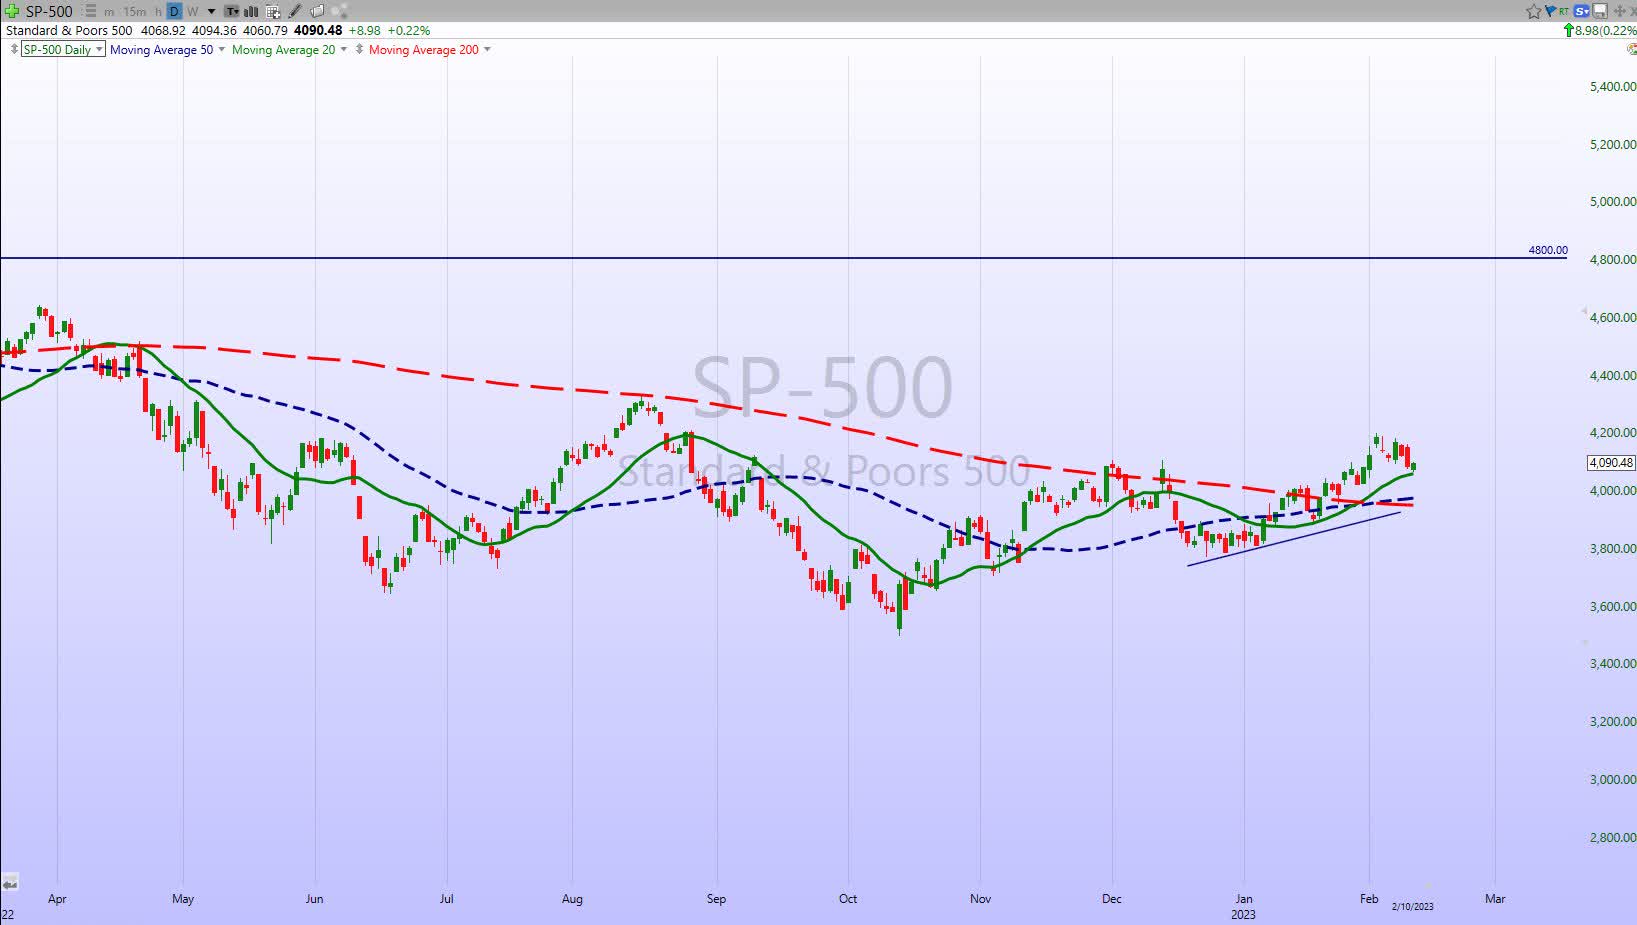
The Daily chart of the S&P 500 ( SPY )
The BULLS look at the DAILY chart of the S&P and will say that this week was a pause in the rally. They will point to the positive and mention the fact that the index held above a very short-term support level. That suggests this mini-rally isn't dead.
In the meantime, the BEARS will tell everyone to step back and take a real good look at that picture. For those that may not see it, they will cleverly point out that the series of lower highs seen since the BEAR market started is still in place.
Another weekend where we can conclude that it's a 50/50 proposition on whether this rally continues.
INVESTMENT BACKDROP
From Stansberry Research
The S&P 500 just hit a triple bullish indicator (a positive return during the Santa Claus rally, the first five trading days of January, and the entire month of January) that's led to positive returns for the rest of the year 90% of the time throughout history. . ."
If you play probabilities that’s a pretty good setup for higher prices. Whether that happens remains to be seen, but I think the probabilities and the "charts" suggest that this short-term mini-rally is the "bullish" path that I outlined for members a couple of weeks ago.
There is a lot of attention on “golden crosses” right now but I don't rely on them to make decisions. A “golden cross” is simply when the 50-day moving average crosses above the 200-day moving average. In other words, it means the average price over the most recent 50 sessions is higher than the average price over the past 200 sessions. You can go back to the DAILY chart of the S&P 500 posted earlier and see what I am referring to.
The analyst community and talking heads love referencing them, but in reality, they aren't telling me anything new, and they guarantee nothing. It's also a fallacy that all 'major bottoms" have a “golden cross” but not all golden crosses mark a major bottom. The Russell 2000 is a great example. The index posted a golden cross in September 2008 but then went on to fall around 50% from that point before making its ultimate low in March 2009. Interestingly, the Russell 2000 also has recently formed a golden cross thanks to the latest market strength.
So while I'm not basing my strategy on this "event", I'm not dismissing it either. The charts speak for themselves now and this near-term price action has to be recognized for what it is. We'll have to wait and see if this is the beginning of a change in trend. In the meantime that leaves both BULLS and BEARS wondering how to play this waiting game.
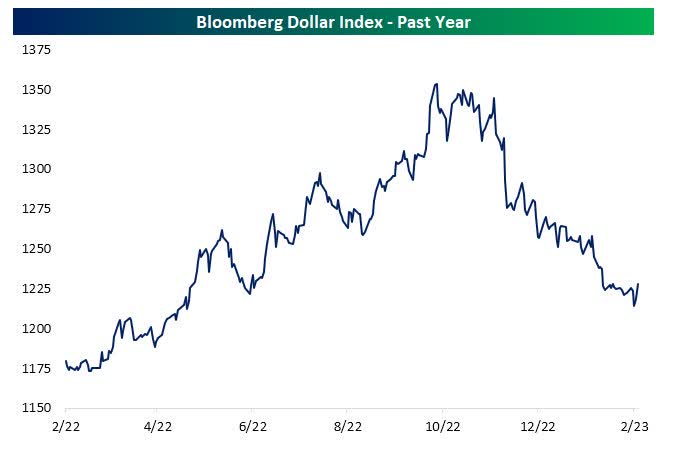
U.S. Dollar
The dollar's decline is a key reason for the strength in stocks with heavy international revenue exposure.
US Dollar (www.bespokepremium.com)
As shown, Bloomberg's trade-weighted dollar index peaked back in the fall and has been on a one-way trip lower, erasing much of the past year's gains in the process. Over the past few days, the dollar has rebounded, but the steep downtrend is still alive and internationally focused companies may continue to have some fuel.
Add this data point to declines seen in rates and the stock market has built its near-term bullish case.
Sectors
Consumer Discretionary
The Consumer Discretionary sector ( XLY ) was decimated last year. It's the leading sector (+17%) so far this year. The group remains in a long-term deep BEAR trend but the shorter term is looking better. I will, however, remind everyone that this price action is typical in BEAR markets.
The problem is we don't know if this is just a classic rebound after a large selloff or the start of something more meaningful. If it is the start of a new uptrend it's sending a signal there are better times ahead for the economy. That dovetails with the message being sent by the Transport index as well.
Consumer Staples
Perhaps a "tell" on this potential change in the market's trend can be found in the defensive-minded Consumer Staples sector ( XLP ). While other sectors are close to breaking into a BULL market trend, Staples have just broken their long-term support line and have taken the first step in moving into a BEAR market.
Energy
I spoke about the Energy ETF ( XLE ) once again nearing a tough resistance zone and similar to past attempts the ETF has pulled back. The ETF did find support and is hovering near those levels as the week ended. When I assembled the Outlook for this year I mentioned that Energy would not post the same type of outperformance that we experienced in '22.
It's early but so far that has played out. The year has started by continuing the sideways pattern we saw at the end of '22. It will be a year when select energy stocks can be bought during periods of weakness, and I would recommend staying with the dividend payers as the first choice.
The Oil services group ( IEZ ) and the associated stocks do not throw off dividends like the "majors" ( CVX ), ( XOM ) or explorers ( CTRA ), ( PXD ), and ( FANG ). However, they just might start being recognized as a group that is in transition, and why I added them to the favored list this year. These are companies that will see their services in demand and their balance sheets will improve dramatically. While Energy stocks are having trouble breakout out to a new high, the ( IEZ ) just recorded one in December.
I would look to add to positions during bouts of weakness in this group.
Financials
I'm always on the lookout for stocks or sectors that are breaking back above resistance and taking the first step in getting back into BULL mode. The Financials ( XLF ) just passed the first critical test. This continues to be a sector of importance and could indeed be the key to moving the S&P back into BULL mode. We will soon see if this was a "false" move.
Healthcare
The Healthcare group outperformed in '22 and now we see money rotating out of 'winners' into the groups that took the brunt of the heaviest selling last year. The Sector ( XLV ) is back in the middle of its short-term trading range, and despite the selling, remains in a longer-term BULL trend. I would not be abandoning this sector in '23.
Biotech
It's not often we see a stock or a sector perform exactly as the chart pattern indicates. But, the price action in this Sub sector of Healthcare ( XBI ) has worked out perfectly. From a successful test at the bottom last June, to the rally that led to the consolidation pattern.
Gold
The chart of the Gold miner ETF ( GDX ) shows the pullback some have been waiting for. The problem is the fullback has broken near-term support levels. If the support range ($30) isn't retaken quickly GDX may have a further fall.
Technology
The NASDAQ and the NASDAQ 100 ( NDX ) have jumped out of the gate in '23 and for the moment have left the field behind. Like the rest of the market, its rally has stalled. I've said all along the technology area of the market has the most work to do after it completely fell apart in '22. If this rally turns out to be a false move, then there could be a lot more pain ahead for the group.
Semiconductors Sub-Sector
Is this another signal that suggests the economy is ready to improve, OR another case where it's a typical rebound after a large selloff?
The Semiconductor ETF ( SOXX ) was wiped out last year losing 35% of its value. It has rallied 20% in the first 6 weeks of trading in '23. Like all of the other examples shown in the charts, it's what comes next that will determine any near-term strategy.
ARK Innovation ETF
If anyone wanted to know if the speculative areas of the market were involved in this rally, you need to look no further than the ARK Innovation ETF ( ARKK ). We've seen and talked about big percentage rallies in the ARKK before, but this time around the rally took on a different look.
Considering it has easily vaulted the 200-day moving average in its first attempt, it is a much stronger (+43%) move than we have seen in the past. . That trendline has capped prices since November 2021! However, the good news may be about to end. The ARKK ETF already shed a portion of that move and it's struggling to stay above that 200-day moving average. A quick break below and this move will have to be considered an imposter.
Final Thoughts
It sure has been an interesting couple of weeks. Fed Day came and went, the market didn’t have to think too hard about it and market participants just hit the BUY button. The resulting action broke the S&P 500 out to a five-month high and provided further evidence in support of the “bull case” I’ve recently outlined to members of my service. AAPL, AMZN, GOOG, and SBUX all missed EPS estimates and that didn't fluster the BULLS. Can you sense the change?
Ironically it was this time last year that I called a turn in the general market. The strategy of "buy the dip" was changed to "sell the rally" as the BEAR market was born. From there it became a very cautious stance that relied on Energy and Healthcare to get us through the year.
As much as I would like to, I won't be convinced and ready to declare an all our BULL market until the indices can overcome the downtrend lines that are still in play. We can see the mixed signals in the charts, and until there is more clarity and see pullbacks contained quickly, it's more "wait and see".
Despite the losing week, the major averages are still extended. The S&P 500, NASDAQ 100, and Russell 2000 are all well above levels that indicate a pullback can come at any time. Last week was the first step, but IF this near-term bull case remains on track, dips should be well-contained.
If an investor is inclined to step on the gas now, they better know where the brake pedal is located.
THANKS to all the readers who contribute to this forum to make these articles a better experience for everyone.
Best of Luck to Everyone!
For further details see:
The Week On Wall Street - Don't Fight The Tape