CA - Third Avenue Value Fund Q3 2023 Portfolio Manager Commentary
2023-10-26 10:20:00 ET
Summary
- Third Avenue Management is a New York City-based asset manager founded in 1986 that utilizes a disciplined, value-oriented, and asset-based approach to investing in publicly traded securities.
- Third Avenue Value Fund returned a negative 2.38% for Q3 2023, trailing the MSCI World Index and MSCI World Value Index.
- The Fund's weighted average valuation has remained relatively unchanged, and the author discusses the recent performance of value investing and the Fund's positioning in the current market.
Dear Fellow Shareholders,
For the three months ended September 30th, 2023, the Third Avenue Value Fund ( TAVFX , the “Fund”) returned negative 2.38%, as compared to the MSCI World Index 1 , which returned negative 3.36%. For further comparison, the MSCI World Value Index 2 returned negative 1.71% during the quarter. This quarter’s performance brings the Fund’s year-todate return to 9.97%, which trailed the 11.55% performance of the MSCI World Index but exceeded the 2.67% performance of the MSCI World Value Index.
A Bit of Nostalgia
After spending nearly 24 years - my entire career and roughly half of my life - as a fundamental, opportunistic, value investor, I was recently called upon to share how it was that I became a value investor in the first place. The onset of the affliction was not difficult for me to recall.
While in high school, I developed an interest in economics and was fortunate to attend a school that offered micro and macroeconomics courses, which was unusual at that time. I earned an economics degree in college but, during that process, I developed a much deeper interest in investing than in economics, per se. I actually knew virtually nothing about investing but, in retrospect, I suppose I was attracted to the entrepreneurship involved in investing and the feedback that investing provides in the form of results, as compared to the more academic and theoretical aspects of economics. I graduated college in 1999, the headiest days of the tech, media and telecom bubble, also known as the dot-com bubble.
All of the excitement around tech stocks and fast money almost certainly contributed to my general interest in investing. Immediately after college, I stumbled into an interesting opportunity to work at Third Avenue Management, Marty Whitman’s firm. I didn’t know anything about Marty, Third Avenue, or value investing, only that I wanted to learn to become an investor and needed a job. Fortunately, I had enough sense to take advice from someone who knew a great deal about investing and patiently explained to me that, if I wanted to be an investor, I would be a fool not to take a job at Marty’s firm. I accepted that profoundly unglamorous job in exchange for some pizza money and the privilege of hanging around Marty and the large group of very bright people who were here at that time.
Soon thereafter, two distinct, but contemporaneous experiences left an indelible imprint upon me. Early on, I was invited to work with an experienced and intrepid Third Avenue portfolio manager who was investing internationally. The first order of business was to help research investment opportunities in Argentina as that country spiraled into an economic abyss, culminating in a currency collapse and a famous sovereign default. In the midst of capital flight, riots, and panicked selling, we made several unusually profitable investments. The two decades hence have corroborated that there is rarely a crisis where absolutely all is lost from an investment perspective.
Meanwhile, my first days at Third Avenue also coincided with a drumbeat of derision aimed at Marty and other acclaimed value-investing peers for their lack of participation in the dot-com craze. It was repeatedly asserted that their definitions of value needed to adapt or evolve and that they failed to grasp that the investing landscape had fundamentally changed. For a person with as little perspective as I had at the time, this was a very confusing situation.
On one hand, you had Marty and other legendary peers in the field who argued, very compellingly, that the investing community had lost its collective mind in rampant speculative excess. On the other hand, you had important new technologies championed by a group of entrepreneurs and investors who were arguing this time is different. And the “this time is different” folks were getting rich, making it very challenging to argue against success. But, if you knew Marty at all, you are aware that he had a steel spine and there was absolutely no chance of him acquiescing. Just months later, in early 2000, the dot-com bubble finally burst under its own weight.
I still to this day am not aware of a specific cause of the collapse, other than the extremes simply having exhausted themselves. Many investors suffered crushing losses, having been seduced by the momentum of rapid equity gains and having completely lost any consciousness of the valuations of the companies they were buying or holding. Many non-professional investors suffered terrible losses of lifetime savings as a result of having been sold irresponsible stories by some of the professionals who managed their money. It all felt deeply distasteful and unjust.
The die was cast for me at that point. It’s fair to say that I was already skeptical by nature but I knew that I would rather not be an investor at all, personally or professionally, than be one who got carried away by great stories. There would never be an investment so appealing that the price I paid for it didn’t matter. And let’s not forget, the Argentina experience taught me that thoughtful, opportunistic, contrarianism, even in the face of extremely challenging circumstances, can be a fantastic way to buy some deeply undervalued assets.
“Now That the Thrill Is Gone, Investors Turn Back to Basics”
— New York Times, October 30th, 2000
Know Thyself
Nearly a quarter century has passed and, during that time, I have come to see some deep wisdom in a few old investing adages. A very wise man I admire once said, “in investing, most things will prove cyclical.” I also frequently hear the phrase “there are many ways to get to heaven” used in an investing context. The point is that there isn’t just one single philosophical approach that leads to investing success over long periods of time, and even well-conceived and highly effective investment approaches are likely to cause the practitioner to look brilliant in some periods and like a fool in others, as investing cycles ebb and flow.
With that being the nature of investing, among the very most important things for an investor to know is which path to heaven he or she is suited to climb, philosophically speaking. It is important to know what types of opportunities one is trying to identify and in which type one’s analytical skills, experience, and temperament might provide some insight or advantage. Self awareness and intellectual honesty help greatly in this evaluation.
For example, the Third Avenue Value Fund has not, in as long as I can recall, made investments in any type of cutting edge or transformative technology. We simply don’t have the specialized technical expertise to win most of the time in that arena. I could say something similar about biotech, where risk of complete failure is high and assessment of that risk requires specific technical knowledge. And furthermore, attempting to identify opportunities in businesses that have been performing fantastically is a fundamentally different mindset than is employed at Third Avenue.
It requires identification of situations where investors are already excited about a company’s prospects, but where the business will, in the future, outperform those very high expectations. And outperforming those high expectations, which are embedded in share prices, is what is required to produce share price outperformance and prove those already bullish investors were not quite bullish enough. Again, this is an approach that is foreign to us and one in which we are unlikely to succeed most of the time. That approach would, furthermore, subject our capital to large amounts of a very undesirable set of risks. Most obvious would be the risk of substantially overpaying.
However, where I do think we have an edge, so to speak, is in identifying situations where investors have become excessively pessimistic. It is common for investor sentiment to become extremely downtrodden as cyclical outlooks deteriorate or, even worse, are severe enough to appear potentially secular. Historically, I think we have a pretty good record of separating the cyclical from the secular, making reasonable estimates of the normalized economics of the businesses we are analyzing, creating a reasonable range of estimated time horizons to recovery, and translating those numbers into a range of estimated internal rates of return.
Then, of course, you also strive to pay prices that create a meaningful margin for error and try to restrict your activity to companies that have balance sheets that will ensure that the companies can survive the downturn or, even better, enhance their businesses via countercyclical investment, or the failure of poorly-capitalized competitors. We have also had success in special situations, such as companies just emerging from bankruptcy and companies that are transforming in some unappreciated way, making historical financials mostly irrelevant, or future earnings forecasting challenging.
Moreover, in recent years, as technology, disruption, and growth have enraptured equity markets, we have seen an unusual disinterest in some very decent companies trading at very low multiples of current operating earnings. The idea in this arena is not just to appraise the sustainability of the current earnings or cash flow streams, but to identify opportunities with positive asymmetry. Said differently, we are looking for companies that are sufficiently cheap to contribute to Fund outperformance based on current, temporarily muted operating conditions, but also where the probabilities, in our view, are in favor of operating performance improving rather than deteriorating.
Marty used to use the phrase “good enough on an as-is basis.” In my experience, the prevalence of this latter class of opportunity is itself cyclical and the 2017 – 2021 period reminds me a great deal of the early 2000s, when it was relatively common to identify attractive companies, trading at distressed valuations, but without any actual operating or financial distress. In other words, from time to time, a broad-based growth stock obsession has a way of making value investing a fundamentally less competitive business.
State of Affairs
We are mostly pleased with Fund performance in recent years, notwithstanding some commentators referring to recent years as dark days for value investing generally. During the last five years, the Fund has produced an annualized return of 9.04%, which compares favorably to most relevant indices and most peers, building upon an admirable Fund performance record spanning more than three decades. But that is the past, and where does the recent strength of performance leave the Fund’s attractiveness today, particularly in light of global equity markets that look pretty expensive in aggregate? In order to address that topic, we offer several points of perspective:
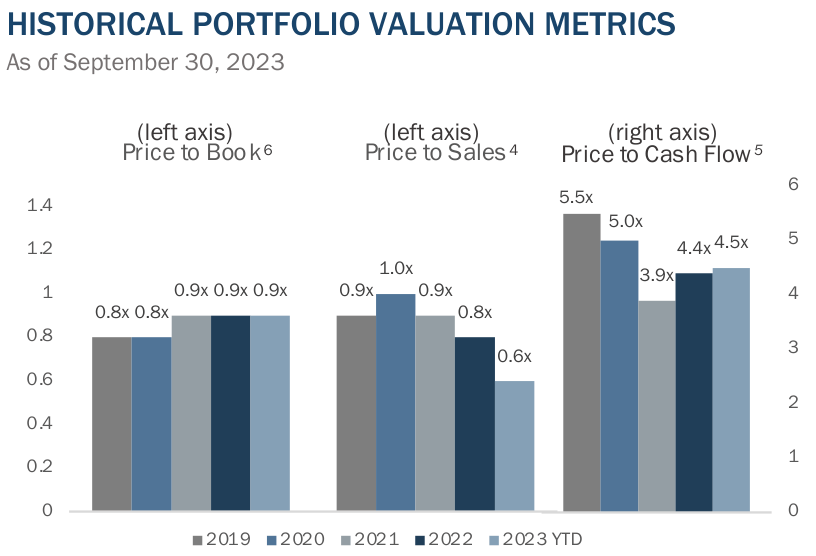
First, as of quarter end, the Fund was trading at about 6x trailing earnings, 0.6x sales, and 90% of book value, each statistic approximately one-third of the corresponding valuation of the FTSE All-World Index. As we have said many times in the past, statistical valuations based on GAAP or IFRS accounting figures are far from the be-all and end-all of valuation methodologies. However, they do have the benefit of being objective and methodologically consistent over time, as compared to estimates of net asset value or estimates of private market values, even though those are very valuable as well.
In spite of Fund returns over the last five years, the Fund’s weighted average statistical valuations are essentially unchanged over the period. In my view, there are two primary reasons for that; a) in general, the returns of our holdings and, in turn, the returns of the Fund, have largely mirrored the growth in underlying business value of our holdings, without much benefit from multiple expansion and b) where individual company valuations have expanded materially, causing strong performance - but also position size growth and a fairer valuation - we have generally trimmed or exited those positions causing turnover in the last couple of years to run a bit higher than we would normally expect as we redeployed capital into new opportunities.
After all, the Fund is an actively-managed strategy, not a cap-weighted index where new dollars are increasingly deployed into past winners.
Second, in order to understand how the Fund’s weighted average valuation hasn’t changed materially, it is very helpful to understand what has been happening beneath the surface of the “dark days for value investing.” For almost ten years prior to 2022’s material equity market correction, expensive companies in the U.S. became relentlessly more expensive, and cheap companies mostly went sideways from a valuation perspective and, at times, became even cheaper. The heavy weight of U.S. equities within global indices transfers this phenomenon into broader global equity indices, as well. The connection of this phenomenon to low-interest rates, and the growth of passive indexation, is often discussed as the proximate cause, but that is a larger discussion beyond the scope of this particular letter.
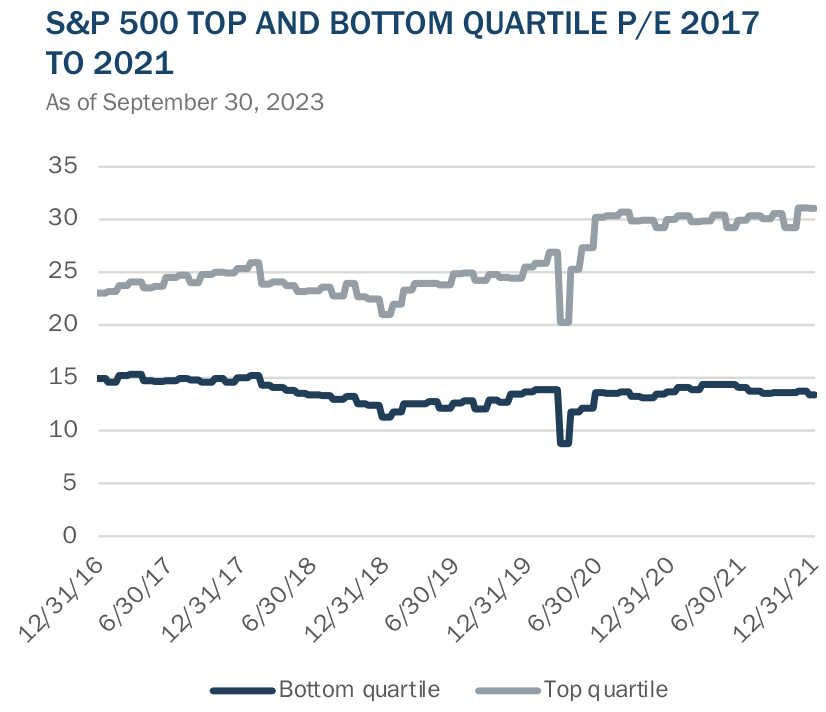
As an illustration, we can examine the experience of the five years prior to the global equity correction of 2022. Within the S&P 500, the most expensive quartile of the index constituents traded at 23.1x earnings at the end of 2016 and at 31.1x earnings at the end of 2021, a huge multiple expansion providing a powerful performance tailwind that is incremental to whatever underlying business value growth had been generated during that period of time. However, the least expensive quartile of index constituents traded at 14.9x earnings at the end of 2016, and at 13.4x at the end of 2021, experiencing declining valuations and a performance headwind detracting from underlying business value increases.
Of course, these are averages and they inherently create huge generalizations. Individual businesses exhibited all manner of performance within those quartiles and, in any event, Third Avenue does not restrict its activities to statistically cheap securities. Some of our investments have little or no accounting earnings at the time of investment, making them appear statistically expensive. However, the averages do certainly depict a broad phenomenon that occurs from time to time within equity markets, where the relationship of cheap companies to expensive companies - meaning the valuation spread between them - waxes and wanes cyclically over time.
In this particular episode, by the end of 2021, the spread in U.S. equity markets reached the widest levels in more than 30 years, an extremely unusual level. In our view there are several important implications; a) valuation dispersion reached levels greater than those experienced during the dot-com bubble, the aftermath of which gave rise to a stretch of some of the best relative performance years ever produced by value strategies broadly, b) we do not view it to be a coincidence that the Third Avenue Value Fund produced its strongest relative outperformance year in its 32 years of operation during 2022, when a partial correction from these peak valuation differential levels occurred, and c) in my personal view, the stretch from 2017 – 2021 may have been very challenging for value strategies from a relative performance perspective, but the derating of some very attractive and cheap, but neglected, companies produced one of the most favorable investing environments of my career.
This latter point is defined, in my mind, by the relative prevalence of distressed valuations attached to companies where there is no discernable financial or operational distress.
Third, one way to think about Fund returns is within the conceptual context of earnings yield - which is essentially the inverse of a price-to-earnings ratio - meaning earnings per share divided by the share price. In a purely theoretical sense, if you pay 8x earnings for an entire portfolio of businesses, assuming earnings are static in the future, that would translate into an earnings yield of 12.5% on your cost basis.
Further, unless the companies retain capital and diminish its value through bad decisions, 12.5% would probably not be a bad approximation of the future fund returns over time. As an aside, over long periods of time, that type of return would probably be sufficient to generate a good bit of outperformance, even if the returns of growth stocks and highly leveraged strategies in recent years have conditioned many people to expect returns above those levels, leading to a disinterest in slower growing but very inexpensive companies.
In the real-world things do get more complicated. Appraising the persistence of a company’s earnings and cash flow streams is easier said than done. Investing is difficult and mistakes will be made. Additionally, it is frequently the case that cheaper companies are cheaper for a reason. One common reason is that many do retain income and reinvest some amount of capital, or do acquisitions, which produce returns on that capital that are below the company’s cost of capital.
Value leakage can certainly occur at the hands of poor capital allocators. And finally, periods like the last five years, in which cheap companies just broadly get cheaper through multiple compression, can provide yet another headwind to performance. However, if those are some of the potential headwinds, one of our primary weapons to combat them is thoughtful use of contrarianism to create positive asymmetry. To the extent that we are successful at buying companies trading at low multiples of earnings or cash flows 3 (cheap on a what-is basis), when the earnings or cash flows are temporarily at depressed levels, cyclically or idiosyncratically, then we may be successful at stacking the odds in favor of operating performance improving in the future to combat mistakes, bad luck, value leakage, and the potential for multiple compression.
Finally, publicly-traded securities markets can be erratic and capricious. Even when your strategy is effective, your judgment is sound, and you have made what will, over time, prove to be alpha-generating decisions, the prices of the securities one owns are very unlikely to move in your favor consistently and progressively within periods as short as a day, a quarter, or even a year or two. For that reason, consistent outperformance is just not a reasonable expectation for long-term value investing strategies.
Quarterly Activity
During the quarter ended September 30th, 2023, the Fund did not initiate any new positions or exit any existing positions. The Fund trimmed a number of holdings for a variety of reasons including the management of position sizes and tax management. The Fund also added to several existing positions. As a result of that activity, cash holdings grew during the quarter and ended the period at 17.1%.
Thank you for your confidence and trust. We look forward to writing again next quarter. In the interim, please do not hesitate to contact us with questions or comments at clientservice@thirdave.com .
Sincerely,
Matthew Fine
| FUND PERFORMANCE |
| 3Mo |
| 1Yr |
| 3Yr |
| 5Yr |
| 10Yr |
| Inception |
| Inception Date |
| Third Ave Value Fund (Inst. Class) |
| -2.38% |
| 38.99% |
| 29.01% |
| 9.05% |
| 7.00% |
| 10.46% |
| 11/1/1990 |
| Third Ave Value Fund (Inv. Class) |
| -2.44% |
| 38.64% |
| 28.67% |
| 8.77% |
| 6.73% |
| 6.91% |
| 12/31/2009 |
| Third Ave Value Fund (Z Class) |
| -2.37% |
| 39.12% |
| 29.14% |
| 9.16% |
| N/A |
| 7.92% |
| 3/1/2018 |
TOP TEN HOLDINGS |
| Warrior Met Coal, Inc. ( HCC ) |
| 8.0% |
| Tidewater, Inc. ( TDW ) |
| 5.5% |
| Capstone Copper Corp. ( CSCCF ) |
| 4.5% |
| Bayerische Motoren Werke AG ( BMWYY ) |
| 4.0% |
| Bank of Ireland Group PLC ( BKRIF ) |
| 3.9% |
| Valaris, Ltd. ( VAL ) |
| 3.9% |
| Ultrapar Participacoes S.A. ( UGP ) |
| 3.6% |
| Subsea 7, S.A. ( SUBCY ) |
| 3.5% |
| Deutsche Bank AG ( DB ) |
| 3.4% |
| easyJet PLC ( EJTTF ) |
| 3.3% |
| TOTAL |
| 43.6% |
IMPORTANT INFORMATIONThis publication does not constitute an offer or solicitation of any transaction in any securities. Any recommendation contained herein may not be suitable for all investors. Information contained in this publication has been obtained from sources we believe to be reliable, but cannot be guaranteed. The information in this portfolio manager letter represents the opinions of the portfolio manager(s) and is not intended to be a forecast of future events, a guarantee of future results or investment advice. Views expressed are those of the portfolio manager(s) and may differ from those of other portfolio managers or of the firm as a whole. Also, please note that any discussion of the Fund’s holdings, the Fund’s performance, and the portfolio manager(s) views are as of March 31, 2023 (except as otherwise stated), and are subject to change without notice. Certain information contained in this letter constitutes “forward-looking statements,” which can be identified by the use of forward-looking terminology such as “may,” “will,” “should,” “expect,” “anticipate,” “project,” “estimate,” “intend,” “continue” or “believe,” or the negatives thereof (such as “may not,” “should not,” “are not expected to,” etc.) or other variations thereon or comparable terminology. Due to various risks and uncertainties, actual events or results or the actual performance of any fund may differ materially from those reflected or contemplated in any such forward-looking statement. Current performance results may be lower or higher than performance numbers quoted in certain letters to shareholders. Date of first use of portfolio manager commentary: October 13, 2023 1. The MSCI World Index is an unmanaged, free float-adjusted market capitalization weighted index that is designed to measure the equity market performance of 23 of the world’s most developed markets. Source: MSCI. 2. MSCI World Value: The MSCI World Value Index captures large and mid-cap securities exhibiting overall value style characteristics across 23 Developed Markets ((DM)) countries. The value investment style characteristics for index construction are defined using three variables: book value to price, 12-month forward earnings to price and dividend yield. Source: MSCI 3. Cash Flow: Cash flow is the net cash and cash equivalents transferred in and out of a company. Cash received represents inflows, while money spent represents outflows. 4. Price to Sales: Weighted harmonic average of the ratio of current share price to its trailing 12-months sales per share of each security holding invested in the portfolio. 5. Price to Cash Flow: Weighted harmonic average of the ratio of current share price to its trailing 12-months cash flow per share of each security holding invested in the portfolio. 6. Price to Book: Weighted harmonic average of the ratio of current share price to its book value per share of each security holding invested in the portfolio. Forward price-to-earnings (forward P/E) is a version of the ratio of price-to-earnings (P/E) that uses forecasted earnings for the P/E calculation. While the earnings used in this formula are just an estimate and not as reliable as current or historical earnings data, there are still benefits to estimated P/E analysis The relationship between return on capital and cost of capital is far more complex than we are suggesting here. Our team frequently invests in companies where, at the time of our investment, cost of capital looks very high and return on capital very low. Cost of capital and return on capital, and the relationship between them, can sometimes erroneously be perceived to be immutable, whereas in reality they are constantly in flux. This topic is likely to be the subject of a future letter. Past performance is no guarantee of future results; returns include reinvestment of all distributions. The above represents past performance and current performance may be lower or higher than performance quoted above. Investment return and principal value fluctuate so that an investor’s shares, when redeemed, may be worth more or less than the original cost. For the most recent month-end performance, please visit the Fund’s website. The gross expense ratio for the Fund’s Institutional, Investor and Z share classes is 1.22%, 1.47% and 1.16%, respectively, as of March 1, 2023. Risks that could negatively impact returns include: fluctuations in currencies versus the US dollar, political/social/economic instability in foreign countries where the Fund invests lack of diversification, and adverse general market conditions. The fund's investment objectives, risks, charges, and expenses must be considered carefully before investing. The prospectus contains this and other important information about the investment company, and it may be obtained by calling 800-443-1021 or visiting Third Avenue Management . Read it carefully before investing. Current performance results may be lower or higher than performance numbers quoted in certain letters to shareholders. Third Avenue offers multiple investment solutions with unique exposures and return profiles. Our core strategies are currently available through '40Act mutual funds and customized accounts. If you would like further information, please contact a Relationship Manager. |
Editor's Note: The summary bullets for this article were chosen by Seeking Alpha editors.
For further details see:
Third Avenue Value Fund Q3 2023 Portfolio Manager Commentary