NLCP - Three Small Cap REITs That Can't Be Beat
2023-04-21 07:00:00 ET
Summary
- The tradeoff for investing in large-cap stocks can be easily traced back to the institutional buyers - led by ETFs and mutual funds.
- They have a higher degree of analyst coverage and much lower risk tolerances.
- We're announcing that we will be incorporating a new portfolio called “Mining for Dividend Diamonds” that will include REITs and other income gems.
Over the last several weeks, our team has been researching exchange-traded funds ("ETFs") such as Vanguard Real Estate Index Fund ETF Shares ( VNQ ) and iShares U.S. Real Estate ETF ( IYR ). We’ve noticed that the majority of attention in the ETF sector has been the largest 25 or so names.
Notably, nearly half of the smaller-cap real estate investment trusts ("REITs") are covered by two or fewer analysts, and they have 75% less institutional ownership than their large cap peers.
The tradeoff for investing in large-cap stocks can be easily traced back to the institutional buyers - led by ETFs and mutual funds -- that have a higher degree of analyst coverage and much lower risk tolerances.
Conversely, these small-cap REITs lack the same Wall Street coverage and investor interest can result in shares remaining undervalued -- especially in down markets -- for extended periods of time.
Of course, part of the conundrum is that because these smaller-cap REITs have very little research coverage, it’s up to the investor to spend time on due diligence. In order to screen for the best opportunities, you must take the time to examine key data such as:
- Quality of Earnings
- Strength of the Balance Sheet
- Safety of the Dividend
- Alignment of Management Team.
So, these under-analyzed small-cap REITs flying under the radar can offer better potential for growth over the long term. Due to decreased institutional support, there's a better chance that small-cap REITs will have lower valuations that result in an underestimation of a company's operational health and prospects for growth.
In this article, I’ll focus on 3 small-cap REITs that are flying under the radar:
Alpine Income Property Trust, Inc. ( PINE )
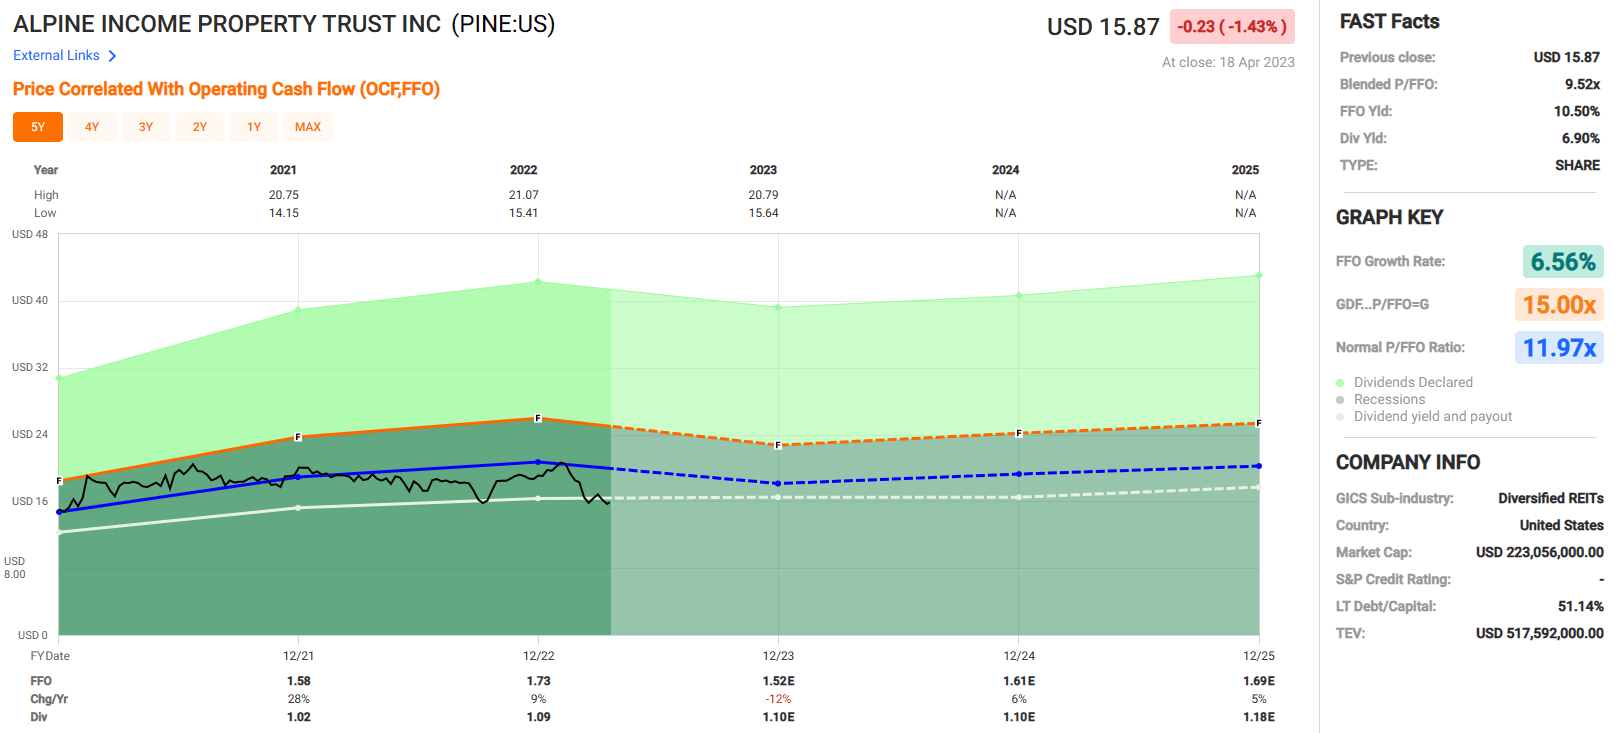
Alpine Net Lease is an externally managed real estate investment trust that has a market capitalization of $223.48 million and is relatively young, having filed its initial public offering (“IPO”) in late 2019. PINE owns and operates a portfolio of 148 properties that have an occupancy rate of 99% and are typically leased on a triple-net basis.
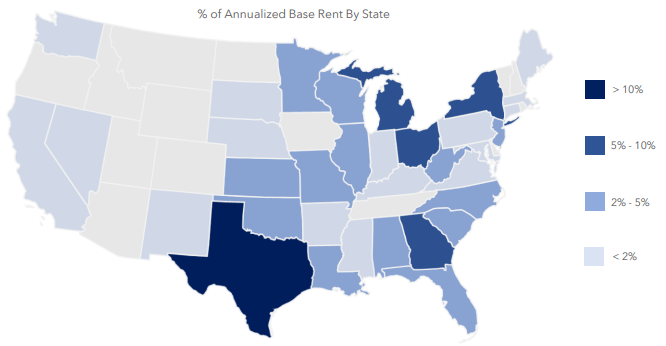
They operate in 106 markets in 34 states, and in total PINE’s properties cover 3.7 million gross rentable square feet. PINE primarily looks to acquire freestanding commercial properties that operate in the retail industry and targets tenants that are in industries that are resistant to e-commerce or that use a physical store to implement an omnichannel strategy.
Measured by their annualized base rent (“ABR”), 54% of their tenants (or their parent company) are investment grade and in total PINE’s portfolio has a weighted average lease term of 7.6 years. They are externally managed by CTO Realty Growth ( CTO ), who owns 14% of PINE. Due to the large stake in PINE, there appears to be high alignment between PINE and their external manager.
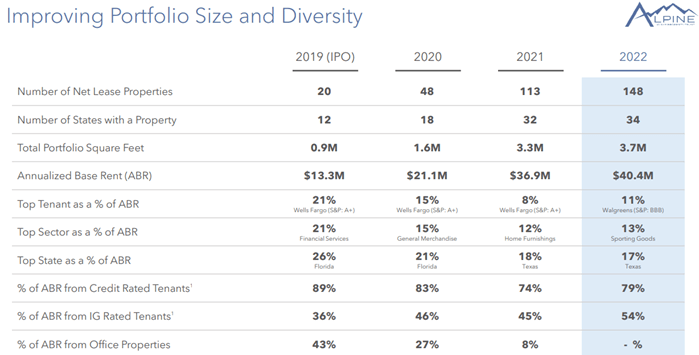
Since going public, PINE has dramatically increased the size and diversity of their portfolio. Their portfolio grew from 20 properties in 2019 to 148 properties in 2022, and their total portfolio square feet increased from 0.9 million to 3.7 million.
The states in which they operate went from 12 to 34, plus they improved their concentration by state, with their top state contributing 26% to their ABR in 2019 compared to 17% in 2022. Likewise, their exposure to their top tenant dropped from 21% of their ABR to 11%.
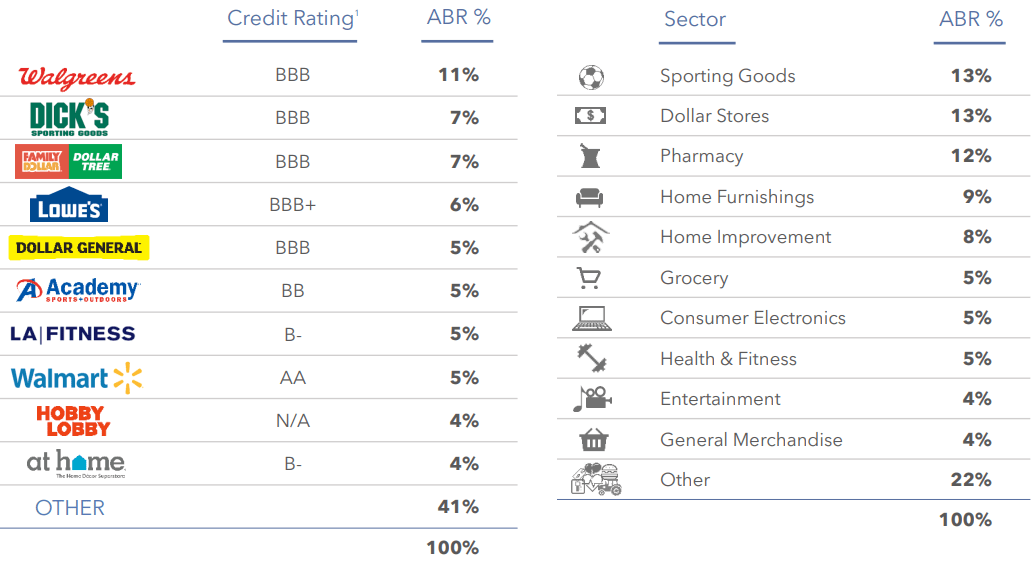
Their tenant diversity has definitely improved since their IPO in 2019, but they are still fairly concentrated, with their top 10 tenants contributing 59% of their ABR. Their largest tenant Walgreens contributes 11% to their ABR, and their next 2 largest tenants contribute 7% each.
Their top 10 tenants include 6 that have investment-grade credit ratings, and almost all the names should be familiar to most people. The high-quality names in their top 10 gives some comfort, but I would like to see them continue to broaden their overall tenant diversity.
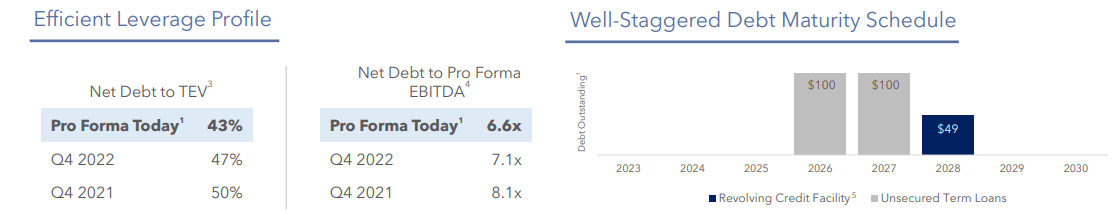
PINE’s net debt to pro forma EBITDA is a bit high, but not unreasonable at 6.6x. Similar to their portfolio size and diversity, we are seeing a positive trend in their levels of debt as it relates to their core earnings.
PINE’s net debt to EBITDA improved from 8.1x in the fourth quarter of 2021, to 7.1x in the fourth quarter of 2022, and now stands at 6.6x (as of February 2023).
PINE is in an enviable position as it relates to their debt maturity schedule. They have no debt maturities until 2026 and as of December 31, 2022, they had approximately $13.0 million in cash and $181.8 million available to them on their credit facility.
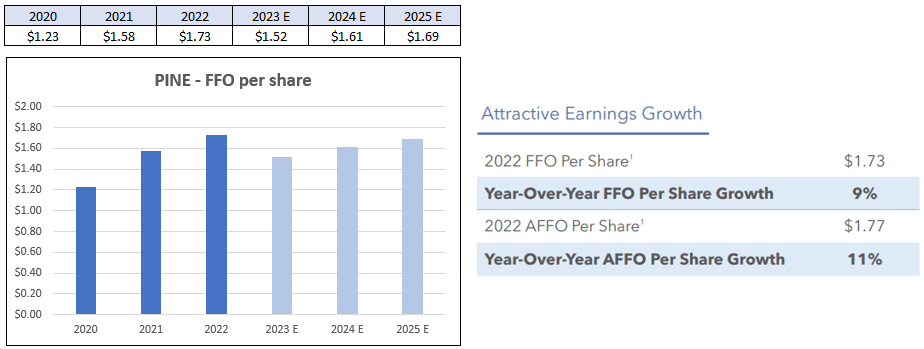
Since their first full year of operations in 2020, PINE’s funds from operations (“FFO”) has increased each year as of the end of 2022. FFO increased from $1.23 per share in 2020 to $1.58 in 2021 for a 28% increase, and then increased to $1.73 in 2022 for a 9% year-over-year increase. Analysts expect FFO to fall by 12% in 2023, but then increase by 6% in 2024 and 5% in 2025.
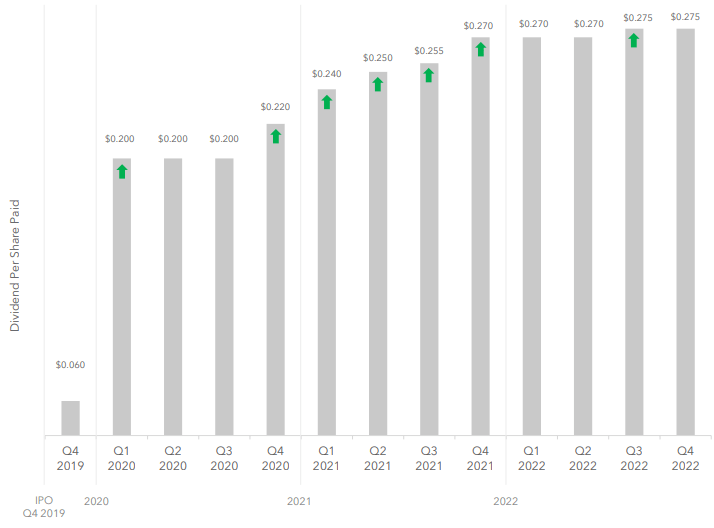
PINE has increased their dividend 7 times since their IPO in 2019. The dividend remained flat from the first quarter to the third quarter of 2020, but then was raised for the next 5 consecutive quarters. The most recent dividend increase was in the third quarter of 2022, when it was increased from $0.270 to $0.275.
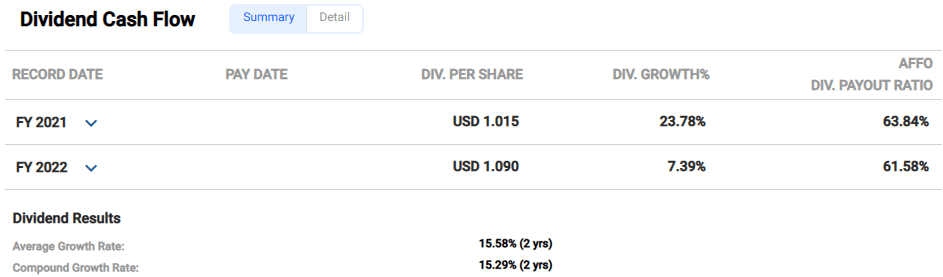
Over the past 2 years, PINE has an average dividend growth rate of 15.58% and is currently yielding 6.90%. The dividend is very well covered, with an adjusted funds from operations (“AFFO”) payout ratio of just 61.58%.
We only have a few years to go off of when reviewing PINE’s earnings and dividend record, but since going public in 2019 they have delivered strong results. I expect PINE’s dividend growth rate to normalize to levels more in line with the net lease sector as they mature, but keep in mind that they have no near-term debt maturities and they have plenty of cushion with a payout ratio of 61.58%.
PINE’s conservative debt schedule and payout ratio should give them flexibility for future dividend increases as well as additional property investments to enhance their portfolio. Currently PINE is trading at a P/FFO of 9.52x, which compares favorably to their normal P/FFO of 11.97x. At iREIT, we rate Alpine Income Property Trust a Spec BUY.
NewLake Capital Partners, Inc. ( OTCQX:NLCP )
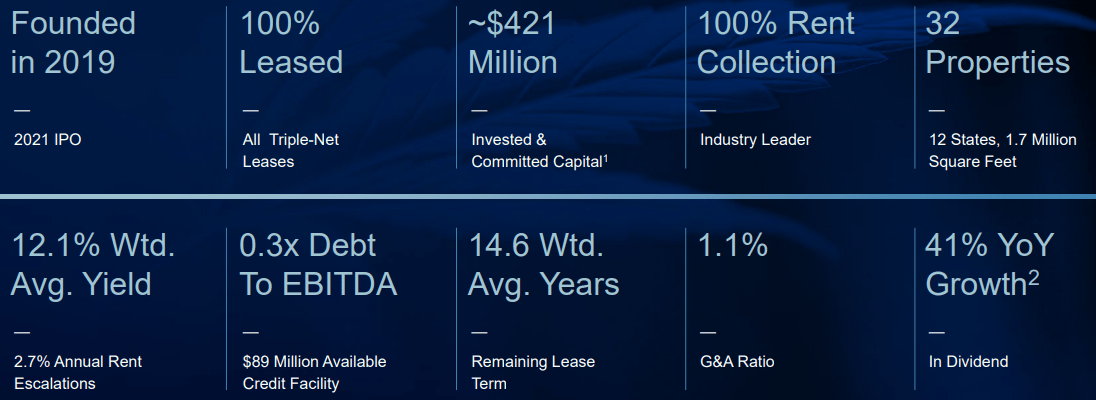
NewLake Capital is an internally managed triple-net lease REIT that specializes in real estate leased to state-licensed cannabis operators. The company was founded in 2019, went public in 2021, and has a current market capitalization of $271.89 million.
NLCP provides capital for industrial and retail properties through sale-leaseback transactions and funding issued for build-to-suit projects. Their properties are leased to single tenants on a long-term, triple-net basis primarily to companies that produce, cultivate or dispense cannabis.
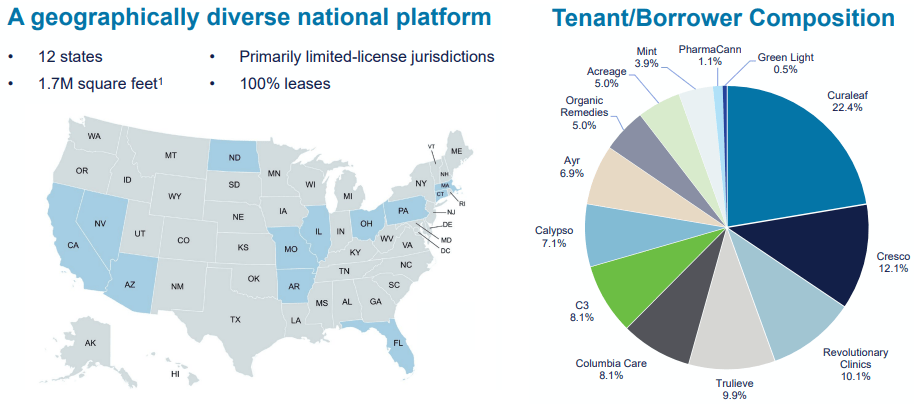
As of December 31, 2022, NLCP owned a portfolio of 32 properties (17 dispensaries / 15 cultivation facilities) with 13 tenants that are located in 12 states.
NLCP has high tenant concentration, which is unavoidable if you only have 13 tenants, but all the same there is increased risk with such high exposure to only a handful of tenants. By committed capital, most of their tenants make up 7% or more, and their largest tenant makes up 22.4%.
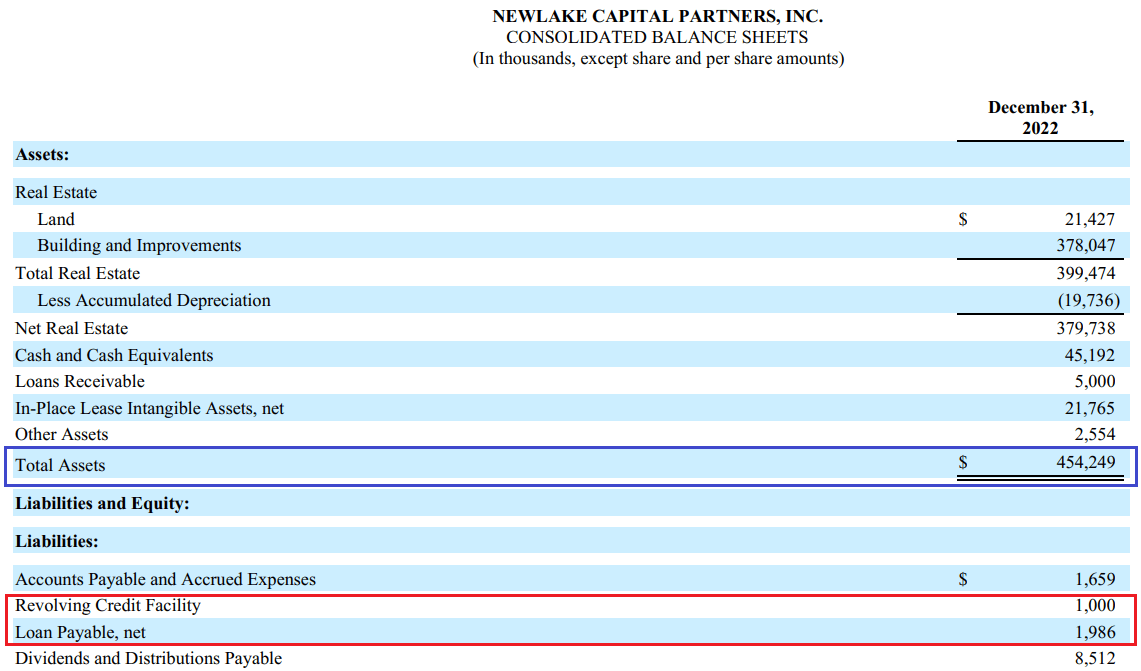
NewLake Capital has a fortress balance sheet with $379.7 million in net real estate (at cost), $454.2 million in total assets, and approximately only $3.0 million in debt. I’m not sure if there’s a REIT out there with less debt relative to their real estate or total assets.
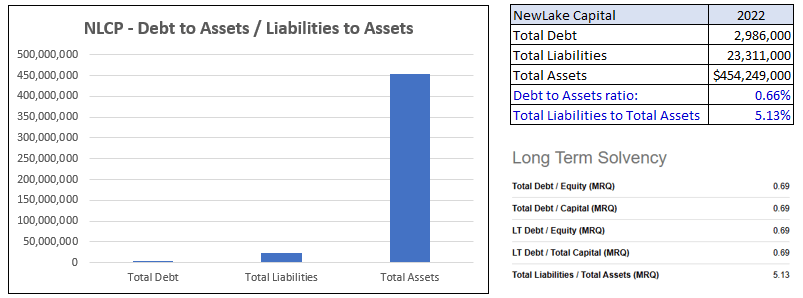
NewLake has $454.3 million in total assets, $23.3 million in total liabilities and approximately $3 million in debt for a debt to asset ratio of 0.66%, a total liability to assets ratio of 5.13% and a total debt to equity of 0.69%.
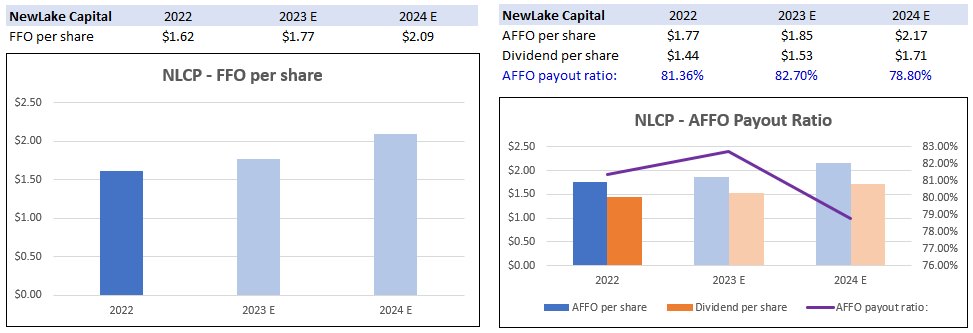
NewLake is a young company and only went public in August of 2021, so we don’t have much to work with on evaluating their earnings potential, but from the numbers we have we can see that analysts expect FFO to increase by 9% in 2023 and 18% in 2024.
This is such a small company that it doesn’t garner the attention of many analysts so take the projections with a grain of salt, but there is little doubt that there is tremendous growth potential in the cannabis industry overall, and NewLake is one of the few equity REITs in the space. Keep in mind that NLCP also trades OTC.
NLCP pays a whopping 12.46% dividend yield that is well covered, with an AFFO payout ratio of 81.36%. Analysts expect the dividend to be raised to $1.53 in 2023 and then to $1.71 in 2024 all while reducing the payout ratio from its current level of 81.36% to 78.80%. Again these are just projections but we have little else to go off of other than their projections for future growth.
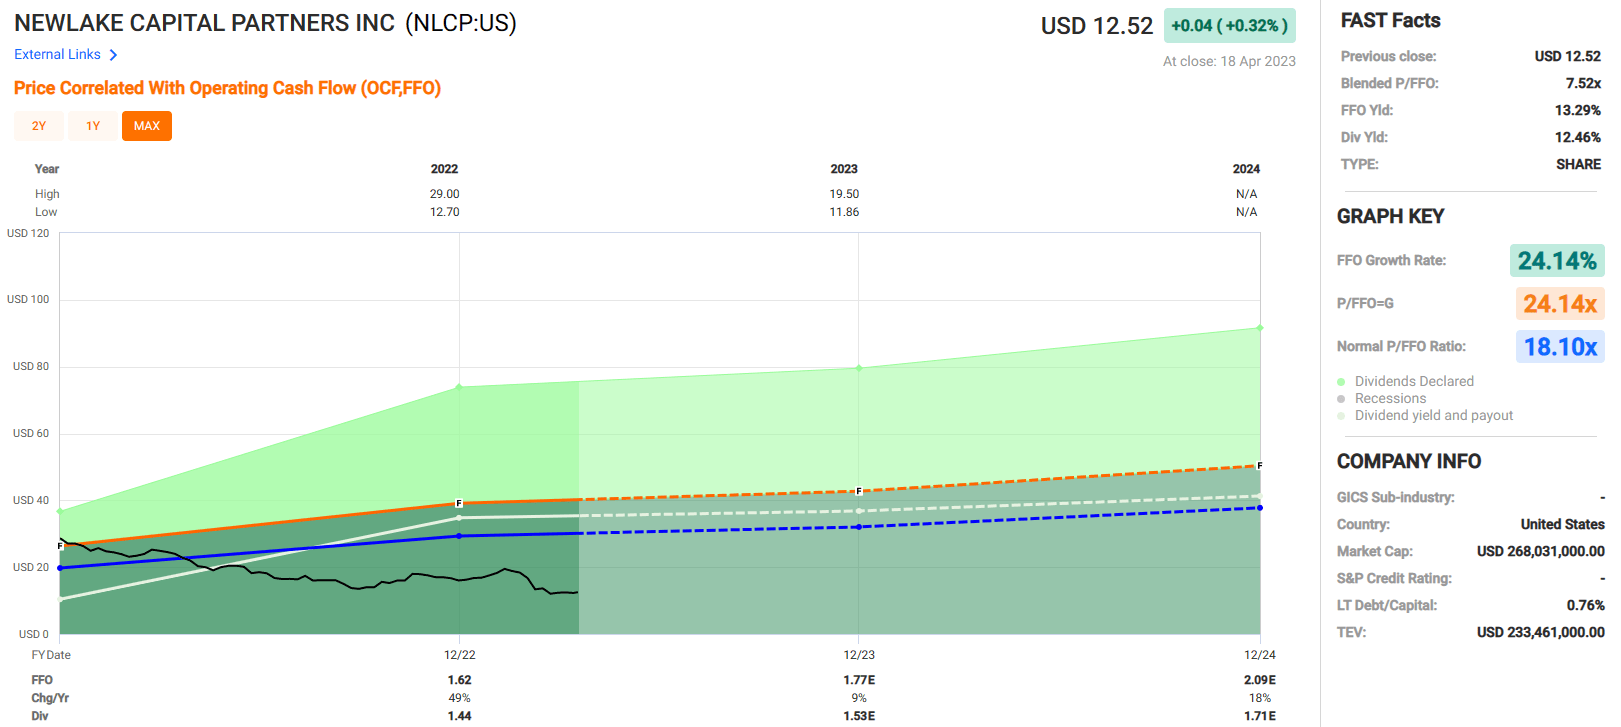
NewLake is trading at a P/FFO of 7.52x, which is a significant discount to their normal P/FFO multiple of 18.10x. Additionally, they pay a very high yield that is well covered and are in an industry with enormous growth potential.
Now don’t get me wrong, there is heightened risk here with the company and the industry itself both still being in their infancy, plus all the uncertainty surrounding future legislation, but there is also potential for an excellent return for the patient investor that can stomach a lot of volatility along the way. At iREIT, we rate NewLake Capital Partners a Spec BUY .
Global Medical REIT Inc. ( GMRE )
Global Medical is an internally managed REIT that acquires and owns healthcare facilities that are leased to physician groups and national healthcare systems. The company filed its IPO in 2016 and currently has a market capitalization of $619.98 million.
GMRE primarily invests in medical office buildings (“MOB”) and derives the majority of their revenue from that property type. In total, GMRE has 189 buildings that cover approximately 4.9 million leasable square feet and serve 269 tenants.
Most of their properties are leased to single tenants on a triple-net lease basis, but they also hold multi-tenant properties with gross lease terms. As of year end 2022, GMRE had approximately $1.5 billion gross investments in real estate and roughly $114.5 million in annualized base rent (“ABR”).
GMRE - Investor Presentation (3Q22)
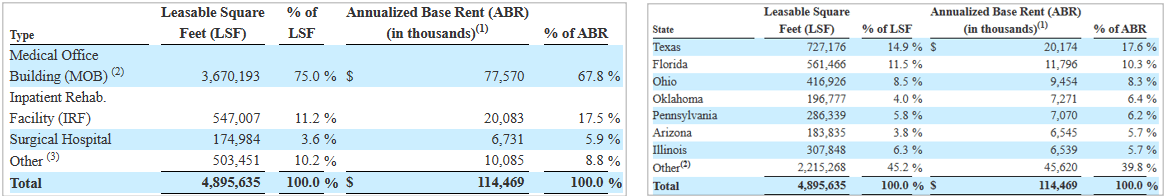
As previously mentioned, the primary source of GMRE’s rent comes from MOB properties (67.8% of ABR), but additionally they own impatient rehab facilities that makes up 17.5% of their ABR, surgical hospitals that makes up 5.9% of their ABR, and a category they label as “other” that makes up 8.8% of their ABR. The “other” category includes administrative offices, acute-care hospitals, long-term acute care hospitals, behavioral hospitals and free-standing emergency centers.
Global Medical has a large presence in Texas and Florida with each state contributing 17.6% and 10.3% of ABR respectively. Approximately 60% of GMRE’s ABR comes from the top 7 States that they list below.
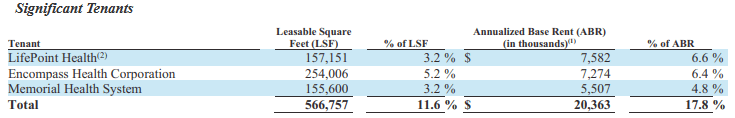
Global Medical does not list their top ten tenants, but they do include a section in their latest 10-K filing that lists their significant tenants. Out of their 269 tenants, their top 3 contribute 17.8% to GMRE’s ABR. LifePoint Health makes up 6.6%, Encompass Health makes up 6.4%, and Memorial Health makes up 4.8% of GMRE’s ABR.
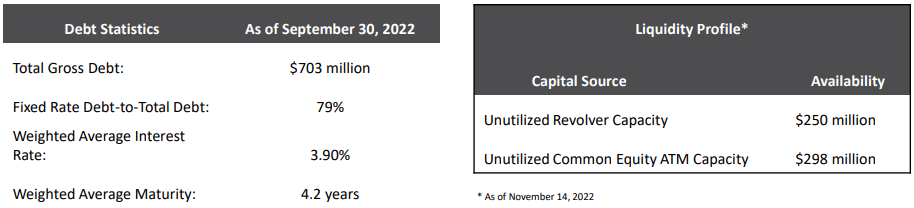
Global Medical has reasonable debt metrics with a debt to adjusted EBITDAre of approximately 6.9x and a long-term debt to capital of 52.59%. Their debt is 79% fixed rate with a weighted average interest rate of 3.90% and a weighted average to maturity of 4.2 years.
As of November 2022, GMRE had $250 million available to them under their revolving credit facility and $298 million in unutilized equity ATM (“At the Market”) capacity.
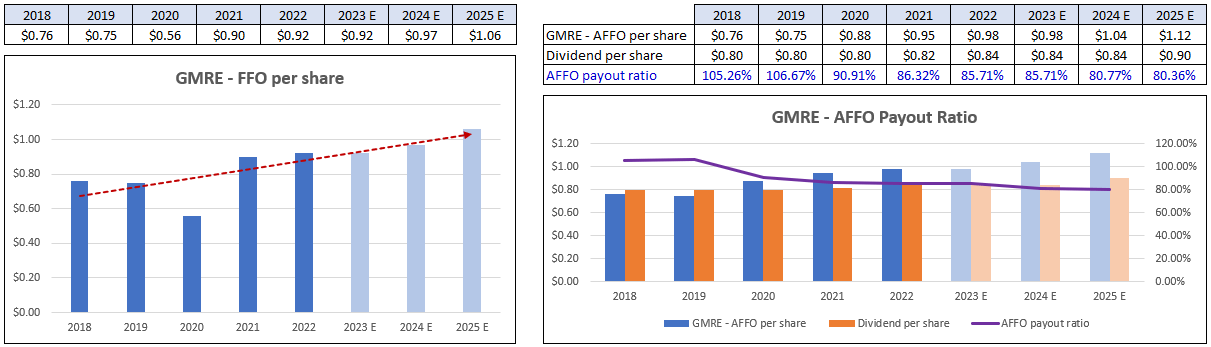
Global Medical REIT has averaged an annual FFO growth rate of 8.73% since 2018. FFO fell by 1% in 2019 and then by 25% during the pandemic in 2020, but then shot up by 61% in 2021 and increased by 2% in 2022. Analysts expect FFO to remain flat in 2023 but then to increase by 5% in 2024 and 9% in 2025.
GMRE’s dividend growth rate has been less impressive averaging less than 1% annually over the past 5 years. The dividend was not increased from 2018 to 2020 but then was increased to $0.82 in 2021 and $0.84 in 2022. Analysts expect the dividend to stay at its current rate in 2023 and 2024 and then to increase to $0.90 in 2025.
Currently GMRE pays an 8.94% dividend yield that is well covered with an AFFO payout ratio of 80.71%. While GMRE has not delivered strong dividend growth, they have done a good job of improving their payout ratio. In both 2018 and 2019 GMRE’s payout ratio was over 100%, but this metric has improved each year since 2019 and is expected to continue to improve.
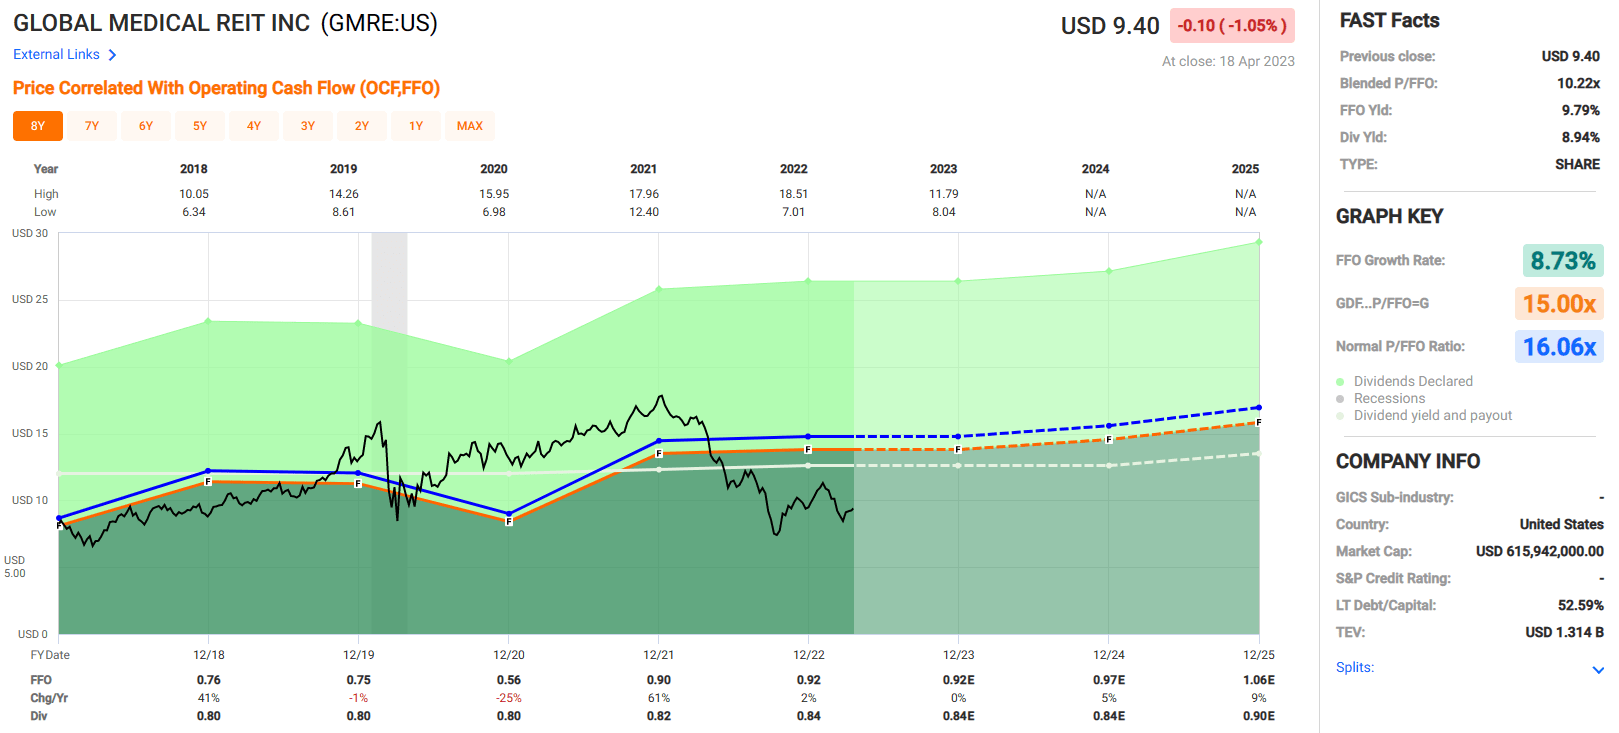
Global Medical REIT is trading at a P/FFO multiple of 10.22x which is well under their normal P/FFO multiple of 16.06x. They have historically delivered strong FFO growth and analysts expect that to resume in 2024 and 2025.
They pay a high yield that is well covered and have been steadily improving their payout ratio. At iREIT, we rate Global Medical REIT a Spec BUY.
In Closing
You won’t find any of these small cap REITs in these billion-dollar REIT ETF Indexes.
That’s okay.
Over the years I’ve found very good success with selecting REITs that fly under the radar. Our Small Cap REIT Portfolio generated over 40% annual returns from 2016-2021:
Sharesight
Of course, this success was not simply because we bought into shares of any small cap REIT. It’s because we carefully screened these companies, recognizing that they require more research and that includes meeting with management on a frequent basis.
Our members at iREIT on Alpha have asked us to bring back the Small Cap REIT portfolio, so we are announcing that we will be incorporating a new portfolio called “ Mining for Dividend Diamonds ” that will include REITs and other income gems. We’re adding a dedicated analyst to the team whose sole job is to investigate opportunities that could generate massive upside.
Each new pick will include institutional quality research and real money.
As always, thanks for reading and for the opportunity to be of service.
For further details see:
Three Small Cap REITs That Can't Be Beat