TSLA - TMFC: Beats Smart Beta ETFs But Still Lags The Benchmark
2023-11-29 16:59:08 ET
Summary
- Motley Fool 100 Index ETF is invested in 100 large companies featured in The Motley Fool’s articles and newsletters.
- The TMFC ETF is close to the Nasdaq 100 in sector breakdown, valuation, growth metrics, top holdings, and has lagged the index since inception.
- Nevertheless, its 5-year return is superior to other smart beta ETFs.
TMFC strategy
Motley Fool 100 Index ETF ( TMFC ) is a passively managed exchange-traded fund, or ETF, launched on 01/29/2018 to track the Motley Fool 100 Index. It is invested in 100 U.S. stocks and has a total expense ratio of 0.50%. As described in the prospectus by Motley Fool :
To be eligible for inclusion in the Fool 100 Index, a company must be among the 100 largest domestic firms by market capitalization in TMF’s “recommendation universe.” That recommendation universe includes all companies domiciled in the United States that are either active recommendations of a newsletter published by TMF or are among the 150 highest rated U.S. companies in TMF’s analyst opinion database.
Constituents are weighted based on market capitalization and the index is reconstituted quarterly. The index is calculated and administered by the German index engineering company Solactive AG.
In the most recent fiscal year, the portfolio turnover rate was low: 15%.
TMFC portfolio
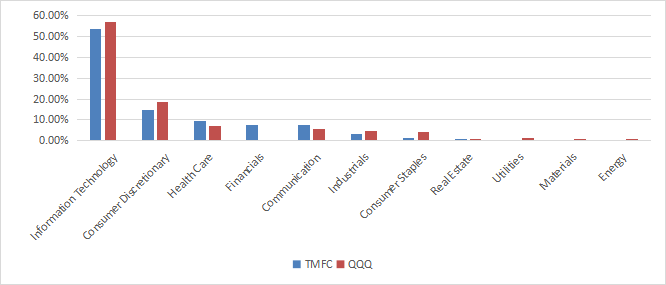
As the sector breakdown is quite close to the Nasdaq 100, it is reasonable to use Invesco QQQ Trust ETF ( QQQ ) as a benchmark. Both funds are overweight in technology, with 53.7% of asset value in this sector for TMFC and 57.1% for QQQ. Consumer discretionary and healthcare come in second and third positions for both funds. A significant difference appears in 4 th position: financials represents 7.8% of assets in TMFC, whereas this sector is absent in QQQ.
TMFC sector breakdown (chart: author; data: TMF, Invesco)
Valuation and growth metrics are very similar, as reported in the next table. The only significant difference is a better cash flow growth for TMFC.
| TMFC |
| QQQ |
| Price/Earnings |
| 26.46 |
| 27.45 |
| Price/Book |
| 5.98 |
| 6.14 |
| Price/Sales |
| 3.86 |
| 4.06 |
| Price/Cash Flow |
| 19.84 |
| 18.25 |
| Earnings growth % |
| 21.29% |
| 21.06% |
| Sales growth % |
| 13.00% |
| 13.20% |
| Cash flow growth % |
| 8.35% |
| 5.47% |
| Book value growth % |
| 8.34% |
| 9.71% |
Source: Fidelity.
The next table compares the top 10 issuers of both ETFs. They represent 61.5% of assets in TMFC and 51.9% in QQQ. For convenience, the two share series of Alphabet Inc (GOOGL, GOOG) have been grouped for the Invesco fund.
| TMFC |
| Top 10 issuers |
| Weight |
| QQQ |
| Top 10 issuers |
| Weight |
| APPLE INC |
| 13.34% |
| AAPL |
| APPLE INC |
| 11.04% |
| MICROSOFT CORP |
| 12.76% |
| MSFT |
| MICROSOFT CORP |
| 10.55% |
| ALPHABET INC |
| 7.82% |
| GOOGL,GOOG |
| ALPHABET INC |
| 6.00% |
| AMAZON COM INC |
| 6.79% |
| AMZN |
| AMAZON COM INC |
| 5.63% |
| NVIDIA CORP |
| 5.29% |
| NVDA |
| NVIDIA CORP |
| 4.38% |
| META PLATFORMS INC |
| 3.91% |
| META |
| META PLATFORMS INC |
| 3.92% |
| BERKSHIRE HATHAWAY INC |
| 3.52% |
| Broadcom Inc |
| 3.11% |
| TESLA INC |
| 3.51% |
| TSLA |
| TESLA INC |
| 2.91% |
| VISA INC |
| 2.31% |
| Adobe Inc |
| 2.26% |
| UNITEDHEALTH GROUP INC |
| 2.24% |
| Costco Wholesale Corp |
| 2.10% |
The top 6 companies are the same. The weights of the top 5 names are higher in TMFC. Both funds are overweight in tech mega caps, and TMF’s fund is even more concentrated.
Historical performance
Since inception, TMFC has lagged QQQ by about 21% in total return. The funds were on par until the market meltdown of March 2020, then TMFC started lagging.
TMFC vs. QQQ since Feb. 2018 (Seeking Alpha)
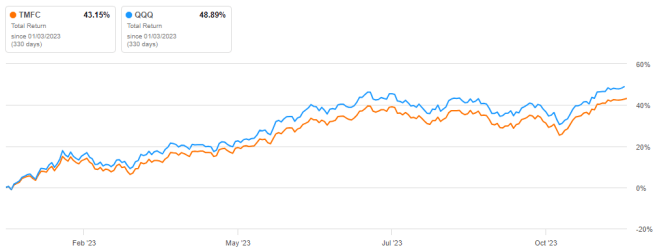
The Motley Fool’s fund is still lagging in 2023:
TMFC vs. QQQ, year-to-date (Seeking Alpha)
TMFC vs. gurus, GARP, momentum and value
Whereas TMFC invests in The Motley Fool’s picks, Global X Guru Index ETF ( GURU ) is based on the picks of large hedge fund managers (“gurus”). The next chart compares their 5-year total returns, along with ETFs standing for four factor-based investing styles:
- Momentum: Alpha Architect U.S. Quantitative Momentum ETF ( QMOM )
- Value: Alpha Architect U.S. Quantitative Value ETF ( QVAL )
- Growth: Vanguard Growth ETF ( VUG )
- Growth at a reasonable price (“GARP”): Invesco S&P 500 GARP ETF ( SPGP )
TMFC vs. competitors, 5-year total returns (Seeking Alpha)
TMFC and VUG are the best performers, in a tie ahead of the pack. They not only tie, they have followed almost the same path along these 5 years.
Takeaway
Motley Fool 100 Index ETF is invested in the 100 largest companies recommended in The Motley Fool’s articles and newsletters. It is close to the Nasdaq 100 index regarding sector breakdown, valuation, growth metrics and top holdings. Since inception, it has lagged the Nasdaq 100, but the 5-year return is superior to smart beta ETFs based on hedge fund holdings as well as momentum, value and GARP styles. It is on par with Vanguard Growth ETF, which has an expense ratio of only 0.04%. Motley Fool 100 Index ETF seems a decent growth fund, similar to VUG, but past performance and lack of originality don’t justify a 0.50% fee.
For further details see:
TMFC: Beats Smart Beta ETFs, But Still Lags The Benchmark