ELV - Tracking Ruane Cunniff & Goldfarb's Portfolio - Q1 2023 Update
2023-06-22 01:06:52 ET
Summary
- Ruane, Cunniff & Goldfarb's 13F portfolio value decreased by around 4% to $6.12B in Q1 2023, with the number of holdings dropping from 32 to 31.
- The top three positions, Intercontinental Exchange, Formula One Group, and Alphabet, account for around 30% of the portfolio, while the top five make up around 46%.
- The Sequoia Fund, which the firm is best known for, underperformed the S&P 500 Index in Q1 2023, returning 5.93% compared to the index's 7.50%.
This article is part of a series that provides an ongoing analysis of the changes made to Ruane, Cunniff & Goldfarb’s 13F portfolio on a quarterly basis. It is based on their regulatory 13F Form filed on 5/15/2023. Please visit our Tracking Ruane, Cunniff & Goldfarb’s Portfolio article for an idea on their investment philosophy and our previous update for the moves during Q4 2022.
This quarter Ruane, Cunniff & Goldfarb’s 13F portfolio value decreased ~4% from $6.40B to $6.12B. The number of holdings decreased from 32 to 31. 16 of those stakes are significantly large (more than ~0.5% of the portfolio each) and they are the focus of this article. The top three positions are at ~30% while the top five are at ~46% of the 13F assets: Intercontinental Exchange, Formula One Group, and Alphabet, UnitedHealth, and Charles Schwab.
The firm is best known as the investment advisor of the Sequoia Fund ( SEQUX ) which has a venerable ~53-year track record (July 15, 1970 inception, 12.98% annualized return compared to 10.95% for the S&P 500 index). The performance for 2022 was terrible: Negative 30.52% compared to Negative 18.11% for the S&P 500 index. For Q1 2023, they again underperformed the S&P 500 Index: 5.93% vs 7.50%. After new management took over in Q1 2016, the portfolio has seen a significant shift to information & services businesses from asset-intensive manufacturing & retail. Also, the cash allocation which had averaged ~20% since inception is now close to zero. The following significant stakes in Sequoia’s portfolio are not in the 13F report as they are not 13F securities: Constellation Software ( OTCPK:CNSWF ), Eurofins Scientific SE ( OTCPK:ERFSF ), Rolls-Royce Holdings plc ( OTCPK:RYCEY ), SAP SE ( SAP ), and Universal Music Group ( OTCPK:UMGNF ). Bill Ruane was a Benjamin Graham pupil. To learn about Benjamin Graham's teachings, check out the classics The Intelligent Investor and Security Analysis .
Stake Decreases:
Intercontinental Exchange ( ICE ): The large (top three) ~10% ICE stake was purchased in Q3 2020 at prices between ~$92 and ~$107. There was a ~90% stake increase in Q2 2022 at prices between ~$90 and ~$133. The stock currently trades at ~$111. The last three quarters have seen a ~7% trimming.
Formula One Group ( FWONA ) ( FWONK ): Sequoia’s Q4 2016 letter disclosed a new stake in Liberty Media Formula One. They participated in Liberty’s acquisition of Formula One and acquired the shares at a discounted price of $25. There was a 24% stake increase in Q2 2017 at prices between $30.50 and $37. The six quarters through Q3 2019 saw a ~18% selling at prices between $28.50 and $43 and that was followed with similar selling next quarter at prices between $40 and $46. There was a ~17% reduction this quarter at prices between ~$53 and ~$68. FWONA is currently at $69.32. The stake is now a large position at ~10% of the portfolio.
Note: their ownership stake in Formula One Group is ~4%.
Alphabet Inc. ( GOOG ) ( GOOGL ) : GOOG is now at 9.48% of the portfolio. It was first purchased in 2008 and that original stake was almost sold out the following year. In 2010, a much larger position was built in the low-teens price-range. Recent activity follows: Q2 2019 saw a one-third reduction at prices between ~$52 and ~$64. That was followed with a ~60% reduction over the six quarters through Q4 2020 at prices between ~$53 and ~$107. The last three quarters saw a ~27% reduction at prices between ~$83 and ~$144. The stock currently trades at ~$121. There was a minor ~3% trimming this quarter.
UnitedHealth ( UNH ): UNH is a large (top five) 8.52% of the portfolio stake. It was established in Q4 2019 at prices between $215 and $296 and increased by ~300% next quarter at prices between ~$195 and ~$305. Q3 2020 saw a ~30% stake increase at prices between ~$291 and ~$324. There was a ~25% selling in Q2 2022 at prices between ~$452 and ~$546. That was followed with a ~15% reduction last quarter at prices between ~$499 and ~$555. The stock currently trades at ~$477. There was a ~2% trimming this quarter.
Charles Schwab ( SCHW ): SCHW is now at ~7% of the portfolio. It was first purchased in Q2 2016 at a cost-basis of ~$29. Q1 2020 saw a ~40% stake increase at prices between $28.50 and $49. There was a ~17% selling next quarter at prices between $32.50 and $43. The stock is now at ~$54. The last several quarters saw minor trimming.
Taiwan Semi ( TSM ): The 6.69% of the portfolio TSM stake was purchased in Q4 2019 at prices between $46.50 and $59. There was a ~130% stake increase in Q2 2020 at around the same price range. Q1 2021 saw a ~12% selling while in Q3 2021 there was a ~20% stake increase. Q3 2022 saw a ~30% selling at prices between ~$69 and ~$92. The stock currently trades at ~$102. The last few quarters saw minor trimming.
Note: their investment thesis is based on the following: fabs are capital intensive (~$10B per facility) and the leader naturally has a strong moat thereby yielding big profit margins. Debatably, they produce the most important manufactured component in the modern economy. It is essentially a monopoly, and the main concern is geopolitical risks.
CarMax Inc. ( KMX ): KMX is currently at ~6% of the 13F portfolio. It was purchased in Q2 2016 at prices between $46 and $56 and increased by ~70% in Q4 2016 at prices between $48.50 and $66. Q4 2017 saw a ~30% selling at prices between $64 and $77 while next quarter there was a ~80% increase at prices between $59 and $72. The eleven quarters through Q4 2020 had seen a ~45% selling at prices between ~$44 and ~$109. The stock is now at $78.30. The last several quarters have also seen minor trimming.
Micron Technology ( MU ) and Elevance Health ( ELV ): MU is a 4.60% of the portfolio position built over the two quarters through Q3 2021 at prices between ~$74 and ~$96 and the stock currently trades well below that range at $65.80. Q3 2022 saw a one-third reduction at prices between ~$49 and ~$65. That was followed with a ~5% trimming in the last two quarters. The ~6% ELV stake was established in H1 2021 at prices between ~$288 and ~$402 and it is now at ~$445. Q2 2022 saw a ~42% reduction at prices between ~$444 and ~$530. That was followed with a ~16% selling last quarter at prices between ~$454 and ~$547. There was a minor ~2% trimming this quarter.
Credit Acceptance Corp. ( CACC ): CACC is a 5.57% stake established in Q1 2017 at prices between $185 and $221. There was a ~25% stake increase in Q4 2020 at prices between $288 and $356. Q3 2021 saw a ~18% selling at prices between ~$438 and ~$670. That was followed with a one-third reduction next quarter at prices between ~$582 and ~$696. The stock is now at ~$493. The last five quarters also saw minor trimming.
Note: They have a ~6% ownership stake in Credit Acceptance Corp.
Jacobs Solutions ( J ) previously Jacobs Engineering: J is a ~5% long-term stake first purchased in 2012. Recent activity follows: Q2 2018 saw a ~20% increase at prices between $56.50 and $67 while the next six quarters saw minor trimming. There was a ~25% selling in Q1 2020 at prices between ~$63 and ~$104. That was followed with a similar reduction in Q2 2021 at prices between ~$129 and ~$143. The stock currently trades at ~$115. The last seven quarters also saw minor trimming.
Meta Platforms ( META ): The 4.42% META position saw a whopping ~600% stake increase in Q1 2018 at prices between $152 and $193. The next two quarters saw another ~27% increase at prices between $155 and $218. Q1 2019 saw an about turn: ~23% reduction at prices between $124 and $173. Q1 2021 saw a ~13% stake increase at prices between ~$246 and ~$299. Q3 2022 also saw a ~11% stake increase. This quarter saw a ~57% selling at prices between ~$125 and ~$212. The stock currently trades at ~$282.
Capital One Financial ( COF ): COF is a 4.23% of the portfolio position established during Q3 2022 at prices between ~$91 and ~$116 and the stock currently trades at ~$108. There was a minor ~5% trimming in the last two quarters.
Liberty Broadband ( LBRDK ): LBRDK is a 4.15% of the portfolio position purchased in Q1 2018 at prices between $86 and $97 and increased by ~20% next quarter at prices between $69 and $85. Q1 2020 saw a ~18% reduction at prices between ~$91 and ~$139. There was a ~23% stake increase in Q1 2021 at prices between ~$143 and ~$157. The stock currently trades at ~$73. The last two years saw minor trimming.
Berkshire Hathaway ( BRK.A ) ( BRK.B ) : Berkshire stake is now at ~3.9% of the portfolio. It is a very long-term position that was the largest stake in their first 13F filing in 1999. Recent activity follows: Q1 2018 saw a one-third selling at prices between ~$191 and ~$217. The nine quarters through Q1 2022 had seen the large stake sold down at prices between ~$169 and ~$359. Next quarter saw another one-third selling at prices between ~$268 and ~$353. The stock is now at ~$339. The last three quarters also saw minor trimming.
Netflix, Inc. ( NFLX ): NFLX is a 3.48% of the portfolio position purchased in Q4 2020 at prices between ~$471 and ~$554. There was a ~15% stake increase in Q2 2021 at prices between ~$485 and ~$555. That was followed with a ~85% stake increase in Q1 2022 at prices between ~$331 and ~$597. Next quarter also saw another ~45% stake increase at prices between ~$166 and ~$392. Q3 2022 saw an about turn: ~40% selling at prices between ~$174 and ~$249. That was followed with another ~50% reduction last quarter at prices between ~$214 and ~$320. The stock currently trades at ~$425. There was a minor ~2% trimming this quarter.
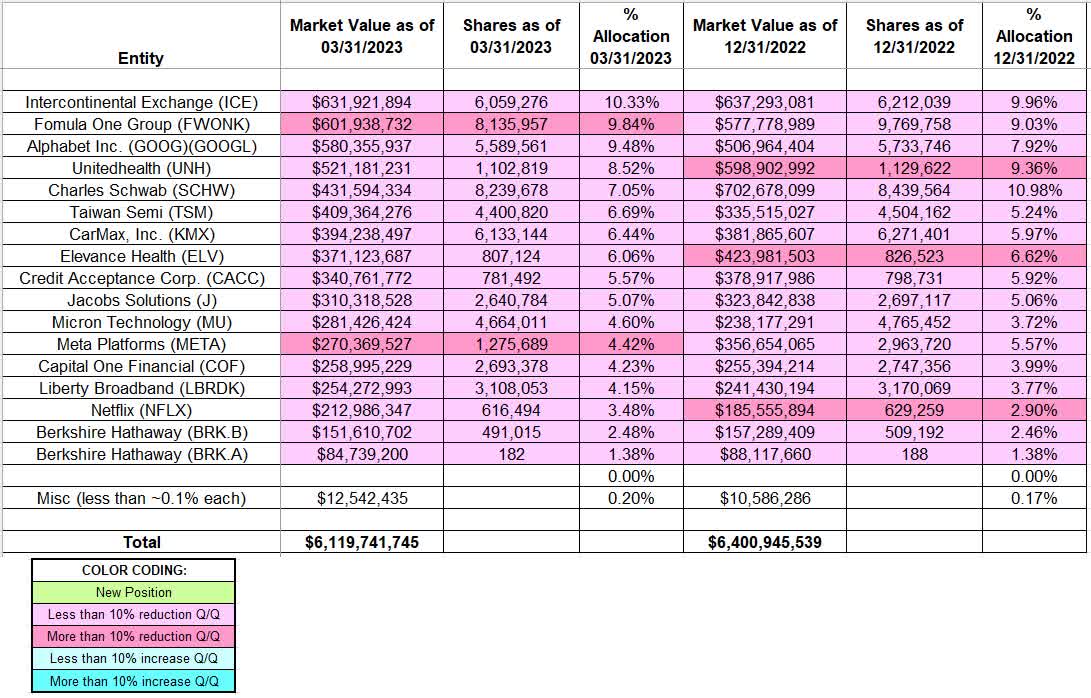
The spreadsheet below highlights changes to Ruane, Cunniff & Goldfarb’s 13F stock holdings in Q1 2023:
William J. Ruane - Ruane, Cunniff & Goldfarb - Sequoia Fund's Q1 2023 13F Report Q/Q Comparison (John Vincent (author))
Source: John Vincent. Data constructed from Ruane, Cunniff & Goldfarb's 13F filings for Q4 2022 and Q1 2023.
For further details see:
Tracking Ruane, Cunniff & Goldfarb's Portfolio - Q1 2023 Update