TRIN - Trinity Capital And STAG Industrial: 2 Ways To Boost Your Income
2023-11-14 20:28:57 ET
Summary
- REITs and BDCs are operated completely differently but can complement each other in an income investor's portfolio.
- Trinity Capital offers a high upfront yield, and their latest results showed NII increased year-over-year as higher interest rates help drive higher income generation.
- STAG Industrial is positioned for potential future appreciation as an industrial REIT with the potential for growing demand over the long term.
Written by Nick Ackerman.
Real estate investment trusts ("REITs") and business development companies ("BDCs") operate in significantly different ways. They can also help balance out one's portfolio as they can complement each other well. REITs have been getting pummeled in the rising rate environment as their cost of debt rises. On the other hand, BDCs have been generating significantly higher income due to their rising rate exposure with mostly fixed-rate financing. However, in the end, they are both yield plays for income investors.
Two names to play in the space that recently posted their latest quarterly results are Trinity Capital ( TRIN ) and STAG Industrial ( STAG ). Both names can be attractive ways to grow one's income, with rising dividends and TRIN offering a significant upfront yield currently.
Trinity Capital
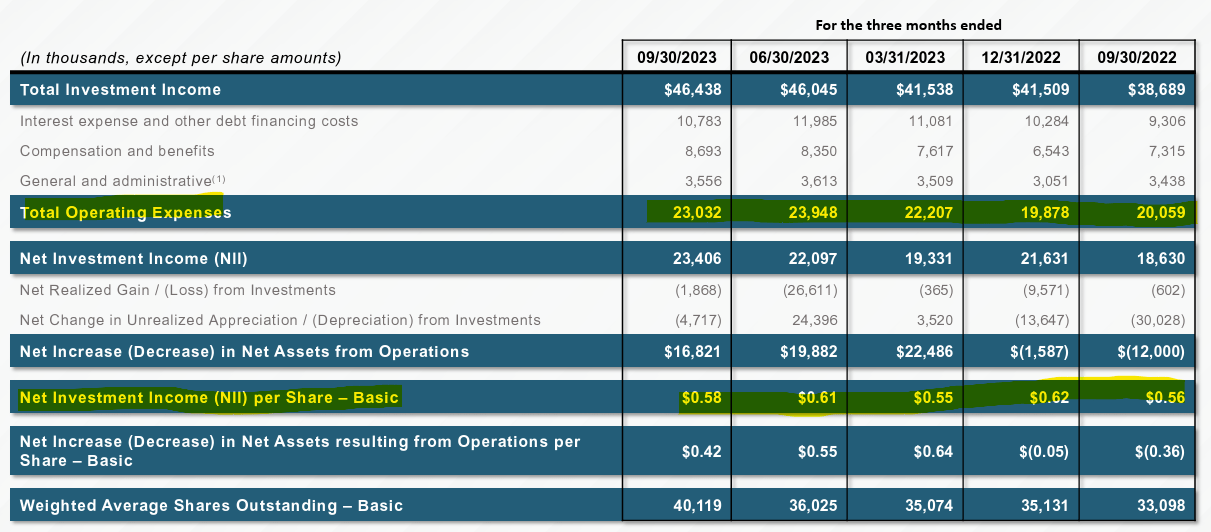
TRIN posted its Q3 results , and it was met with some excitement as shares climbed higher. The BDC saw its net investment income come in at $0.58 per share for the quarter. That was down quarter-over-quarter from the Q2 2023 $0.61 per share, but year-over-year, it climbed from the Q3 2022 NII of $0.56.
One of the things keeping pressure on earnings from growing further is that their operating expenses also continually rise. Here's a look back at the last several quarters and the trends we've been seeing on the relevant financial metrics. In particular, noting the total operating expenses and the NII per share.
TRIN Financial Metrics (Trinity Capital (highlights from author))
They've also had some issues with portfolio companies on non-accrual. Most BDCs will experience non-accruals; it is just a part of the business when lending to smaller and potentially more financially distressed entities. For TRIN, they are focused on venture companies or those that are starting to develop and can often be unprofitable.
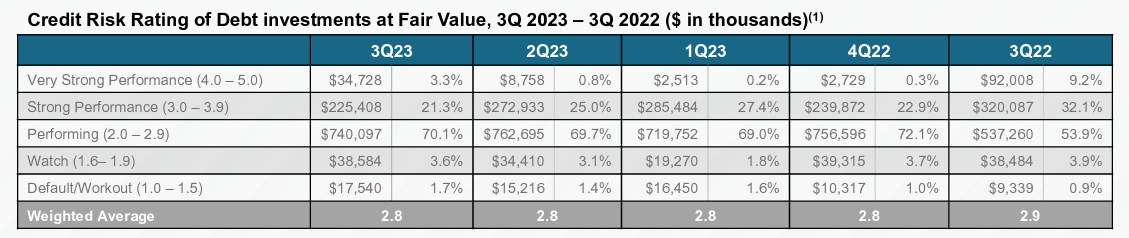
In the latest quarter, the portfolio quality stayed flat at a rating of 2.8. The watch and default/workout categories saw an increase, but this was offset by the very strong performance category. The company had two secured loans and two equipment financing loans on non-accrual. That totaled 2.6% of the company's debt portfolio. That was up from the one loan and two equipment loans from the last quarter or 2% of the investment portfolio on a fair value basis.
That's something to continually watch as the Fed is looking to slow down the economy. Conversely, that is the Fed raising rates to achieve that, which has benefited TRIN by seeing their NII rise. This is because 73.8% of their portfolio is in floating rate debt, while only 18.8% of their borrowings are based on floating rates.
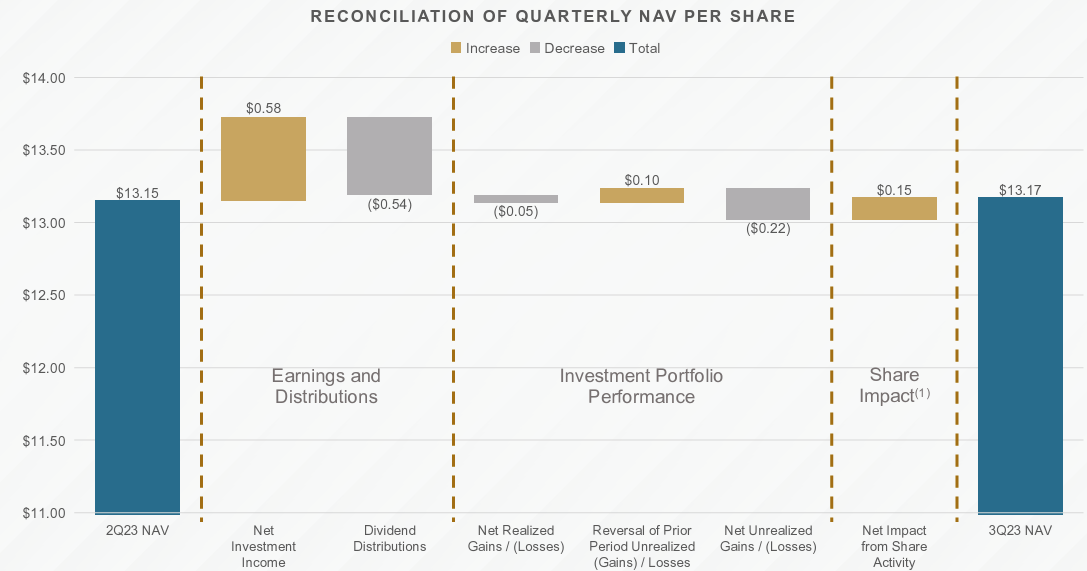
The NAV also increased in the latest quarter, which is another positive sign as this makes two quarters in a row. It wasn't a particularly large increase, and it was helped by shares being issued accretively due to TRIN's premium to NAV. That helped offset some of the unrealized losses in the portfolio - which was further offset by the "reversal of prior period unrealized losses."
It also helped that the fund outearned its dividend in terms of net investment income, which also includes the special $0.05 paid in the quarter.
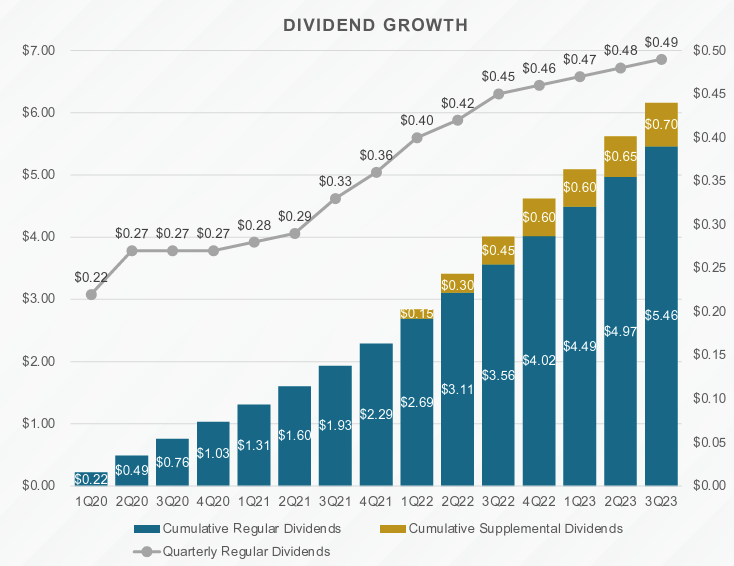
Given the strong dividend coverage, they could continue along with another increase in the next quarter. Based on the regular dividend, the current yield comes in at a very tempting 13.85%.
However, this is one area that I do continue to worry about a little bit in terms of how long the trend should continue.
This is because most are expecting things to slow down next year. If the economy does turn sour and the Fed has to trim rates, that could put pressure on TRIN's dividend coverage as NII could go lower if they aren't able to offset this through lower expenses. Additionally, that would likely see non-accruals also increase. In my opinion, we are probably getting close to a place where just holding the dividend steady wouldn't be the worst idea. They always have the flexibility to utilize supplemental and special dividends if needed.
This is also something I had mentioned earlier in the year as well, after their Q1 results. Growing the dividend is important, but if they are put in a situation where they are in a worst-case scenario and have to cut, the BDC would likely be punished. For now, it enjoys trading at a premium to its NAV. As an internally managed BDC, this isn't all that uncommon either.
STAG Industrial
STAG is in a different situation, where they aren't sporting nearly as high of a yield as TRIN with its ~4.4% dividend yield but is more positioned for potential future appreciation. TRIN, the hope is they can just maintain their NAV steady and continue to pay out the monster yield. In this case, we should see a decent yield with growth potential for the share price in the future.
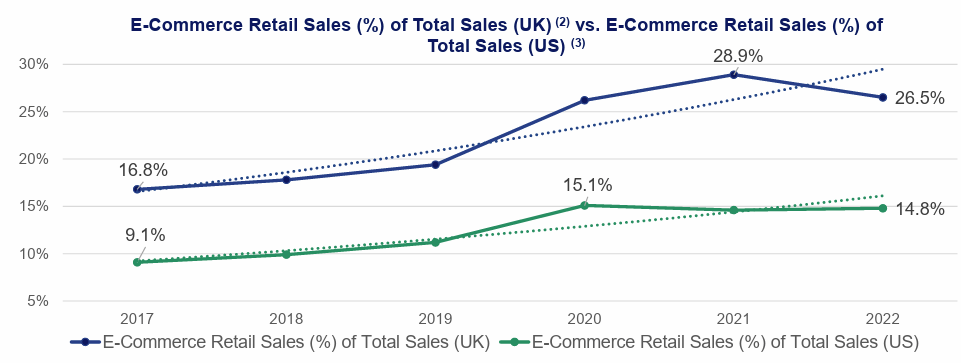
This is because they are an industrial REIT, and we live in an ever-increasing world of online retail sales with more facilities needed to transport those things.
Covid saw that get a significant pop, which it has moderated back out, but the trend is still pretty clear that we are on a trajectory of rising e-commerce sales as a portion of retail sales. They noted that 31% of STAG's portfolio handles e-commerce activity.
Besides e-commerce sales, they note that "re-shoring" and "near-shoring" could drive demand as well. This is because as manufacturing comes back to friendlier and domestic shores, new warehouse demand could end up opening up. They state that "approximately 30% of STAG's portfolio is located within a 60-mile radius of Megasite Projects."
Their latest Q3 results saw FFO per share come in at $0.59, an increase of 3.5% from last year's $0.57. For the last nine months, it was also an increase from $1.66 to $1.71 or a 3% increase.
On an absolute basis, they saw their cash available for distribution climb from $87.016 million to $96.843 million, good for an 11.3% increase. On a per-share basis, it came in at $0.5356 from $0.486 or a 10.2% increase. The difference here is the issuance of more shares.
For the nine months, on an absolute basis, CAFD rose to $274.110 million from $256.623 million or 6.8%. On a per-share basis, it was $1.5244 compared to $1.4365, resulting in an increase of 6.12%. Once again, a higher share count was driving the difference.
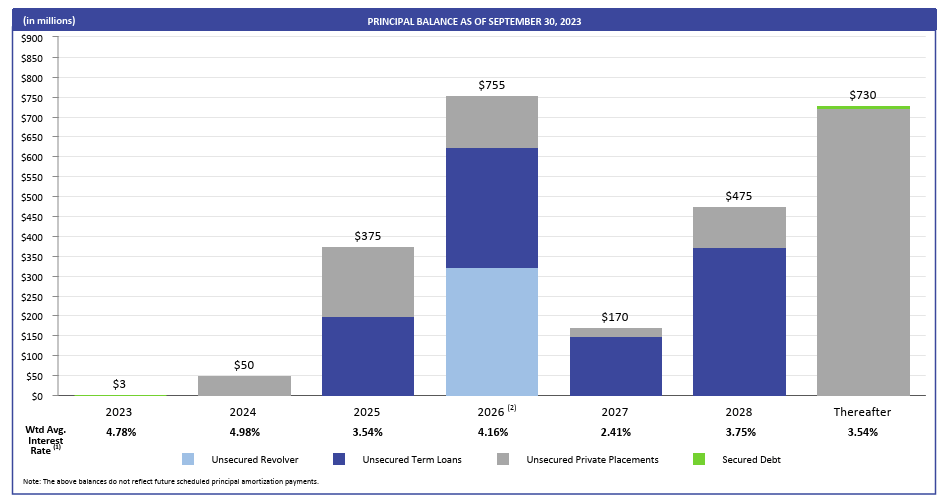
Of course, this is the common way for REITs to grow, issue shares, and/or issue debt. On that note, their net debt to adjusted EBITDA is coming in at 4.9x, which is on the low end of their guidance range . That's down from 5.2x in 2022. They have most of their borrowings at fixed rates with no problems with near-term debt maturing .
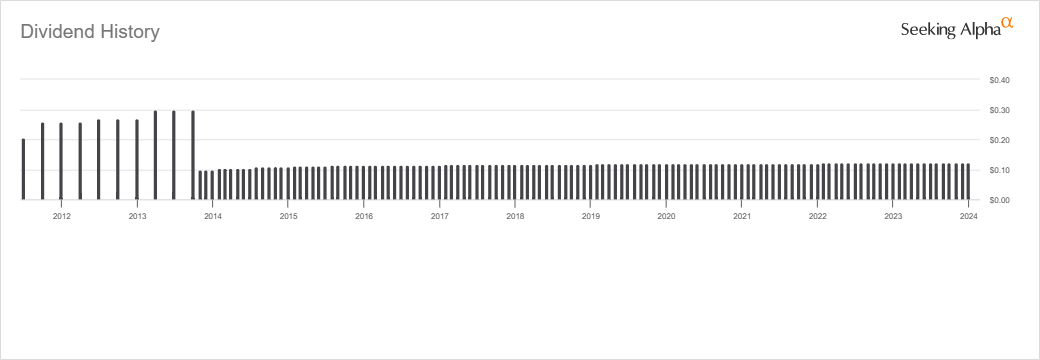
All this being said, this is great news, as last quarter showed that CAFD had essentially stayed flat. FFO and CAFD are important, of course, because they help determine what sort of capacity STAG could have for growing its dividend. The biggest gripe against STAG is the slow pace of the growth in the dividend.
The other side of this argument against increasing the dividend is more flexibility. Management will want to have the flexibility to potentially pay the debt off instead of financing at higher rates or using the free cash flow for growth. Having FCF allows them to have that type of flexibility, which they put at around $85 million annually.
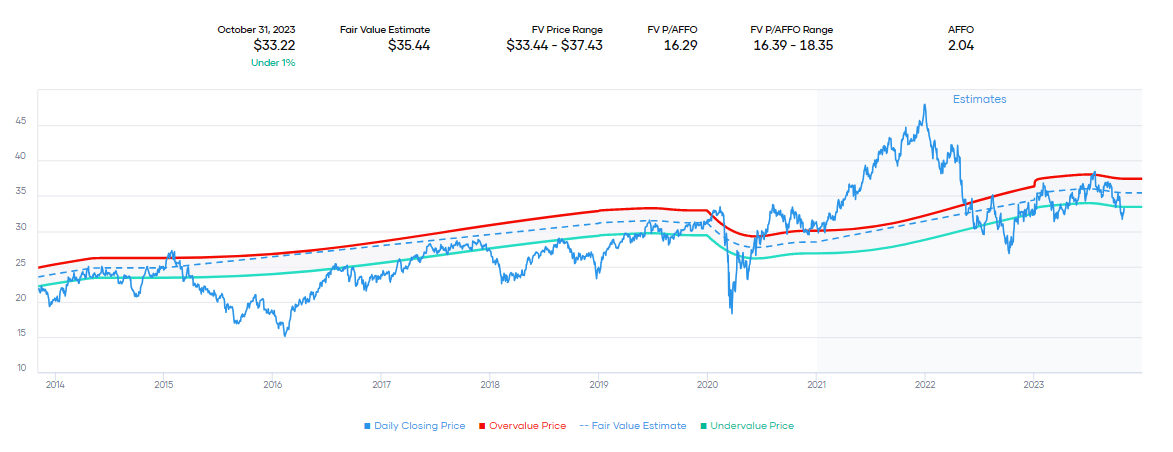
At this time, STAG represents an attractive time to consider entering a position. On a historical P/AFFO basis, it is trading below its fair value range. Even with the higher rate environment, STAG is in a position where they don't have to worry about refinancing significant amounts of their debt for the next few years.
Conclusion
REITs and BDCs can be strong complements when paired with each other, as higher rates helped boost BDC income, but conversely, higher rates have kept REITs under pressure. The reverse is likely to be true when rates come down; REITs could rise as BDCs would likely see their income generation decline.
TRIN offers a monster yield for income investors upfront with a rising dividend. Personally, I'd like to see buying below the NAV, and that could include selling puts if shares turn lower. For STAG, we don't get as large of a yield today, but for the long-term, investors could see capital appreciation as well as the yield.
For further details see:
Trinity Capital And STAG Industrial: 2 Ways To Boost Your Income