SPGI - Turning Debt Into Gold: Why S&P Global Fits In My Portfolio
2023-12-24 04:41:53 ET
Summary
- After learning from Buffett how to invest in railroads, I went over his investment in credit rating agencies.
- In this article I delve into S&P Global's diverse operations, elucidating why I recently bought it.
- The current stock price forces us to assess the company's robust financial performance, recurring revenues, and future growth prospects with proper multiples.
Introduction
It is funny that, although I spend at least a few hours every day reading annual and quarterly reports in search of new investment opportunities that fit my portfolio, some of the most interesting investing ideas don't come from this method. In this article, I want to share the path that led me to research S&P Global ( SPGI ) up to the point, that during the October sell-off, I started buying some shares at around $360 to initiate a position.
The path leading me to S&P Global
The company is widely known. Yet, it strikes me how it seems to go under the radar. On Seeking Alpha, for example, where many sophisticated investors spend time, it only has 35k followers. To get an idea, if we look at other companies with comparable market caps around $100 billion, we find Airbnb ( ABNB ) with 101k followers and Deere ( DE ) with 97k followers.
Sometimes, the most obvious investments are right there before us and we still have trouble realizing this. After I found out about S&P Global, I wonder how many similar opportunities are still there before my eyes without me having yet seen them. In any case, I got to S&P Global because of two things.
The first one is linked to debt and, of course, debt ratings. In fact, this year I noticed how many companies in their earnings tried to point out that they didn't carry a lot of debt with 2024 as the maturity year. Most companies tried to show how their debt was mainly due from 2025 onwards. Of course, it is clear why companies pointed out this. In a high-rate environment, companies want to reassure investors that they will keep paying low-interest rates. But, as 2024 seems a year with low debt rollover, I could not help but notice that 2025 should be a big year. This made me think 2025 should be a year with a lot of new ratings. This means work for S&P Global, Moody's ( MCO ) and Fitch. So, I went to S&P Global's website and found in its most recent Investor Factbook a clearer view of what I had been noticing about debt maturities.
S&P Global Investor Factbook
This graph shows how almost $2 trillion in investment-grade corporate debt will mature in 2024 and another $1.9 trillion is due in 2025. These numbers impressed me because they show what kind of future revenues S&P Global's Ratings business has in the pipeline.
After this, I started thinking about Warren Buffett's investment in Moody's, which started after Moody spun off of Dun & Bradstreet . He held 24 million shares in late 2000 for $499 million for a total ownership of 15% of the company. In 2005 , he reported 48 million shares or 16.2% of the company. The share count doubled as a result of a stock split. By the end of 2008 , as a result of buybacks, Berkshire held a 20% stake in the company. In 2009, Berkshire sold some Moody's shares to raise cash for other purchases, such as the BNSF one, which I covered thoroughly. If we look at Moody's sale alone, it seems a big mistake of Buffett's because he sold a big chunk of his stake at a low and missed out on big gains. But considering the purpose which he was raising cash for, I believe he did take advantage of a good opportunity which sort of balances out the missed opportunity. In 2012, we see Berkshire reporting a 12.7% stake in Moody's, with 28.4 million shares for $287 million against a market value of $1.43 billion. In 2013 , the stake was further trimmed to 24.7 million shares, or a stake of 11.5% of the company. Since then, Berkshire has not done anything to its stake, if not letting it compound while becoming more and more significant ownership of the company as a result of Moody's share repurchases. In Berkshire Hathaway's annual reports and Warren Buffett's shareholder letters, we don't find anything in particular written about this investment.
We find a little more detail when we read the transcripts of Berkshire's annual meetings. In 2000 , Buffett was asked how deep the moat around Moody's was and this is how he answered:
I would say that the moat is, just in our view, far wider, deeper, and infested with far more poisonous characters, in the case of Moody’s, than in the case of the operating company. We’ve had experience — just in terms of making decisions about how you either obtain credit information, in the case of the operating company, or if you want to obtain ratings on securities or something — I think you’d conclude that Moody’s is a much stronger franchise than the operating company.
And Charlie Munger added: "Moody’s is a little like Harvard. It’s a self-fulfilling prophecy. You know, I hate to think of how much you could mismanage Harvard now and still have it work out pretty well".
In 2010, when Buffett was asked if he had sold part of his stake in Moody's because the investment case had changed, he replied:
I would say this. The ratings agencies have had, and still have, under current conditions, an incredibly wonderful business. I mean, it takes no capital at all, you know, the pricing power is significant. And certain parts of the world feel they need rating agencies. [...] It’s not a business that we rely on, but we do recognize that if the, sort of, the social model doesn’t change, it still remains a phenomenal business
Not much more can be found and this makes sense because Mr. Buffett shows himself to be a bit reluctant when he has to go into details about marketable securities.
In any case, the two ideas are clear: our social model is such that pretty much every business has to pay its toll to Moody's; as a result, Moody's pricing power is immense.
After I understood these things, I started studying the two main rating agencies. I will soon publish an article on Moody's, as well. But let's go back to S&P Global, which caught my attention over Moody for one simple reason: its indices.
The surprise was right there behind the corner: S&P Global is much more than the owner of the S&P500. And, to say it all, its indices business is only its fourth business, revenue-wise.
The company
"Powering Global Markets", these three words represent what S&P Global does.
As it is explained in every annual report , S&P Global is a "provider of credit ratings, benchmarks, analytics and workflow solutions in the global capital, commodity, automotive and engineering markets".
In its last annual report, S&P Global split its operations into six segments:
- S&P Global Market Intelligence, which is the provider of financial data and analytics, such as all the data taken from the financial statements of a company or ESG scores, among others.
- S&P Global Ratings, probably the most famous branch. It is the provider of independent credit ratings.
- S&P Global Commodity Insights, providing information and benchmark prices for the commodity and energy markets.
- S&P Global Mobility might be lesser known, but it is equally interesting. It is a provider of useful data for the full automotive value chain, be they manufacturers, suppliers, dealers, retailers, consumers, or even insurance companies. What a way to profit from a traditionally low-margin industry!
- S&P Dow Jones Indices is probably the most famous alongside Ratings. It is the global index provider offering index benchmarks that we use all the time.
- S&P Global Engineering Solutions is a provider of engineering standards and related technical knowledge.
However, On January 14, 2023, S&P Global entered into an agreement with Allium Buyer to sell its Engineering Solutions business for $975 million in cash. As a result, it now reports its operations under the first five segments.
A year before, on February 28, 2022, S&P Global completed the merger with IHS Markit in an all-stock deal worth $44 billion. This is the reason why we see a big 35% surge in revenue from 2021 to 2022. The acquisition changed the company's capital position, seeing its cash balance go down from $6.5 billion at the end of 2021 to just $1.29 billion at the end of 2022. At the same time, LT debt moved up from $4.11 billion at the end of 2021 to $10.96 billion at the end of 2022. As a result, the company's gross debt/adj. EBITDA ratio went up from 1.8x to 2.7x. The company said it is committed to bringing down this ratio in the range between 2 and 2.5.
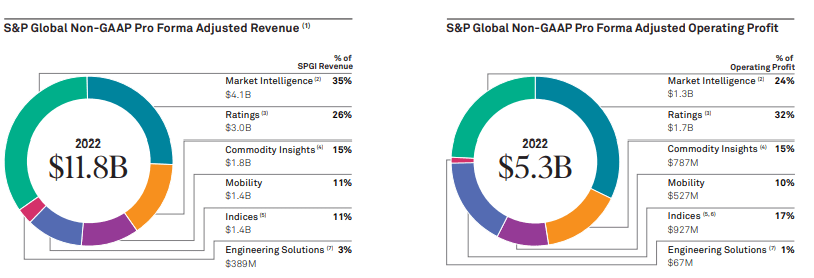
Let's take a look at the operating results by division at the end of FY2022. I found them breathtaking.
The company made almost $12 billion in revenue, 35% ($4.1 billion) of which came from Market Intelligence, 26% ($3 billion) from Ratings, 15% ($1.8 billion) from Commodity Insights, 11% ($1.4 billion) from Mobility, 11% ($1.4 billion) from Indices and the remaining 3% ($389 million) from Engineering Solutions. If we look at the operating profit, however, we see how Ratings alone makes up 32% of the pie, with Market Intelligence in second place contributing 24% of the overall profit. Indices also, while contributing only 11% to the top line, make up 17% of the company's operating profit. Clearly, Ratings and Indices are very high-margin divisions.
But here we have something adding a lot of flavor to our understanding of S&P Global's top line: 82% of its revenue is recurring, as shown below (subscription, non-transaction, and asset-linked fees).
S&P Global Investor Factbook
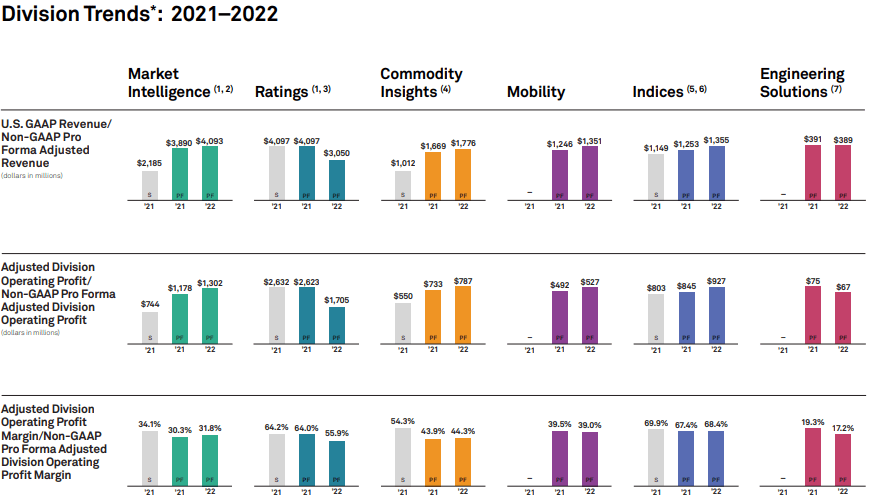
We can see the company's operations reported by divisions below, where we see each division's top line together with its operating profit and its operating profit margin.
Well, take a look at these margins: apart from Engineering Solutions, which is not part of the company anymore, there is no division with operating margins below 31%. In particular, as we can understand from the first image, Ratings has an operating profit margin between 55% and 65%, while Indices is stable above 67%.
Personally, I had no idea S&P Global had such high margins. But, thinking about it, this makes sense. The company sells services and data and it is part of an oligopoly. Therefore it doesn't have high capex, nor does it face stiff competition creating pricing pressure.
S&P Global is well aware of the quality of its revenue streams, and this is why it breaks it down by segment, to show investors how each division is supported by subscriptions or other forms of recurring revenues. Market Intelligence had about 95% of its revenues coming from recurring forms. Commodity Insights is at 96%; Mobility is at 78%.
Ratings and Indices are a bit different. Ratings actually have about 41% of their revenue as transaction revenue, which means it is non-recurring. However, 59% is non-transaction revenue which comes, as the company explains, from "surveillance of a credit rating, annual fees for customer relationship-based pricing programs, fees for entity credit ratings, and global research and analytics".
Indices have three types of revenue: asset-linked fee revenue, which comes from licensing fees on assets invested in products linked to S&P Dow Jones Indices; sales usage-based royalties revenue, based on trading volumes of derivatives contracts listed on different markets; subscription revenue which comes from "customized index solutions and data subscriptions that support index fund management, portfolio analytics and research". Here, 64% of the division's revenue comes from fees, another 16% from royalties, and the remaining 20% from subscriptions. No matter how we look at it, S&P Global types of revenues show very resilient characteristics.
If we add the consideration that S&P Global is a high-margin and capital-light business, we have no reason to doubt it can generate growing free cash flows year after year, as, in fact, it does. Take a look at the graph below: in just 5 years, it went from $2 billion in FCF to almost $4 billion.
S&P Global Investor Factbook
Moreover, the company is committed to responsible stewardship of capital, keeping its balance sheet very robust, being very disciplined when considering acquisitions, and returning most of its excess capital to its shareholders. Taking a look at how much cash S&P Global has returned to its shareholders, we see how in 2018 it paid $503 million in dividends and spent $1.66 billion in share repurchases. Fast forward to 2022 and we see a company that has paid over $1 billion in dividends while spending $12 billion in share repurchases.
S&P Global Investor Factbook
Recent Financials
While we wait for the fiscal year to end so that we can read in a few weeks the FY 2023 Annual Report of the company, we can look at where S&P Global is at after Q3 2023 .
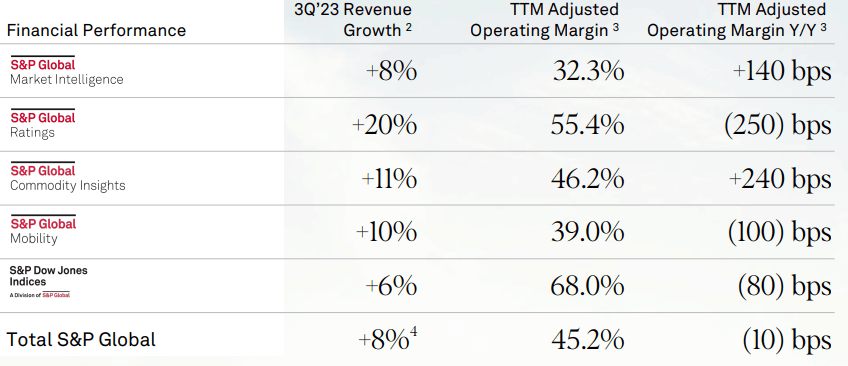
Taking a quick look at the financial performance by segment, we see a mixed picture. On one side, every segment grew its revenue at a good pace, with Ratings up 20% YoY. However, three out of five segments saw TTM operating margin contraction, with Ratings down 250 bps YoY. We are still before a 55.4% operating margin, which is a dream for most companies around the world. But with high-quality companies, investors can become rather picky for a margin contraction of a few bps. The reason is simple: oftentimes these companies are priced for perfection.
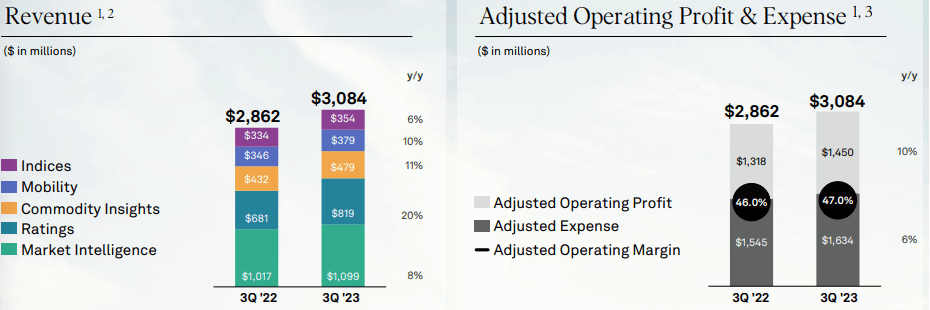
If we look at the numbers achieved by each segment, we see how the company overall made a little bit over $3 billion in revenue, a third of which came from Market Intelligence, and another 26.5% coming from Ratings. Indices made up around 11.5% of the quarterly revenue.
Now, we could dig deeper into every single division, but the article would become too long. In my next articles on the company, I will focus every time on one or two single divisions to give a full coverage of every possible detail.
This time, I will just focus on the two divisions that first caught my attention: Ratings and Indices.
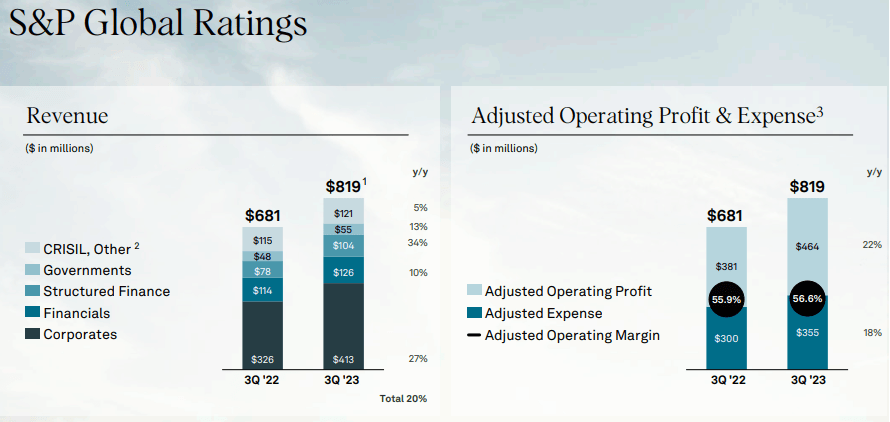
Ratings, as we can see below, did $819 million in revenue. If we look at the revenue mix, we see how $413 million (50.4%) came from corporate ratings. Now, while we saw the TTM margins were down, we see here how the quarterly operating margin actually improved by 70 bps, meaning S&P Global is already in recovery mode, if so it may be called.
As S&P Global's CEO said during the last earnings call :
global billed issuance saw a very strong third quarter with 21% growth year-over-year. With credit spreads tightening through the third quarter, issuers were more comfortable coming to the market, though refinancing activity continues to drive the majority of issuance.
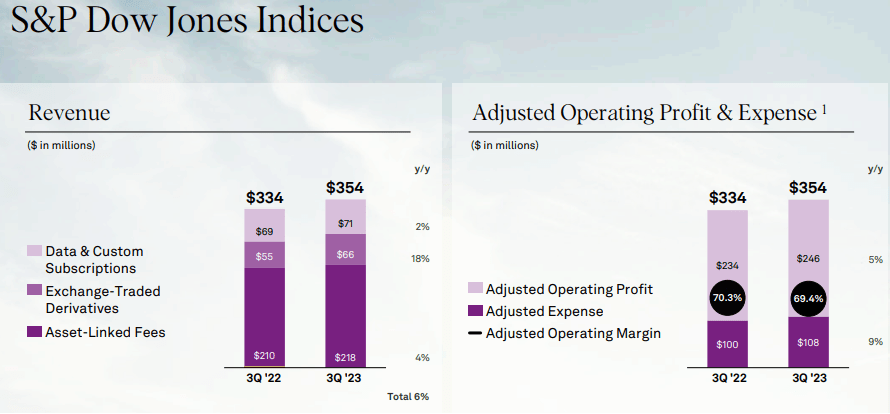
Looking at Indices, we see strong performance, with $354 million in revenue and an adj. operating profit slightly below 70%. As passive funds keep on attracting more and more capital from actively managed funds, S&P Global Indices is set to benefit more and more.
In particular, as the company's CFO Ewout Steenbergen pointed out during the last Goldman Sachs Financial Services Conference, there's still a lot of money parked on the sidelines ready to be deployed as market conditions and interest rates normalize. This means that many billions will be invested in funds, providing even more fees for S&P Global:
The first is, that there's still lots of excess savings from households that have been built up during the pandemic that will come down. There's about still $340 billion of excess savings there. Most likely households will run out of debt somewhere in the spring of next year. So that's of course stimulus in terms of consumer spending that is going away.
Given the strong results, the company felt comfortable raising its FY guidance. Its revenue growth outlook remained the same as in the previous outlook: 10%-12%. But moving towards the bottom line, we see how S&P Global feels confident about its profitability, raising up by 0.5 percentage points, its operating profit margin outlook. The same happened for diluted EPS, where the company increased its outlook.
S&P Global Q3 2023 Earnings Presentation
Considering the company is also conducting a share repurchase program worth $1.3 billion, I am quite sure we will see EPS beats quite often in the next few quarters.
Valuation
Needless to say, S&P doesn't trade at a discount and its valuation grade on SA is an F, with a 34.5 fwd PE, a 27.8 EV/EBITDA, and a 35 P/FCF.
As we have come to understand, the business is rock solid and well-protected. Therefore it is highly profitable and it does deserve a premium. But during a time when the market is in bull mode and prices are once again, I feel I need to be very prudent and cautious about my picks.
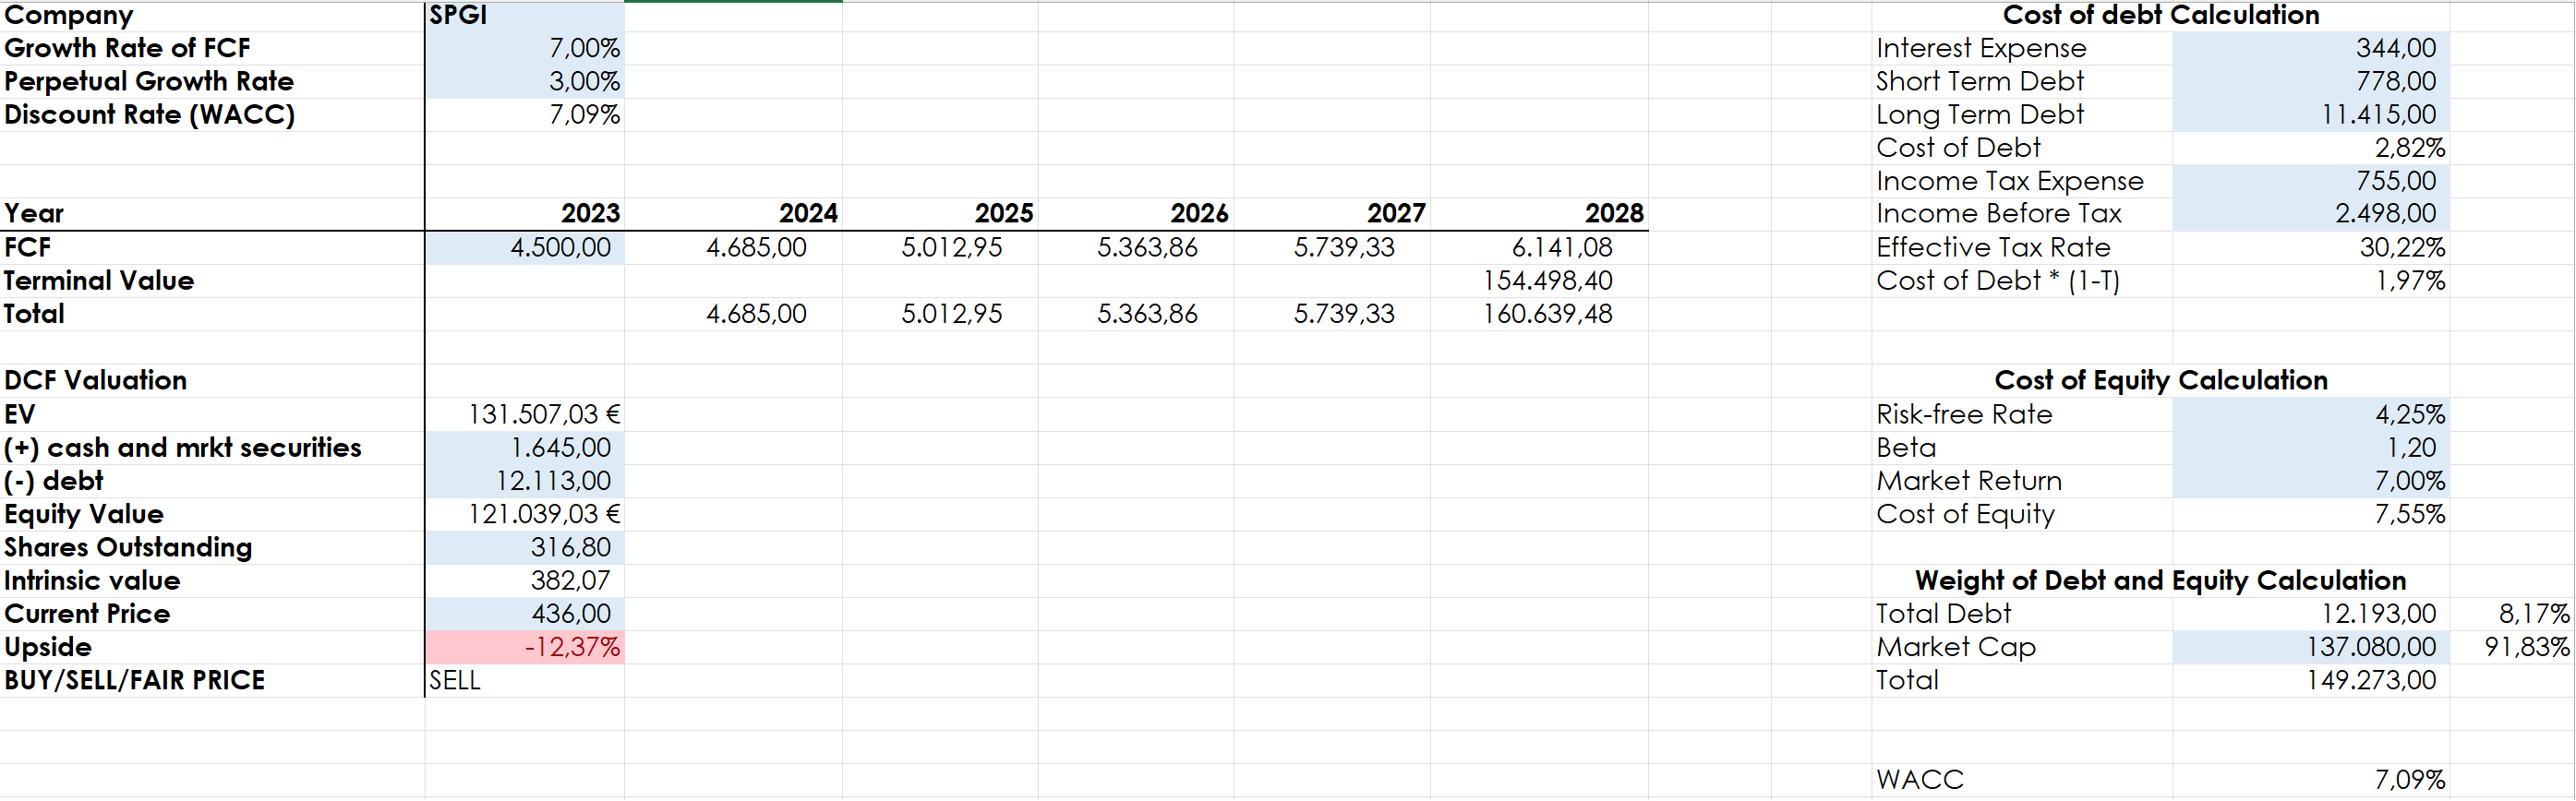
Now, if I run a discounted cash flow model that expects S&P Global to post $4.5 billion in FCF that will grow 7% annually for the next 5 years before moderating to a perpetual growth rate of 3%, we see how the company seems a bit overvalued right now, with its fair price being around $380. I bought my shares a bit below that price, in the $360s.
Now, no way I am saying S&P Global is a sell. But the stock reminds me of Costco ( COST ), which seems almost always overvalued but keeps on compounding steadily year after year, generating good results for almost any buy long-term investors have made.
I have considered investing in S&P Global, but certain factors make me hesitant. Although the company's revenue is of high quality, I would have to pay a 12% premium to invest now. While the company's price-to-earnings ratio is high, its free cash flow yield is 2.9%, which is not extremely high but seems fair.
Overall, S&P Global is in a bit of a grey zone. While it may provide good long-term returns, there is no clear margin of safety at the moment. Therefore, I am undecided between buying and holding the stock. For now, I have chosen to hold off on investing any more until the situation becomes clearer. One strategy could be to invest a fixed amount each month or quarter, which would help to average out any fluctuations.
If the price of S&P Global drops, it may become more attractive as an investment. I recommend doing thorough research before making any investment decisions.
For further details see:
Turning Debt Into Gold: Why S&P Global Fits In My Portfolio