USOI - U.S. July Oil Production Rises On Texas And GOM Jump
2023-10-05 05:31:00 ET
Summary
- U.S. July oil production increased by 91 kb/d to 12,991 kb/d. The large increase was primarily due to a 73 kb/d increase in the GOM and a 72 kb/d increase in Texas.
- New Mexico’s July production rose by 11 kb/d to 1,781 kb/d. Lea + Eddy rose by a similar amount, 12 kb/d.
- From May 2021 to April 2023, oil production in The Rest has been range bound between 3,000 kb/d and 3,200 kb/d.
- The largest number of frac spreads are operating in New Mexico’s Lea and Eddy counties, Colorado’s Weld county and Texas’ Reeves and Upton counties.
A guest post by Ovi
All of the Crude plus Condensate (C + C) production data for the US state charts comes from the EIA?s Petroleum Supply monthly PSM which provides updated information up to July 2023.
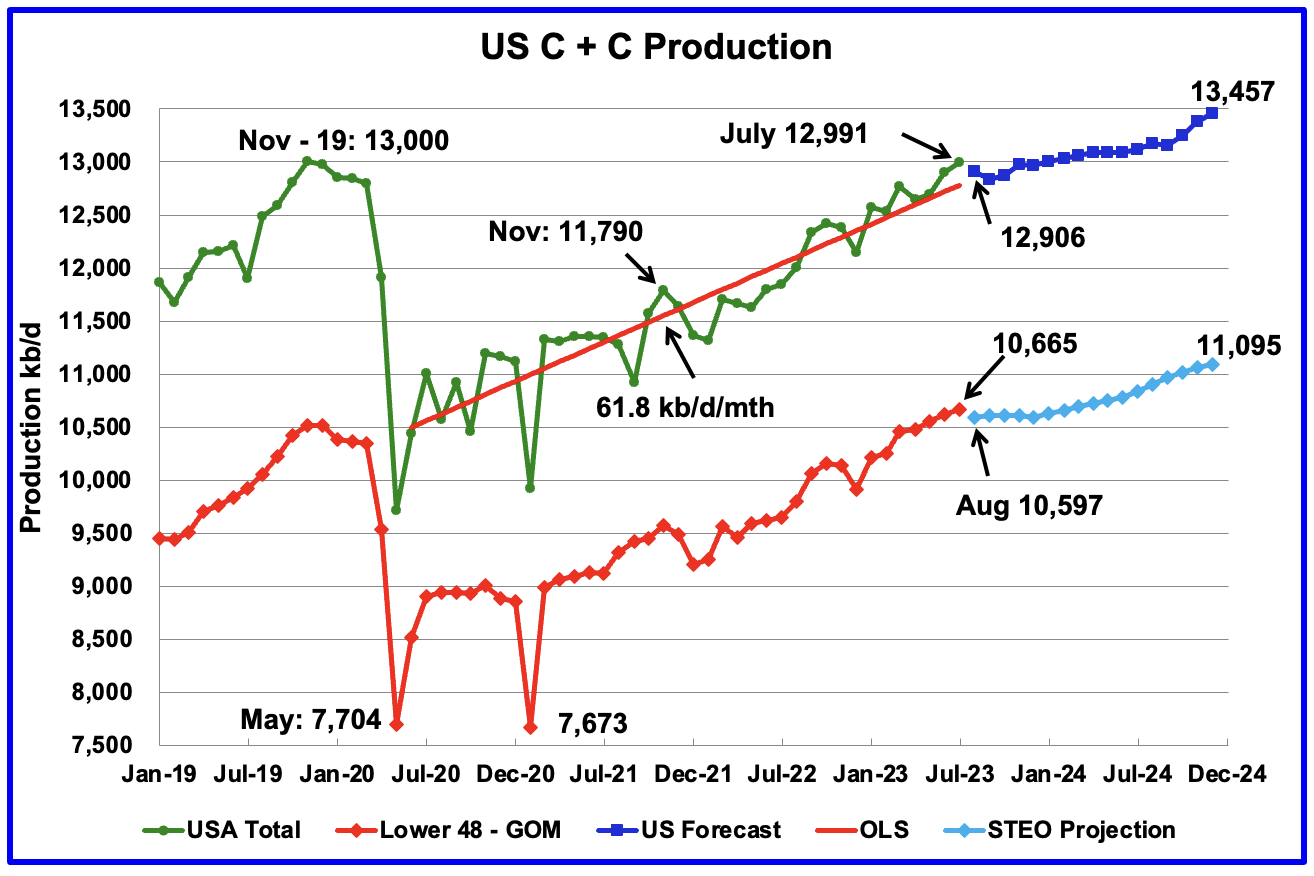
U.S. July oil production increased by 91 kb/d to 12,991 kb/d. The large increase was primarily due to a 73 kb/d increase in the GOM and a 72 kb/d increase in Texas.
The dark blue graph, taken from the September 2023 STEO, is the forecast for U.S. oil production from August 2023 to December 2024. Output for December 2024 is expected to be 13,457 kb/d which is 457 kb/d higher than the November 2019 peak of 13,000 kb/d.
The red OLS line from June 2020 to July 2023 indicates a monthly production growth rate of 61.8 kb/d/mth or 740 kb/d/yr. Clearly the growth rate going forward into the rest of 2023 and 2024, shown by the dark blue graph, is lower than seen in the previous July 2020 to June 2023 time period.
While overall US oil production increased by 91 kb/d, the Onshore L48 had a production increase of 44 kb/d to 10,665 kb/d in July.
The light blue graph is the STEO projection for output to December 2024 for the Onshore L48. From July 2023, to December 2024, production is expected to increase by 430 kb/d to 11,095 kb/d. However that increase appears to have two distinct growth periods, a no increase growth period out to December 2023 and a higher one in 2024. On average, the 430 kb/d increase indicates a monthly increase of 25.3 kb/d/mth or close to 300 kb/d/yr.
Oil Production Ranked by State
Listed above are the 10 states with the largest US oil production along with the Gulf of Mexico. These 10 states accounted for 82.2% of all U.S. oil production out of a total production of 12,991 kb/d in July 2023. Note that MoM production increases from the GOM and Texas are the main components of the overall July increase.
On a YoY basis, US production increased by 1,147 kb/d with the majority, 857 kb/d coming from Texas and New Mexico.
On a YoY basis, the average growth rate of Texas production has been 54.1 kb/d/mth or 649 kb/d, (See next chart), an incredible rate considering that the rig count and frac spread count are down. For how long can this rate be sustained?
State Oil Production Charts
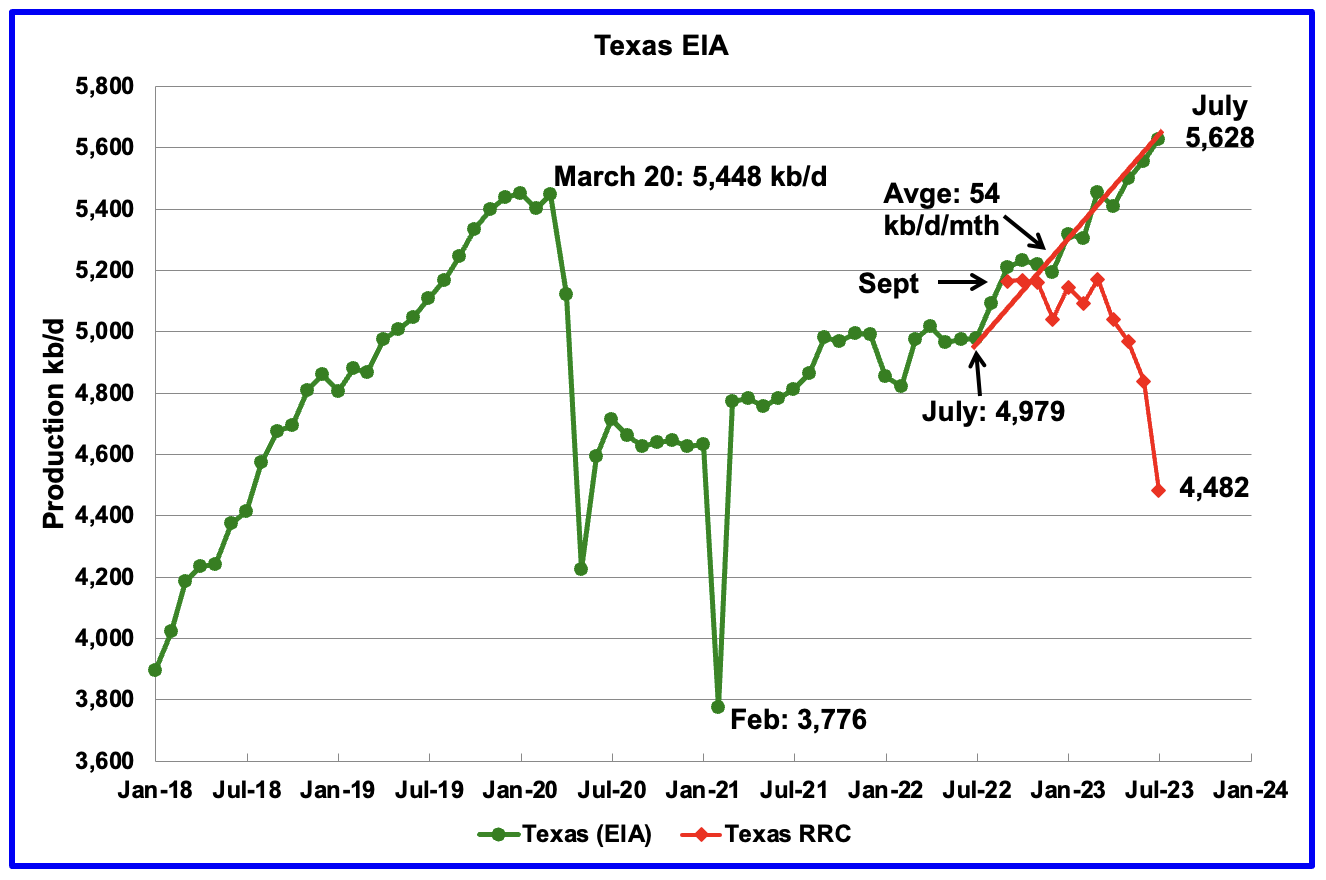
Texas production increased by 72 kb/d in July to 5,628 kb/d. July’s output is 180 kb/d higher than the March 2020 high of 5,448 kb/d.
The Texas RRC September production data has been added to this chart to compare it with the EIA data. While the first three red markers, September, October and November 2022 are reasonably close to the EIA’s production, the July 2023 gap is big. Not sure whether the July gap of 1,146 kb/d between the EIA and the RRC is typical for the RRC’s first report for the latest month.
This chart compares the LTO projection for the Spraberry trend vs production from the six main Spraberry counties shown.
According to this Source , the Spraberry includes “ portions ” of Irion , Reagan , Upton County, Texas - Wikipedia , Glasscock County, Texas - Wikipedia , Midland County, Texas - Wikipedia , and Martin Counties, although the underlying geologic unit also touches Dawson County, Texas - Wikipedia , Crockett County, Texas - Wikipedia , and Andrews Counties. Currently Dawson, Crockett and Irion have minimal output of ~10 kb/d to 15 kb/d. The Spraberry RRC production shown is for the whole county, not portions .
This chart has been added to show the coincidence in the production increase shown in the LTO Spraberry trend and the EIA Texas output. Over the period July 2022 to July 2023, Spraberry output rose by 597 kb/d while the EIA is indicating that overall Texas production rose by 649 kb/d. These two increases are very similar. Also the overall LTO increase over the same period is 633 kb/d . Over the same period the RRC data is essentially flat, especially the production from September to March. The production from April to July is down due to late incomplete reporting. Also the growth rate from July 2021 to July 2022 is much lower than the growth shown in the LTO data.
These three increases are so close as to make one wonder if the EIA is using the LTO projection to update the latest monthly Texas production ? For the next several months, the Texas chart will include the results from the Texas RRC to see how well it tracks the EIA forecast to try to answer that question.
This chart compares Permian and Texas production in four different ways. The DPR Permian, LTO Permian and Texas graphs are from the EIA. The total Permian graph is from the Texas RRC and New Mexico Oil and Gas division and includes production from the 11 biggest Permian counties. What is interesting to note is the rough parallelism between the Permian 11 and the DPR from November to March. The divergence after March is due to the late reporting from the Texas RRC and New Mexico O & G division. As noted above the LTO graph is more similar to the Texas chart, especially after July 2022. From January 2023 to July 2023 the average gap between the Texas and LTO graphs is 203 kb/d.
Over the next several months, it will become clear which one of these four graphs best reflects the trend in Texas production, the DPR or LTO.
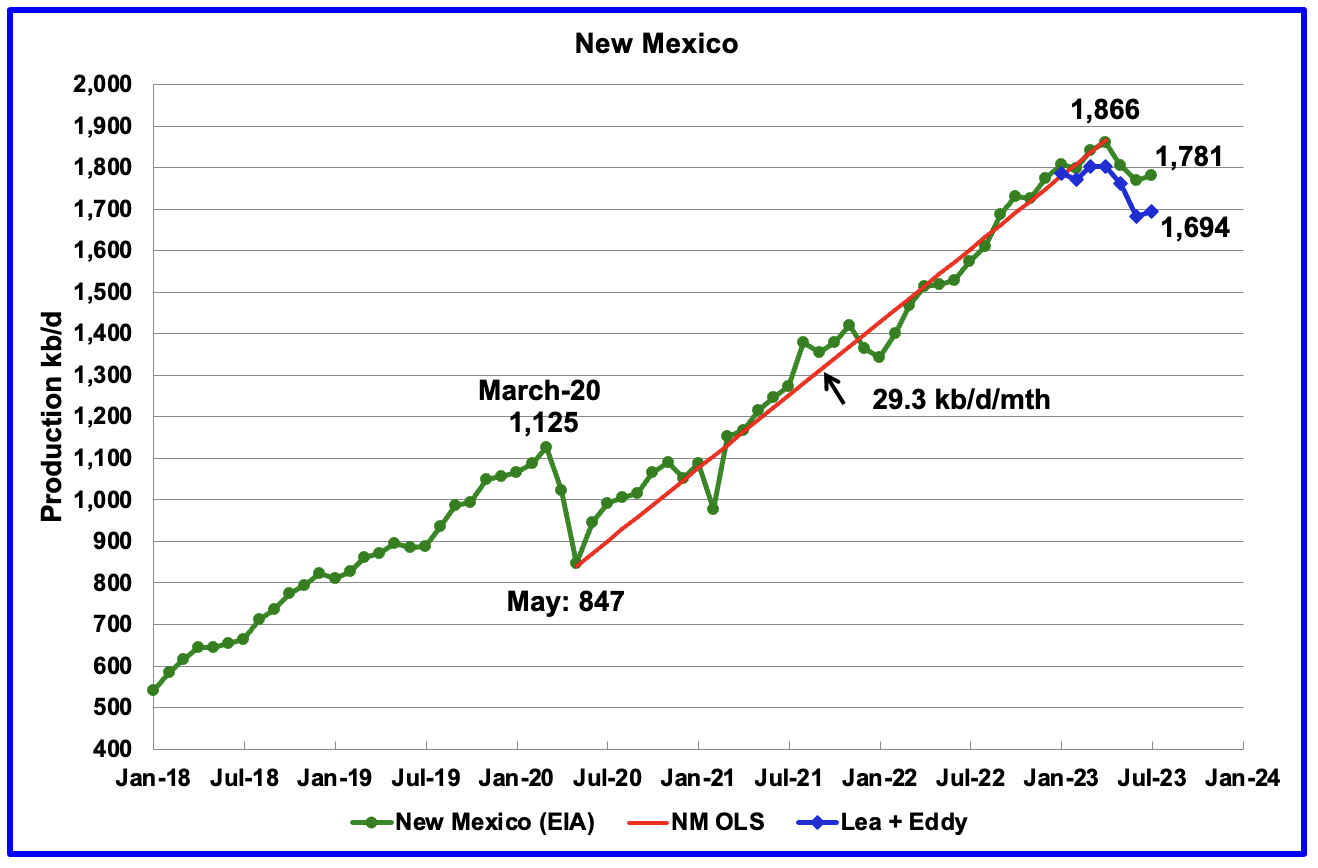
New Mexico’s July production rose by 11 kb/d to 1,781 kb/d. Lea + Eddy rose by a similar amount, 12 kb/d.
Of the 1,781 kb/d, 1,694 kb/d (95%) came from the Lea and Eddy counties. The Lea and Eddy county production data for July is not complete and will be updated over the next three months. The first blue marker is January’s total production from NM’s Lea and Eddy counties. Their combined output was 1,785 kb/d compared with 1,808 kb/d for all of New Mexico, a difference 23 kb/d. For February, the comparable production numbers are 1,799 kb/d and 1,771 kb/d, a difference of 28 kb/d. The combined output for all the remaining NM counties is close to 30 kb/d, which could be added to the May to July production.
More production information from these two counties is reviewed in the special Permian section further down.
July’s output increased by 14 kb/d to 1,172 kb/d. Current production remains below October’s 2020 production of 1,214 kb/d. Production over the next few months may slow as the rig count is projected to drop according to this Source .
“North Dakota oil production rose in July to a level not seen in two years, while natural gas production set a monthly record, the state’s top oil regulator said Thursday.
The state produced an average of nearly 1.18 million barrels per day in July, a 1% rise from June.
The state’s drilling rig count as of Thursday was 33, down from 37 in August. Rig count statewide is expected to gradually rise to the mid-forties over the next two years, according to Mineral Resources.
Helms attributed the low rig count to workforce shortages.
The rig count was still high enough to maintain production Helms added, but not enough to “create strong growth of more than 1 or 2% (annually).”
Well completion, which is the process needed to prepare a well for production, rose to 91 in August. “
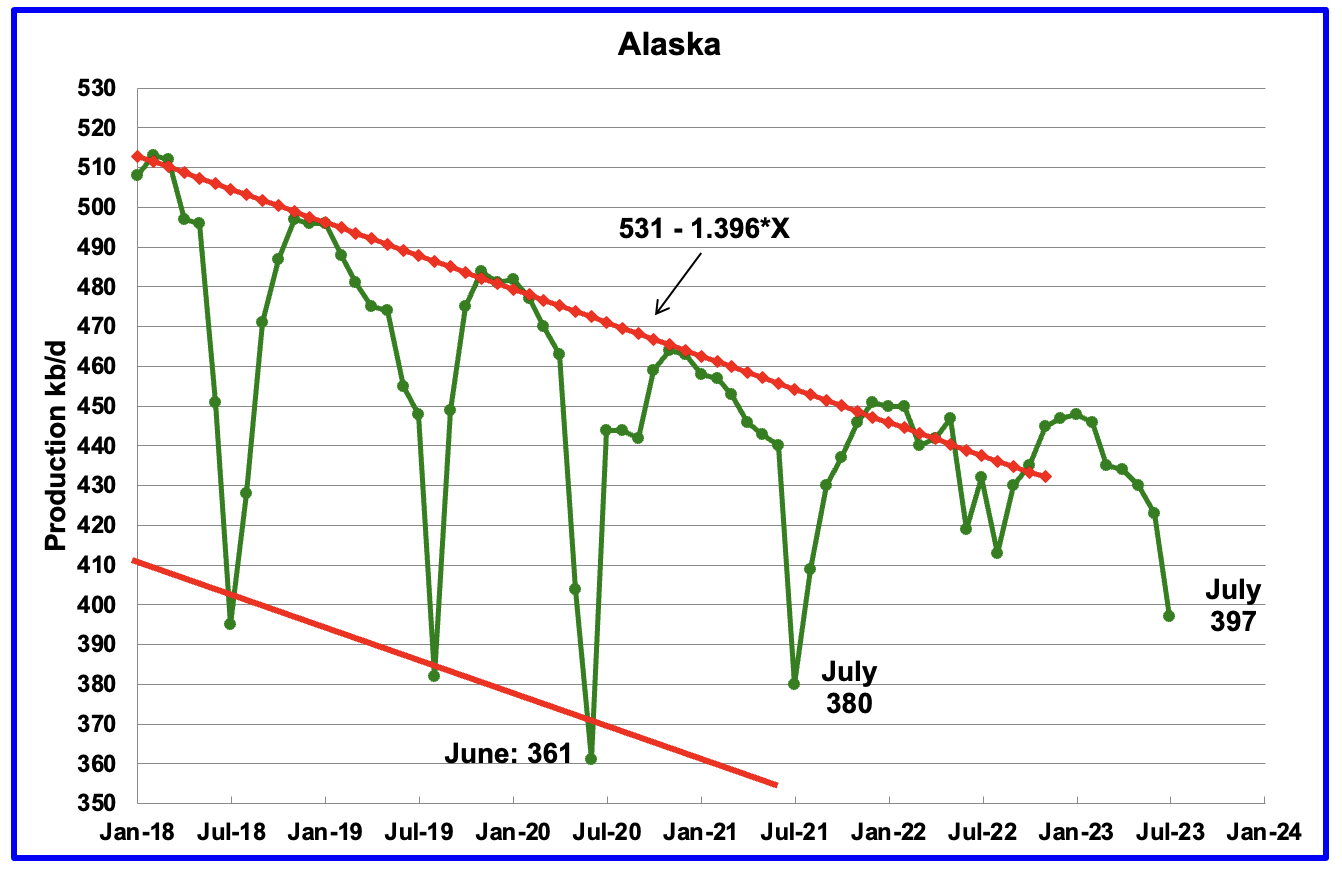
Alaska?s July output decreased by 26 kb/d to 397 kb/d. Production in 2023 is deviating from the down trend line of previous years due to the addition of a new oil field. Production YoY is down by 35 kb/d but up 17 kb/d from two years ago.
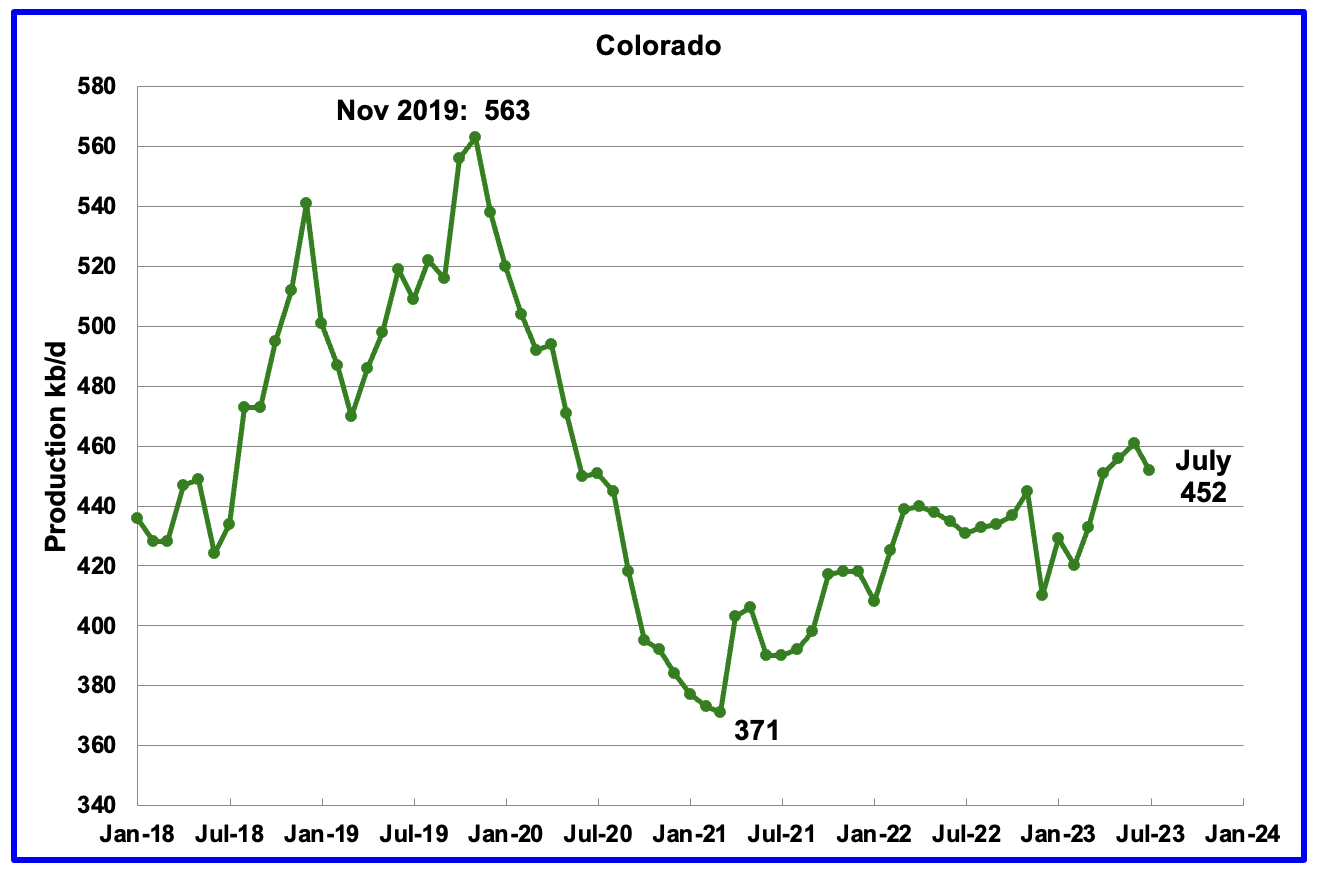
Colorado?s July production decreased by 9 kb/d to 452 kb/d.
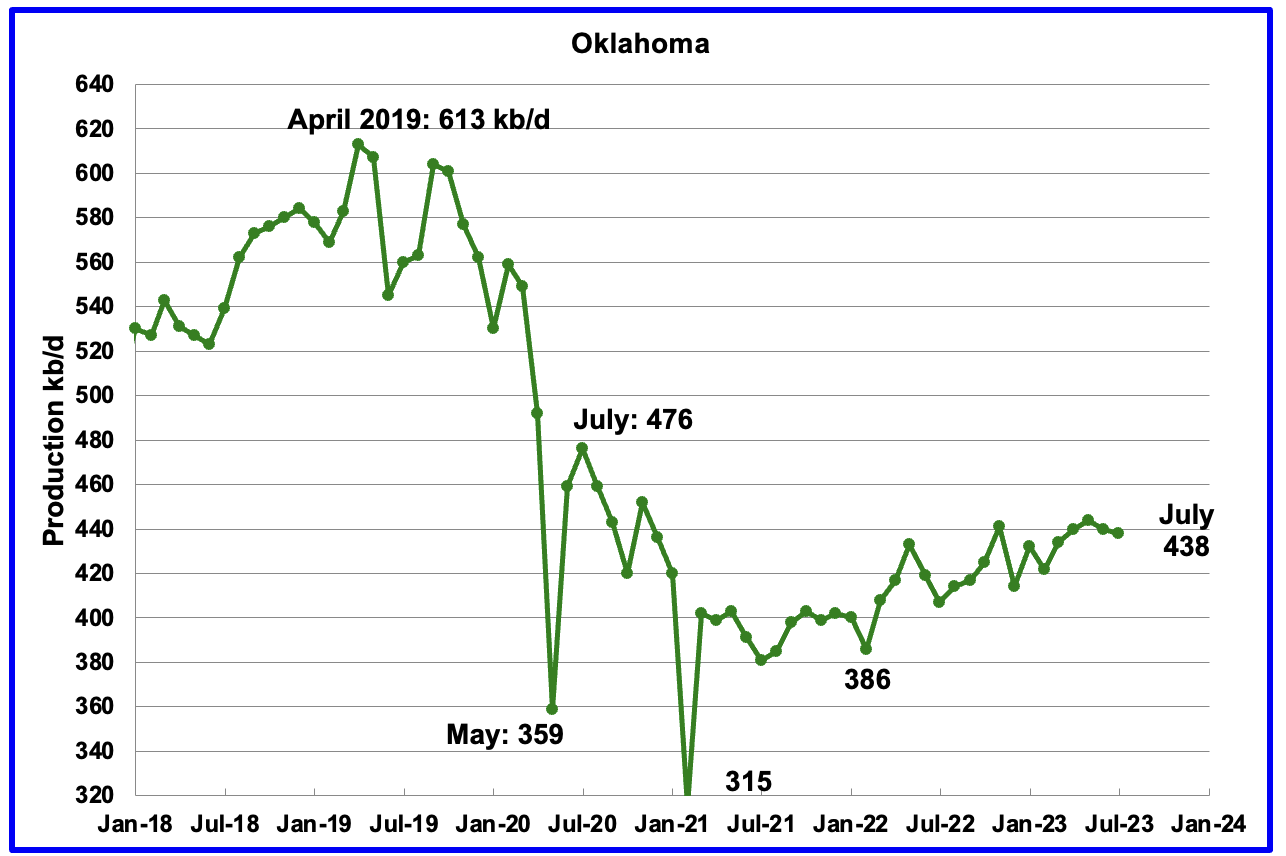
Oklahoma’s output in July decreased by 2 kb/d to 438 kb/d. Production remains 38 kb/d below the post pandemic July 2020 high of 476 kb/d and may be on a plateau phase.
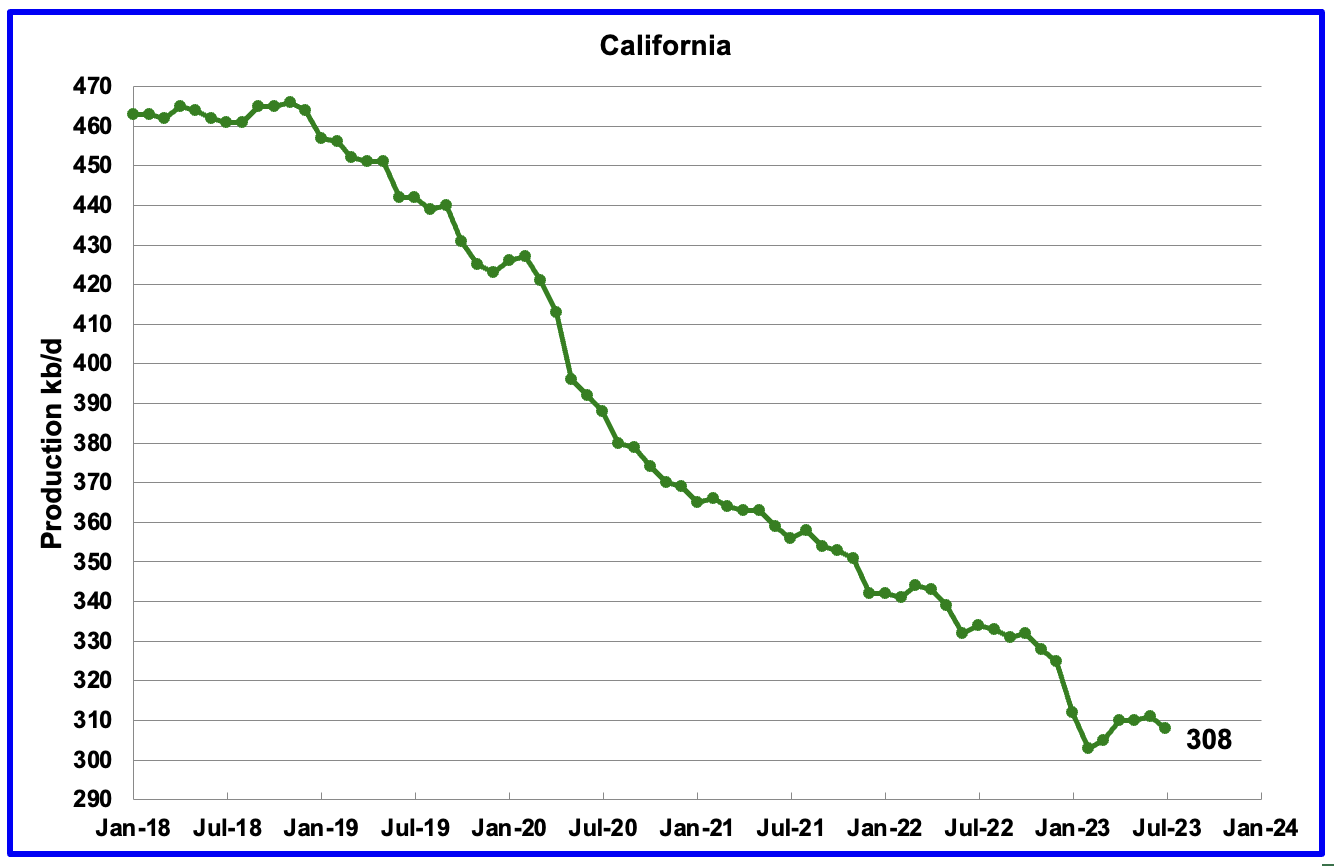
California?s overall slow output decline trend accelerated in January and February. However from March, through June production rose. July has returned to a declining trend by dropping by 3 kb/d to 308 kb/d.
Wyoming’s oil production in October and November 2022 reached a post pandemic high of 270 kb/d. July’s oil production decreased by 5 kb/d to 262 kb/d, 8 kb/d lower than November 2022. Production has been rebounding since February.
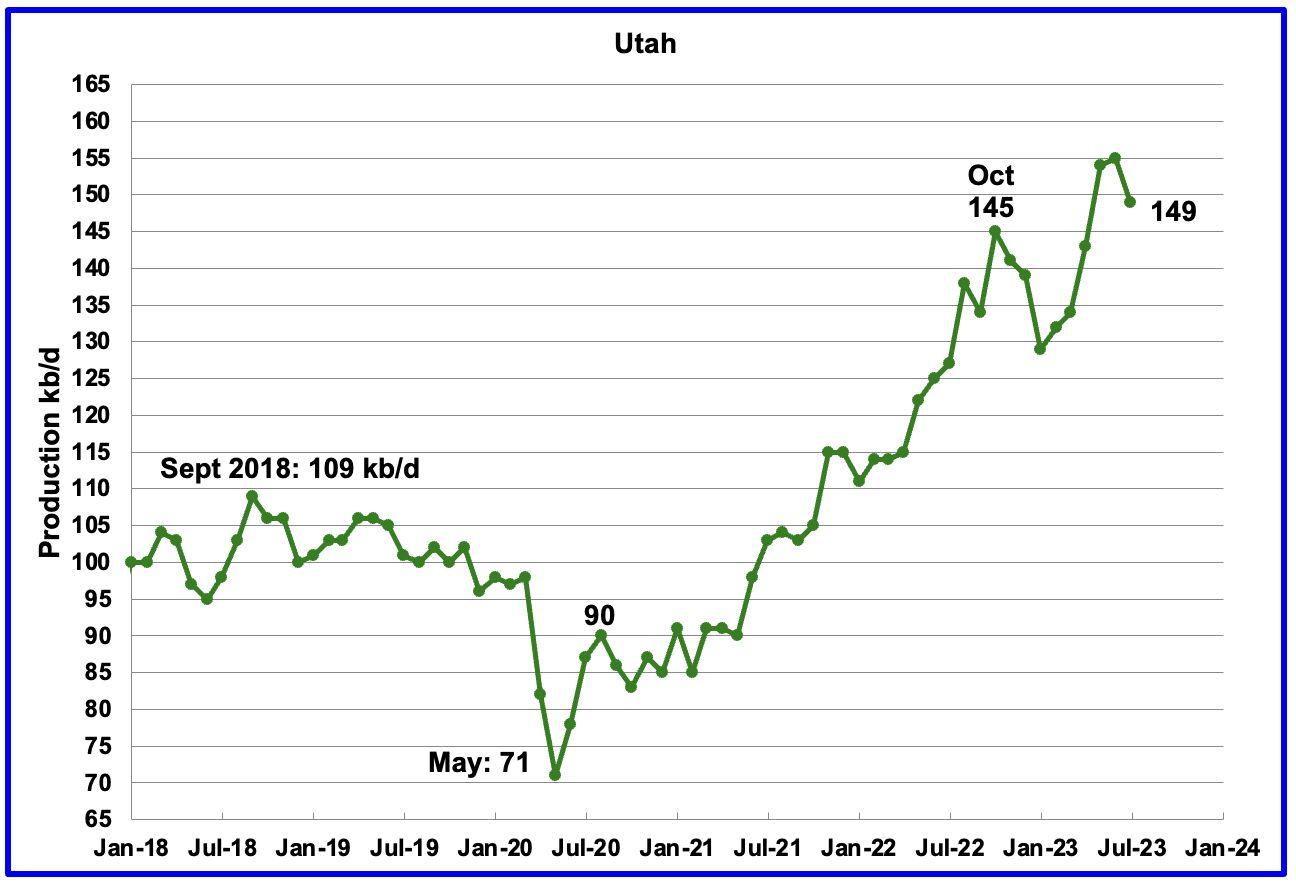
July’s production declined by 6 kb/d to 149 kb/d. For the first 4 months of 2023, Utah had 7 rigs operating. Since May the number of operational rigs has bounced between 8 and 9, which may account for the increased production.
The increased production since February has come from the Uinta basin .
Louisiana’s output entered a slow decline phase in November 2022. July’s production dropped by 1 kb/d to 93 kb/d and is 11 kb/d lower than May 2022.
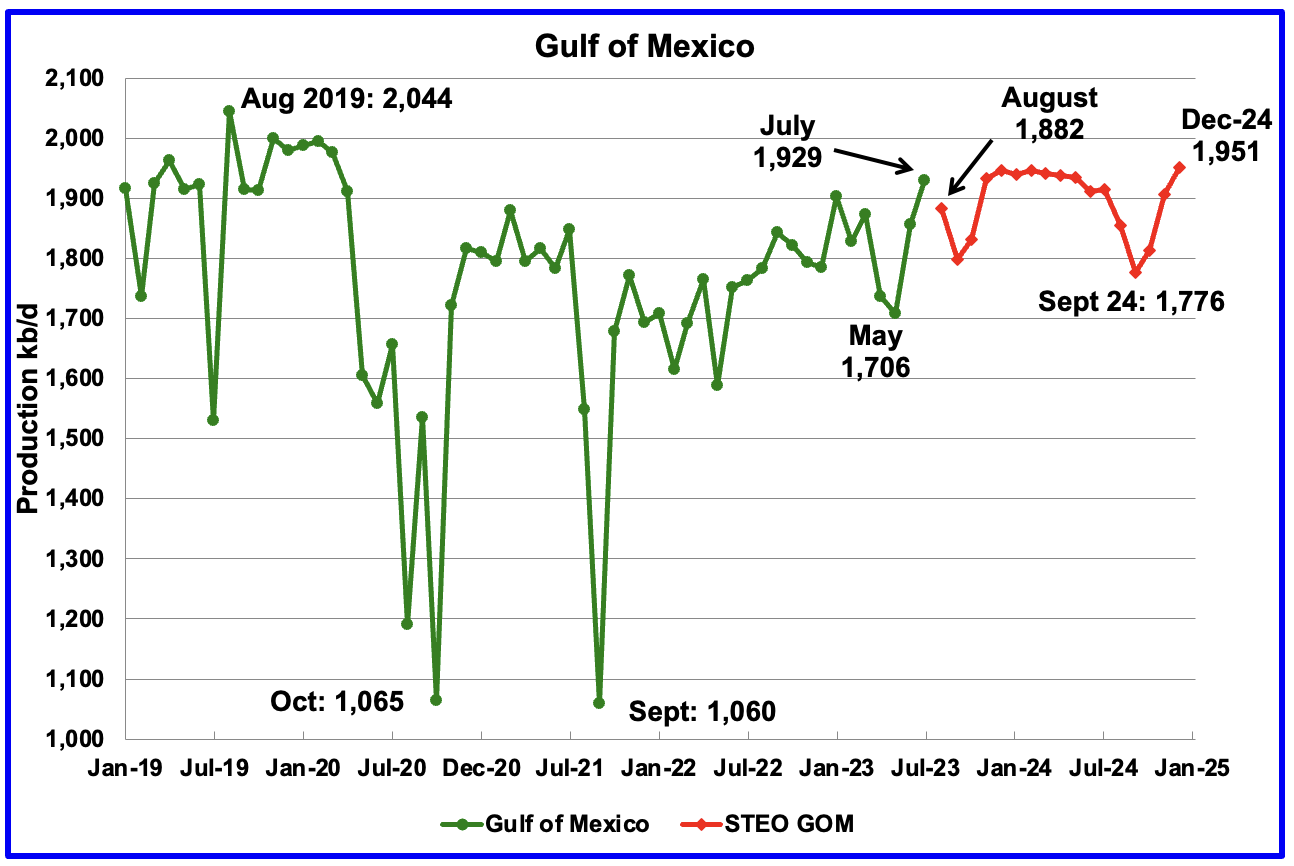
GOM production rose by 73 kb/d in July to 1,929 kb/d. Over the last two months, June and July, GOM output grew by 223 kb/d and is close to its peak for the next 17 months
The August 2023 STEO projection for the GOM output has been added to this chart and it projects that output in August 2023 will drop by 47 kb/d to 1,882 kb/d.
The August spike to 1,992 kb/d is a combination of the Vito platform and Mad Dog 2 field coming online .
It is not known if the GOM decline shown for August and September 2023 is related to extensive maintenance or potential hurricane activity.
A Different Perspective on US Oil Production
In this section US production is broken down into two parts, the Big Two , Texas and New Mexico, and the remaining states, The Rest .
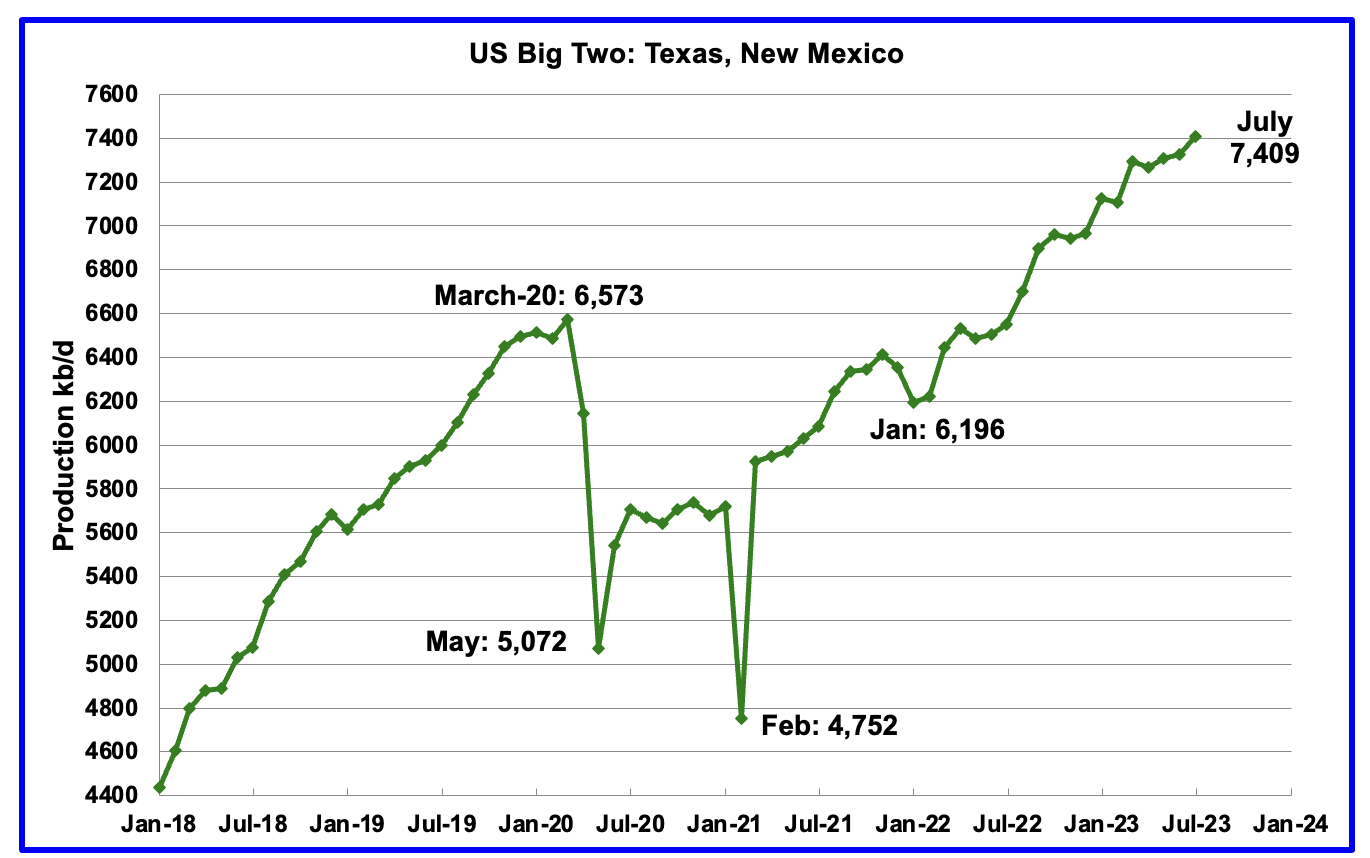
The Big Two states’ combined oil output for Texas and New Mexico.
July’s production in the Big Two states increased by a combined 83 kb/d to 7,409 kb/d with Texas adding 72 kb/d while New Mexico added 11 kb/d.
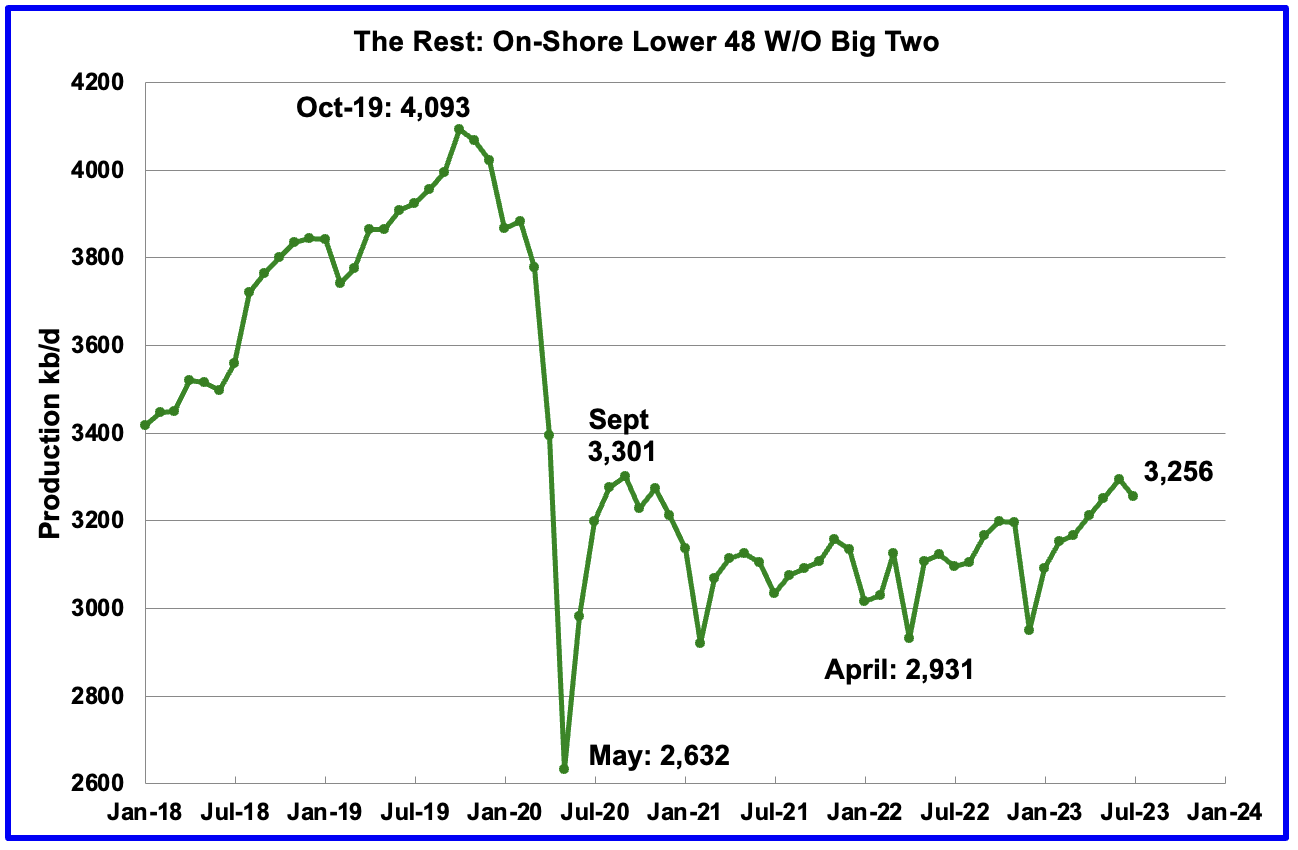
Oil production by The Rest
July’s production in The Rest fell by 39 kb/d to 3,256 kb/d. From May 2021 to April 2023, oil production in The Rest has been range bound between 3,000 kb/d and 3,200 kb/d. However May and June were the first months in which output broke above 3,200 kb/d. July’s drop brings output closer to 3,200 kb/d.
The main takeaway from The Rest chart is that current production is 837 kb/d below the high of October 2019 and this appears to be a permanent loss that will never be recovered.
Weekly Rig and Frac Spread Count
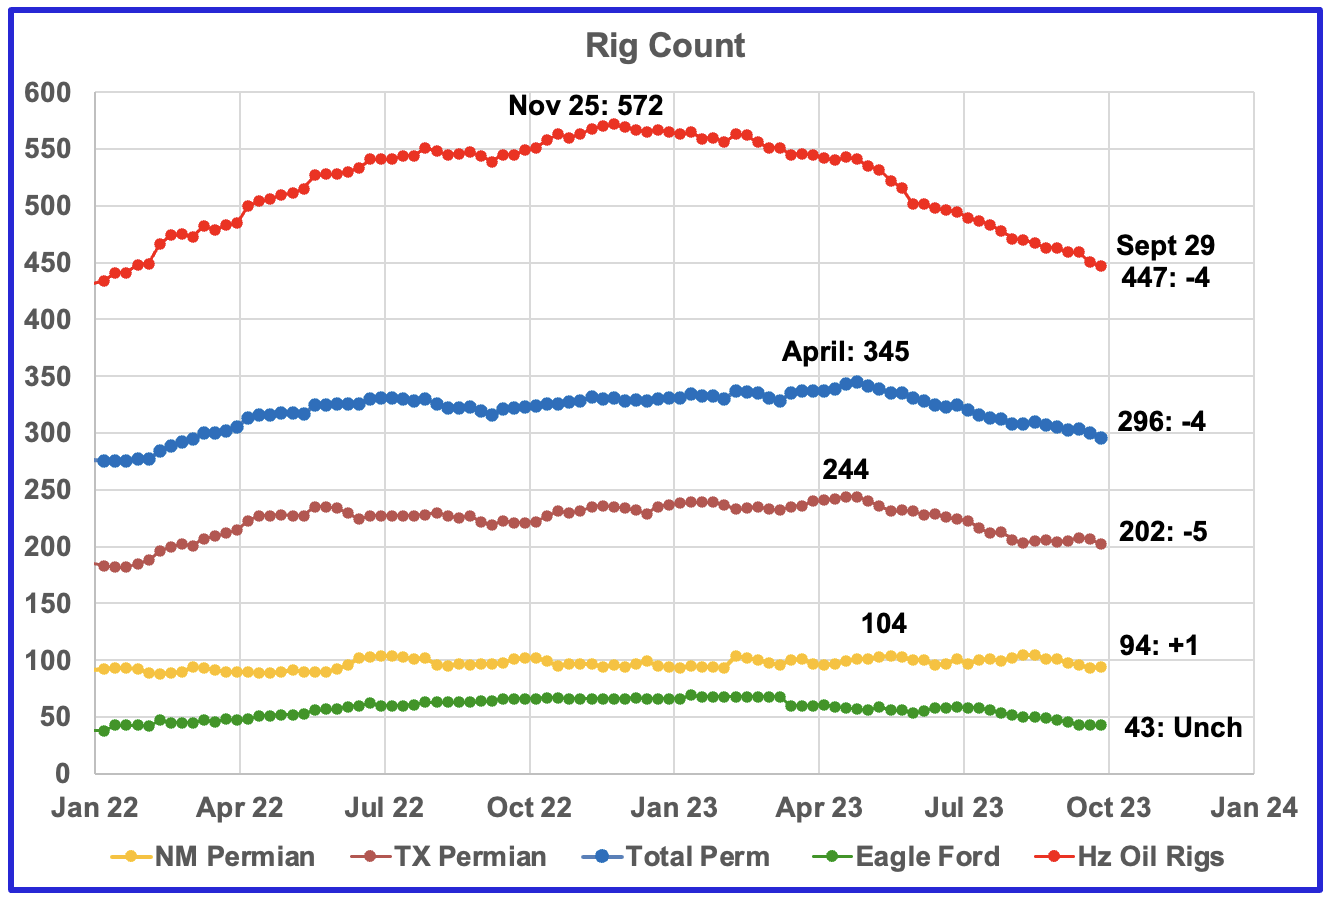
A high of 572 Hz oil rigs was reached in the week ending November 25, 2022. In the week ending Sept 29, 2023 the number of rigs dropped by another 4 to 447 and are now down 125 from the November high.
In the week ending September 29, Permian rigs decreased by 4 to 296 and Texas rigs were down 4 to 252, (not shown). Specifically for the Permian, Texas was down 5 to 202 while New Mexico was up 1 to 94. Note that the general trend for rigs in the Permian is a slow decrease since the April high and is currently 49 fewer than the 345 rigs operating on April 28, 2023.
In April 2023, WTI was over $80/b and dropping. Now that WTI is back over $90/b, will the decreasing rig count trend reverse?
For most of 2022, the frac spread count wandered between 250 and 300 fracs per week. For all of 2022 the average weekly frac count was 280.
For the week ending September 29, the frac count dropped by 4 to 255 and is down 45 from the high of 300 in November 2022. The current count is significantly lower than the 2022 average of 280 frac spreads per week.
Note that these 255 frac spreads include both gas and oil spreads.
Frac Spread by County and Basin
Above is the Frac Spread count by Basin and County for the week ending August 25. Only the counties with 4 or more frac spreads are shown.
The CSV data published by this site appears to be about 5 to 6 weeks delayed. While data for later weeks is published, it appears to be incomplete. For the week ending August 25, the official frac count reported for that week was 246. This analysis is showing 262. This leads me to think that the analysis is reasonably correct and that the late reporting adds frac spreads missed on the week of the count.
The largest number of frac spreads are operating in New Mexico’s Lea and Eddy counties, Colorado’s Weld county and Texas’ Reeves and Upton counties.
Note that the majority of completed wells produce oil, 232 out of 262.
Permian Basin Report by Main Counties
This monthly Permian section is being added to the US report because of a range of views on whether Permian production will continue to grow or will peak over the next year or two. The issue was brought into focus recently by the Goehring and Rozencwajg Report which indicated that a few of the biggest Permian oil producing counties were close to peaking or past peak. Also comments by posters on this site have similar beliefs from hands on experience.
This section will focus on the four largest oil producing counties in the Permian, Lea, Eddy, Midland and Martin. It will track the oil and natural gas production and the associated Gas Oil Ratio (GOR) on a monthly basis. The data is taken from the state’s government agencies for Texas and New Mexico . Typically the data for the latest two or three months is not complete and is revised upward as companies submit their updated information. Note that the natural gas production shown in the charts that is used to calculate the GOR is solely the gas coming from the oil wells .
Of particular interest will be the charts which plot oil production vs GOR for a county to see if a particular characteristic develops that indicates the field is close to entering the bubble point phase. While the GOR metric is best suited for characterizing individual wells, counties with closely spaced horizontal wells may display a behaviour similar to individual wells due to pressure cross talking . For further information on the bubble point and GOR, there are a few good thoughts on the intricacies of the GOR in an earlier POB comment . Also check this EIA topic on GOR.
This chart shows oil production from the 11 largest counties in the Permian. In the New Mexico Permian, there are two counties Lea and Eddy. The remaining nine are in Texas; Midland, Martin, Reeves, Karnes, Loving, Howard, Reagan, Glasscock and Upton . The graphs are updated to July.
The red markers show production from the two NM counties while the blue markers show total production for NM from the EIA monthly production report. The EIA must have some correction factors to increase NM’s output from NM’s official site. The brown markers show output from the 9 biggest Permian counties in Texas.
New Mexico Permian
Over the past 6 weeks drilling activity in Lea county has been dropping while in Eddy it is holding steady.
Over the last three months, gas production has risen faster than oil production in Lea county. The May production numbers will see a small increase while June and July will have bigger increases because their production has not been fully reported.
After much zigging and zagging production in Lea county stabilized above 1,000 kb/d while the GOR exceeded the semi-bounded GOR for the time time while production slowed and possibly has begun to decline. The data for the last two data points, June and July, is incomplete. May production will see a small increase.
This pattern of a zigging and zagging GOR within a semi-bounded GOR while oil production increases to some stable level and then moves out to a higher GOR to the right has shown up in a number of counties . See an additional three cases below. However this is the first month in which Lea county has registered a GOR outside of the semi-bounded GOR range .
The Eddy county GOR pattern is similar to Lea county except that Eddy has broken out from the semi bounded range for a longer period. Does the breakout indicate that most of the wells in this county have entered the bubble point phase?
Texas Permian
During September, drilling activity has been increasing in Martin county while it has been dropping in Midland county. Since these two counties are adjacent, could these rigs just be moving between counties.
Natural Gas production is increasing while oil production drops in Midland county.
GOR breaking out to higher values and oil production dropping. Has Midland entered the bubble phase?
Natural Gas production is increasing while oil production drops.
Similar GOR pattern to Martin county. Note that Midland county is adjacent to Martin county and the pressure could be dropping in both fields.
All of the oil production vs GOR charts above are exhibiting characteristics indicating that the four largest oil producing counties in the Permian are in the bubble point phase and are close to or past their peak?
In the latest Goehring & Rozencwaig Report , the authors believe that Permian production will roll over in 2024 as noted in the paragraph below. They are looking at the same data as shown in the Permian charts above, in addition to adding their own deeper knowledge. The four largest Permian basins shown above are all showing signs of peaking. However when looking at production in Texas as reported by the EIA, it continues to show no signs of rolling over.
This divergence in the production trend between the G & R report, the above Permian charts and the Texas chart hopefully will resolve itself over the next three months.
“Since we last wrote, Permian depletion has accelerated. Last year marked the first time Permian productivity per lateral foot decreased year-over-year, falling by 7%. For the first three months of 2023, productivity per foot fell by a further 4% compared with 2022. According to the Energy Information Agency ((EIA)), by August, the Permian will be growing by only 360,000 b/d year-on-year, compared with nearly 700,000 b/d as recently as February. Our models suggest that year-on-year Permian growth will be less than 100,000 b/d by year-end and turn negative in early 2024. Although the next few months may be bumpy, we believe the Permian will definitively roll over sometime in 2024 as companies run out of their best drilling prospects. Despite high prices, producers dropped fourteen rigs in the Permian over the past three months, potentially signally inventory exhaustion. The other US shales are not faring any better. Shale production outside the Permian has not grown in nearly three years, despite oil rallying from $20 to $75 per barrel. The only material source of non-OPEC+ growth over the past fifteen years is about to peak.“
Biggest Oil producing County in the Eagle Ford
Both oil and gas production are falling in Karnes county and both are down 55%.
This is the GOR vs oil production for Karnes county but the GOR is still within its typical range while production is dropping. This may indicate that Karnes county wells have not entered the bubble point phase.
Drilling Productivity Report
The Drilling Productivity Report (DPR) uses recent data on the total number of drilling rigs in operation along with estimates of drilling productivity and estimated changes in production from existing oil wells to provide estimated changes in oil production for the principal tight oil regions. The August DPR report forecasts production to September 2023 and the following charts are updated to September 2023. The DUC charts and Drilled Wells charts are updated to July 2023.
Above is the total oil production projected to October 2023 for the 7 DPR basins that the EIA tracks. Note that DPR production includes both LTO oil and oil from conventional wells.
The DPR is projecting that oil output for October 2023 will decrease by 41 kb/d to 9,391 kb/d. This is the second drop in a row since the July peak of 9,476 kb/d. The drop is due to the reduced drilling and completions that began earlier this year.
According to the EIA DPR report, Permian output continued to roll over in September. It is expected to decrease by 13 kb/d to 5,799 kb/d. The last six months of production data clearly shows a slowing trend in monthly production increases which now has turned to decreases, similar to the trend above for the total oil production in the DPR regions. Watch this No te the production difference with the following LTO chart.
October’s output is 856 kb/d higher than the pre-pandemic high 4,917 kb/d.
During August, 450 wells were drilled and 453 were completed in the Permian. (Note that August is the latest month for DUC information). The completed wells added 367 kb/d to August’s output for an average of 811 b/d/well. The overall decline was 377 kb/d which resulted in a net decrease for Permian output in August of 10 kb/d. Of the 450 completed wells in August, 464 would have been required to offset the decline, 11 fewer than than the 453 completed.
This chart shows the average first month total production from Permian wells tracked on a monthly basis. The total monthly production from the newest Permian wells in October is expected to be 357 kb/d. Production since July continues to drop slowly. Production dropped from 371 kb/d in July to 357 kb/d in October. Recall that this production of 357 kb/d is offset by a decline of 383 kb/d for a net decline of 26 kb/d.
Output in the Eagle Ford basin has been in a generally flat trend since March 2021, fluctuating over a range of between 1,050 kb/d to 1,150 kb/d. October’s forecast projects output is expected to decrease by 17 kb/d to 1,109 kb/d.
At the beginning of the year 2023, 68 rigs were operating in the Eagle Ford basin. The rig count began to drop in mid March to 60 and slowly dropped further to 43 in September .
The DPR forecasts Bakken output in October will be 1,227 kb/d an increase of 3 kb/d over September. October production is 18 kb/d lower than the post pandemic peak of 1,245 kb/d in October 2020.
The monthly completion rate and drilling has shown signs of dropping recently since the January highs.
In August 2023, 82 wells were completed while 65 new wells were drilled.
The North Dakota government reported that July production increased by 14 kb/d to 1,181 kb/d. With completions dropping, as shown in the previous chart, production increases can be expected to slow.
Output in the Niobrara continues to increase slowly. October’s output increased by 5 kb/d to 682 kb/d.
Production increased due to the addition of rigs into the basin but stabilized at 16 ± 1 rigs in March and April. However in August and September the rig count dropped to 14.
DUCs and Drilled Wells
The number of DUCs available for completion in the Permian and the four major DPR oil basins has fallen every month since July 2020 and continued to decrease in August. August DUCs decreased by 32 to 2,517. Of the 32 DUCs decrease, 14 came from the Bakken and 9 from the Niobrara.
August Permian DUCs decreased by 3. However July was revised down from 856 to 833, a downward revision of 26 DUCs
In these 4 basins, 746 wells were drilled while 714 were completed. Both drilled wells and completions are down from higher levels in late 2022 and early 2023.
In the Permian, the monthly completion rate has been showing signs of slowing since the October 2022 high of 535.
In August 2023, 453 wells were completed while 450 new wells were drilled. The gap between completed and drilled wells in the Permian is now very small compared to late 2022 and early 2023.
The Permian, as of August, had 830 DUCs remaining and the completion rate was 453 wells/mth. This means that the current cycle time between drilling and completions is 1.83 months or 56 days.
Editor's Note: The summary bullets for this article were chosen by Seeking Alpha editors.
For further details see:
U.S. July Oil Production Rises On Texas And GOM Jump