USOI - U.S. June Oil Production Rises On GOM Jump
2023-09-08 00:20:00 ET
Summary
- U.S. June oil production increased by 207 kb/d to 12,844 kb/d. The large increase is primarily due to a 147 kb/d increase in the GOM.
- The August STEO forecast for June production was 12,676 kb/d, low by 168 kb/d.
- While overall US oil production increased by 207 kb/d, the Onshore L48 had a production increase of 67 kb/d to 10,568 kb/d in June.
By Ovi
All of the Crude plus Condensate (C + C) production data for the US state charts comes from the EIA?s Petroleum Supply monthly PSM which provides updated information up to June 2023.
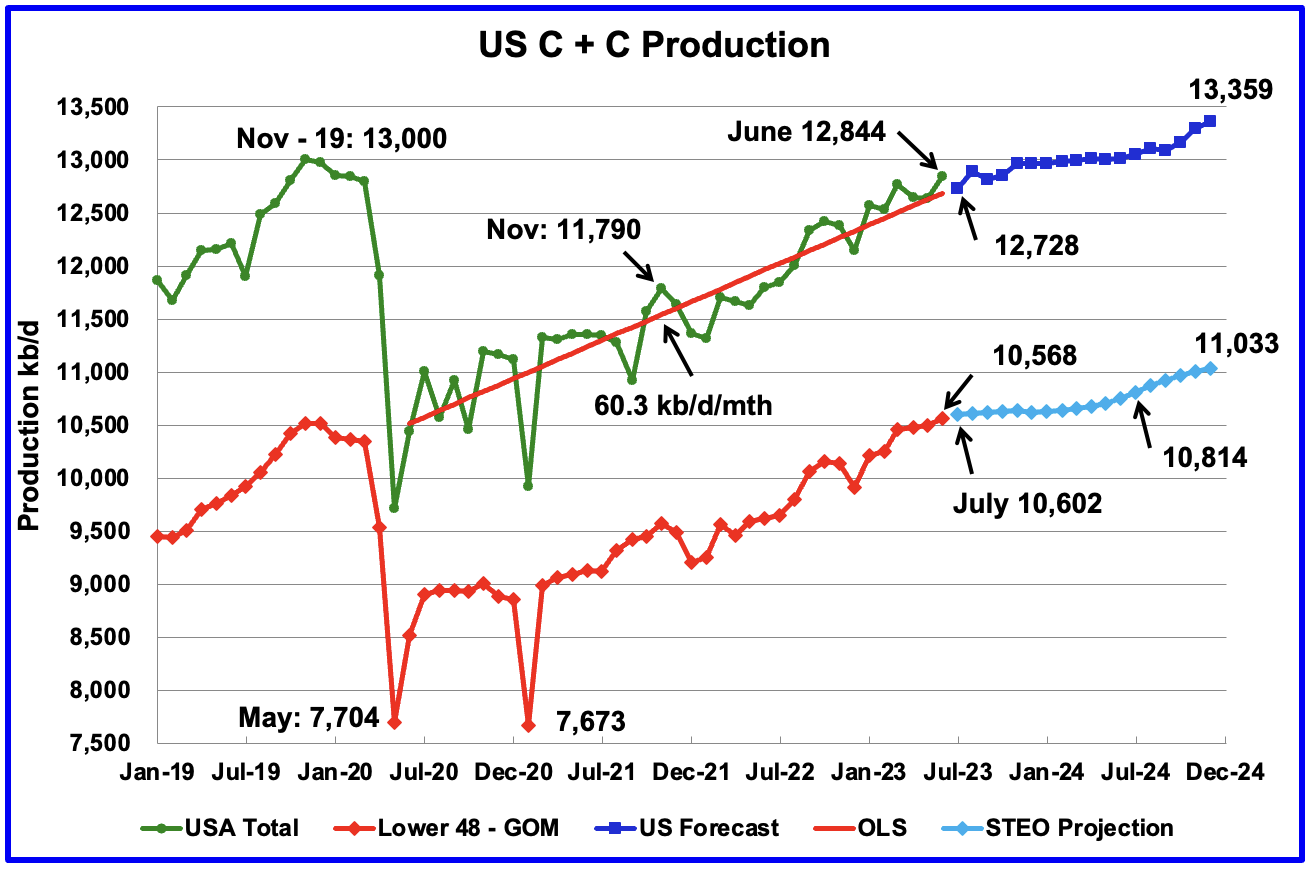
U.S. June oil production increased by 207 kb/d to 12,844 kb/d. The large increase is primarily due to a 147 kb/d increase in the GOM.
The dark blue graph, taken from the August 2023 STEO, is the forecast for U.S. oil production from July 2023 to December 2024. Output for December 2024 is expected to be 13,359 kb/d which is 359 kb/d higher than the November 2019 peak of 13,000 kb/d.
From July 2023 to December 2024, production is forecast to increase by 631 kb/d.
The August STEO forecast for June production was 12,676 kb/d, low by 168 kb/d.
The red OLS line from June 2020 to July 2023 indicates a monthly production growth rate of 60.3 kb/d/mth. Clearly, the growth rate going forward into the rest of 2023 and 2024, shown in the dark blue graph, is projected to be lower than seen in the previous July 2020 to June 2023 period.
While overall US oil production increased by 207 kb/d, the Onshore L48 had a production increase of 67 kb/d to 10,568 kb/d in June.
The light blue graph is the STEO projection for output to December 2024 for the Onshore L48. From July 2023, to December 2024, production is expected to increase by 431 kb/d to 11,033 kb/d. However that increase appears to have two distinct periods, a low increase period and a high increase one.
From July 2023 to July 2024, production increases by 212 kb/d to 10,814 kb/d or at an average rate of 17.7 kb/d/mth. From July 2024 to December 2024, production increases by 219 kb/d or at an average rate of 43.8 kb/d/mth. It is not clear what causes the sudden increase in production rate starting in August 2024.
Oil Production Ranked by State
Listed above are the 10 states with the largest US oil production along with the Gulf of Mexico. These 10 states accounted for 82.4% of all U.S. oil production out of a total production of 12,844 kb/d in June 2023. Note that GOM MoM production is the main component of the June increase of 207 kb/d.
On a YoY basis, US production increased by 1,047 kb/d with the majority, 778 kb/d coming from Texas and New Mexico.
State Oil Production Charts
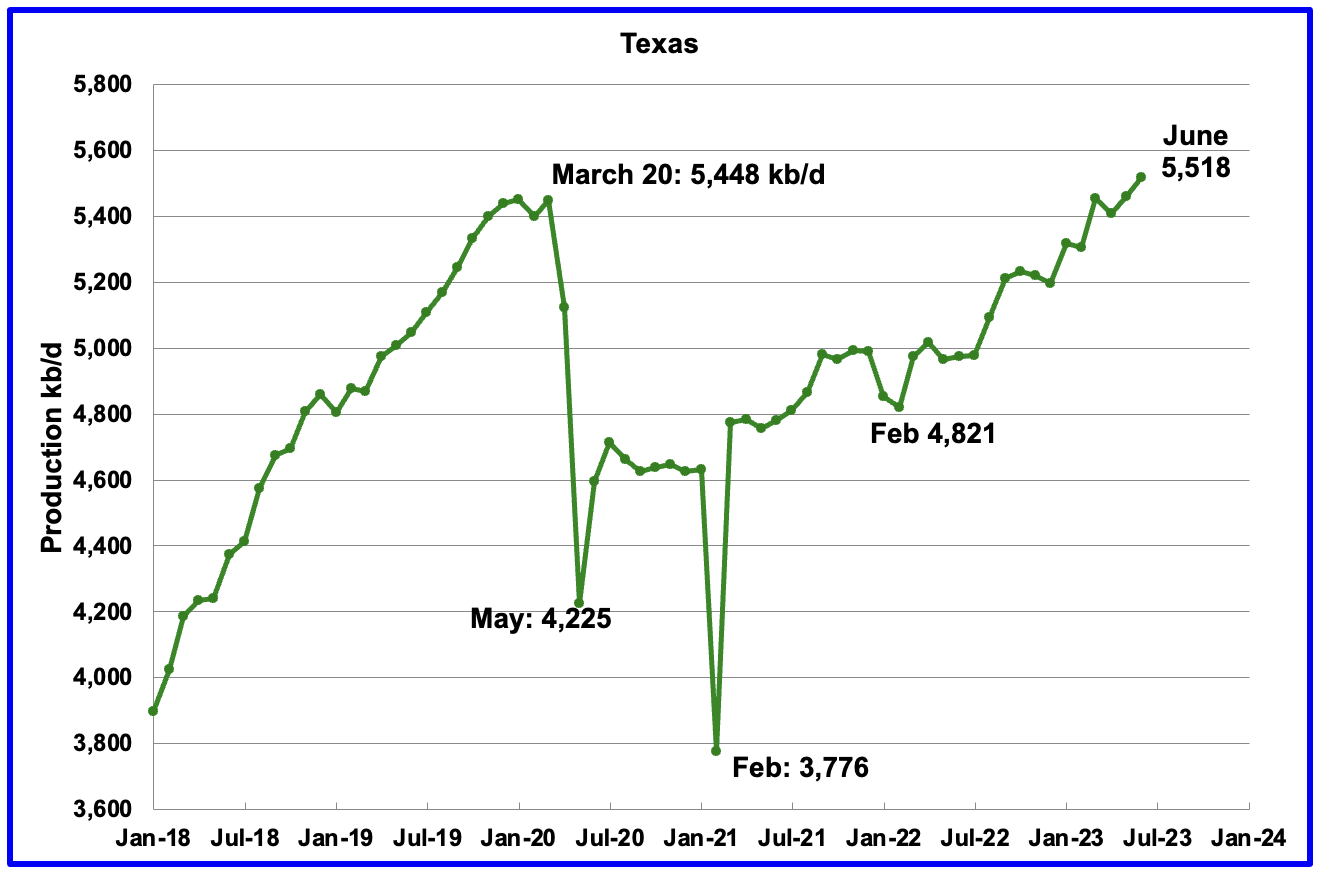
Texas production increased by 58 kb/d in June to 5,518 kb/d. June’s output is 70 kb/d higher than the March 2020 high of 5,448 kb/d. Part of June’s 58 kb/d increase is due to May being revised down by 34 kb/d. Relative to the original May post, June production is up by 24 kb/d.
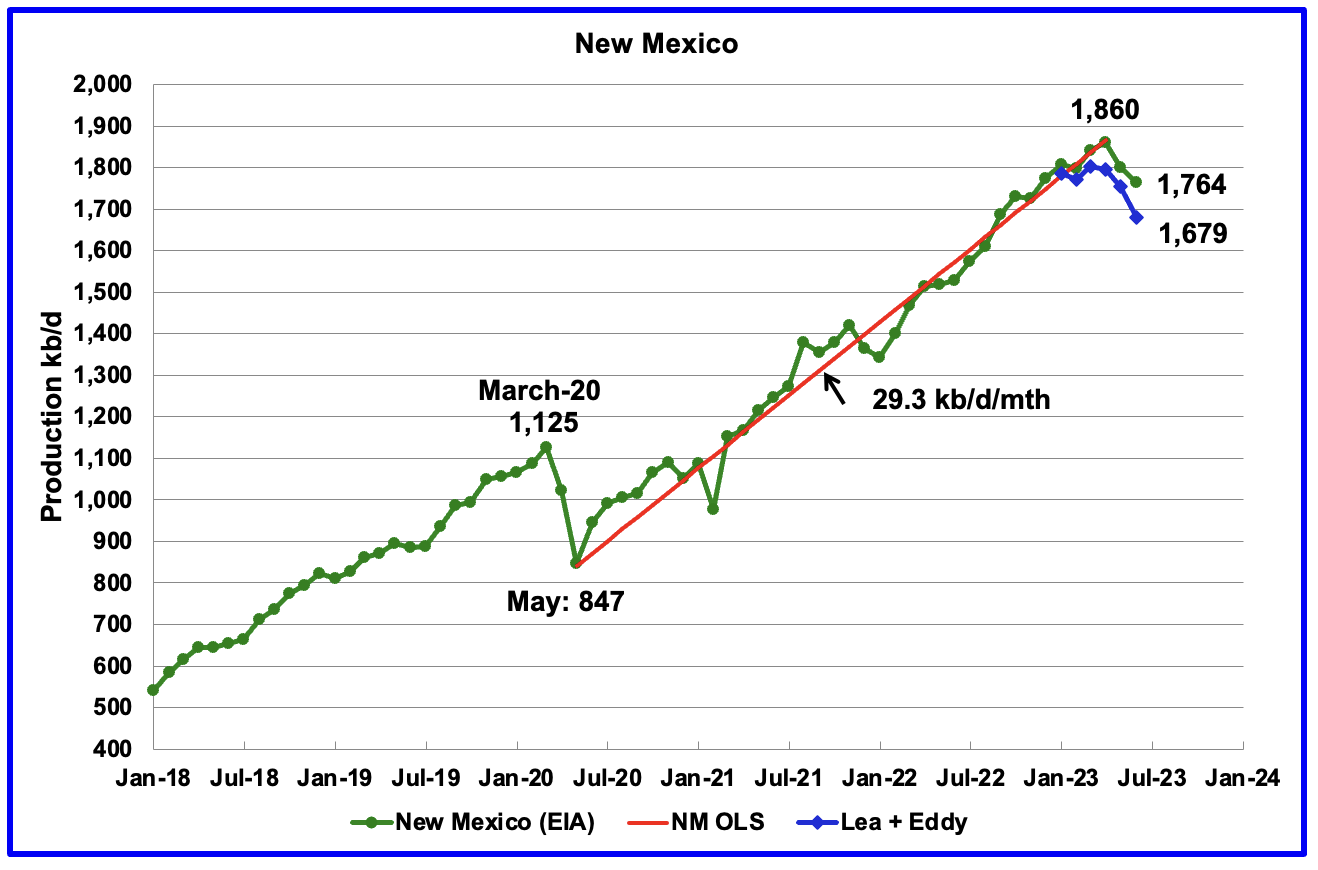
New Mexico’s June production decline is the second significant one since January 2022. June’s production decreased by 37 kb/d to 1,764kb/d.
Of the 1,764 kb/d, 1,679 kb/d came from the Lea and Eddy counties, 95%. The Lea and Eddy county production data for June is not complete and will be updated over the next three months.
The first blue marker is January’s total production from NM’s Lea and Eddy counties. Their combined output was 1,785 kb/d compared with 1,808 kb/d for all of New Mexico, a difference 23 kb/d. For February, the comparable production numbers are 1,799 kb/d and 1,771 kb/d, a difference of 28 kb/d.
More production information from these two counties is reviewed in the special Permian section further down.
North Dakota’s oil production has begun to increase after being impacted by extreme cold weather in December. June’s output increased by 37 kb/d to 1,156 kb/d. Current production is 59 kb/d lower than October’s 2020 production of 1,214 kb/d. Production over the past two years has been on a plateau but according to this source production will be up for the next two months because:
“Well completion, which is the process needed to prepare a well for production, was at 85 in June and 83 in July, above the level needed to keep production stable.
“Next month we ought to be reporting another production increase,” Helms said.
Seventy wells were permitted in July. The state is now at above 18,000 active wells, an all-time high.”
Another source stated:
Helms said oil prices remain above $80 per barrel, with demand for oil exceeding supply. He called that a “sweet spot” for oil production.
“Oil and gas operators said if oil was to drop below $63 a barrel, they would reduce drilling and completions,” Helms said. “If it went over $86, they would significantly increase. We’re in the $80s, which means slow growth.”
Helms said that’s been the story in North Dakota for some time.
“Now you’re seeing it in all the basins,” Helms said.
Helms said New Mexico saw its oil and gas production drop by about three percent in June.
In 2019, ND was averaging 93 b/d from each well. For June 2023, well production has fallen to a low of 66 b/d/well.
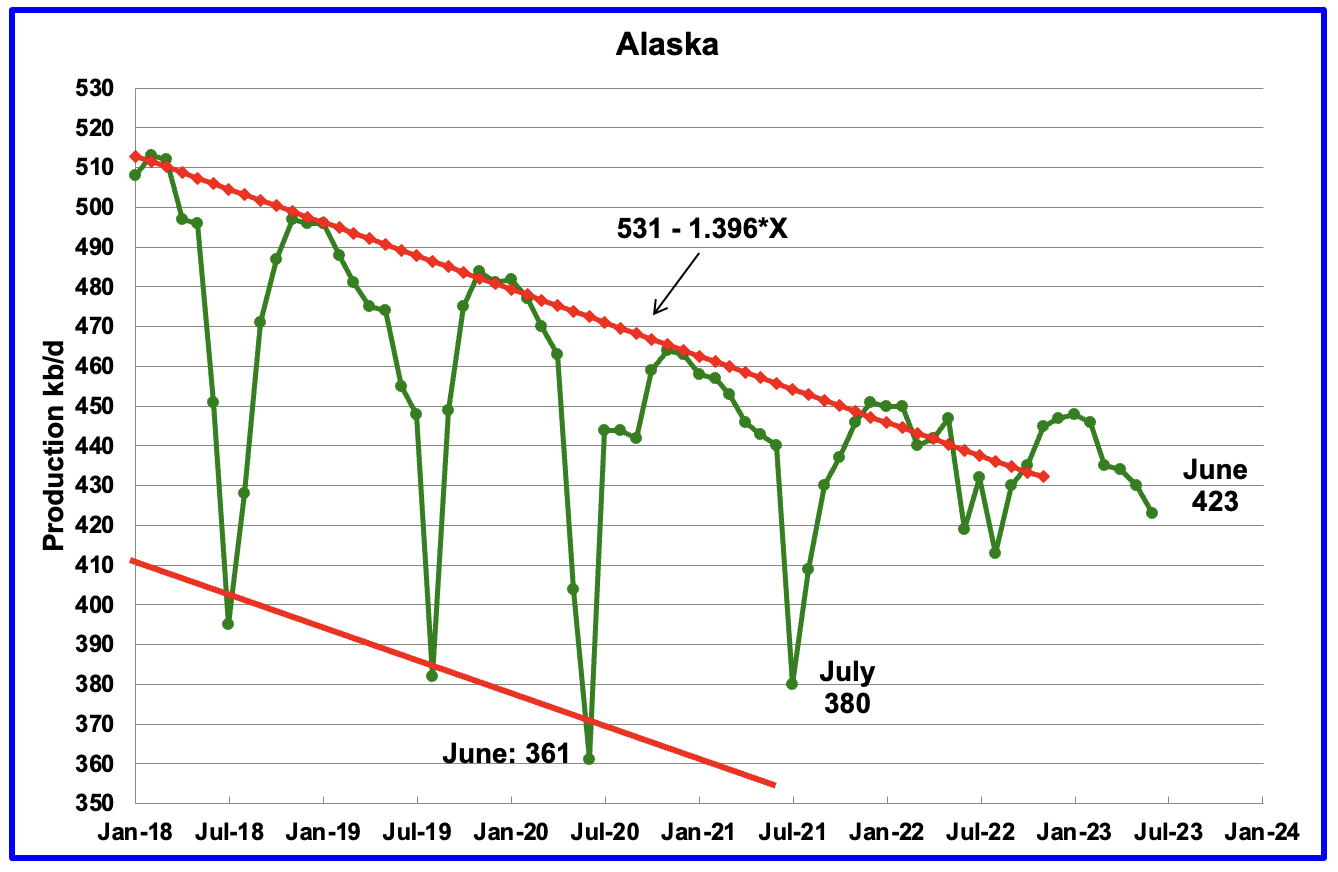
Alaska?s June output decreased by 7 kb/d to 423 kb/d. Production in 2023 is deviating from the down trend line of previous years due to the addition of a new oil field. Production YoY is up by 4 kb/d.
Two new projects which were scheduled for 2020 and 2021 which would add 20 kb/d and 40 kb/d respectively may be coming online after being delayed due to Covid.
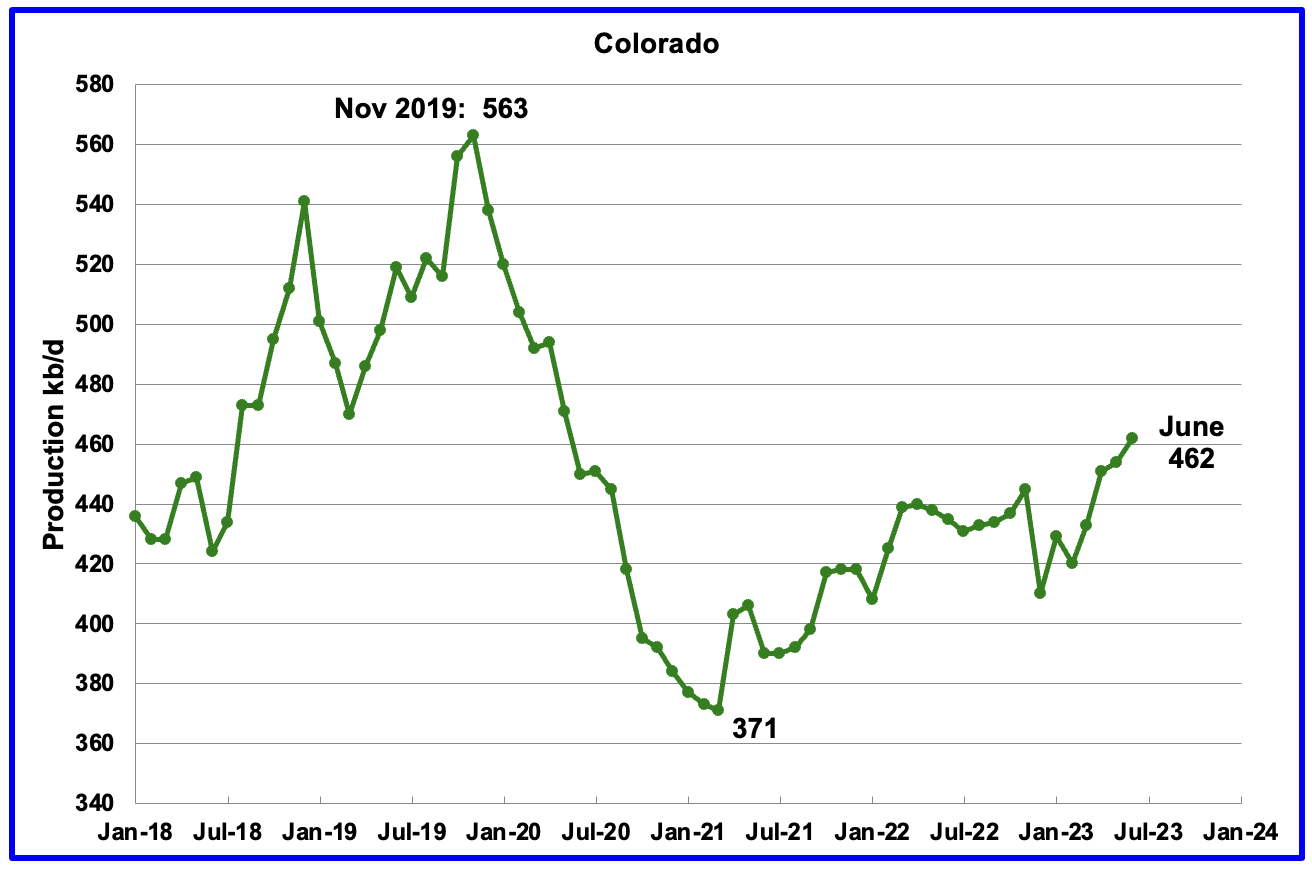
Colorado?s June production increased by 8 kb/d to 462 kb/d, a new post pandemic high.
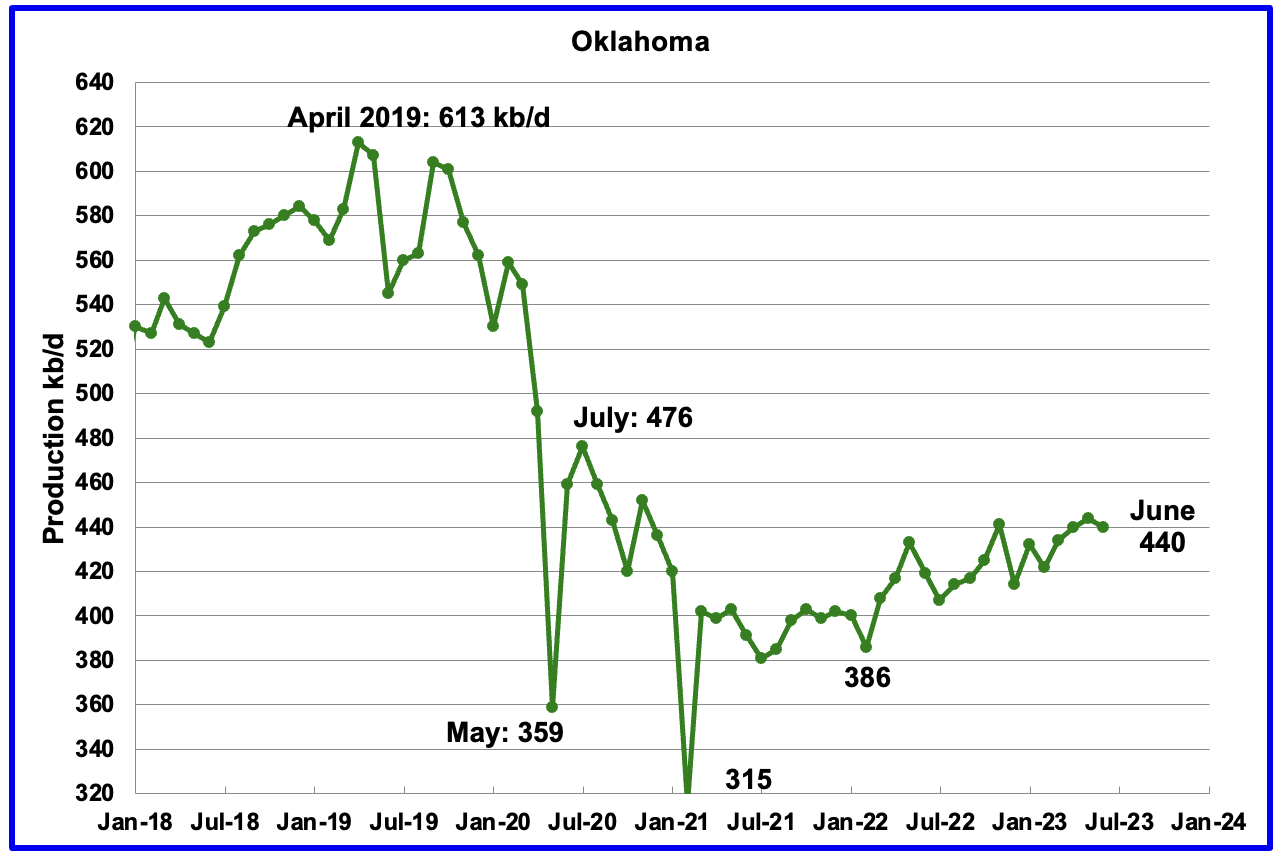
Oklahoma’s output in June decreased by 4 kb/d to 440 kb/d. Production remains 36 kb/d below the post pandemic July 2020 high of 476 kb/d.
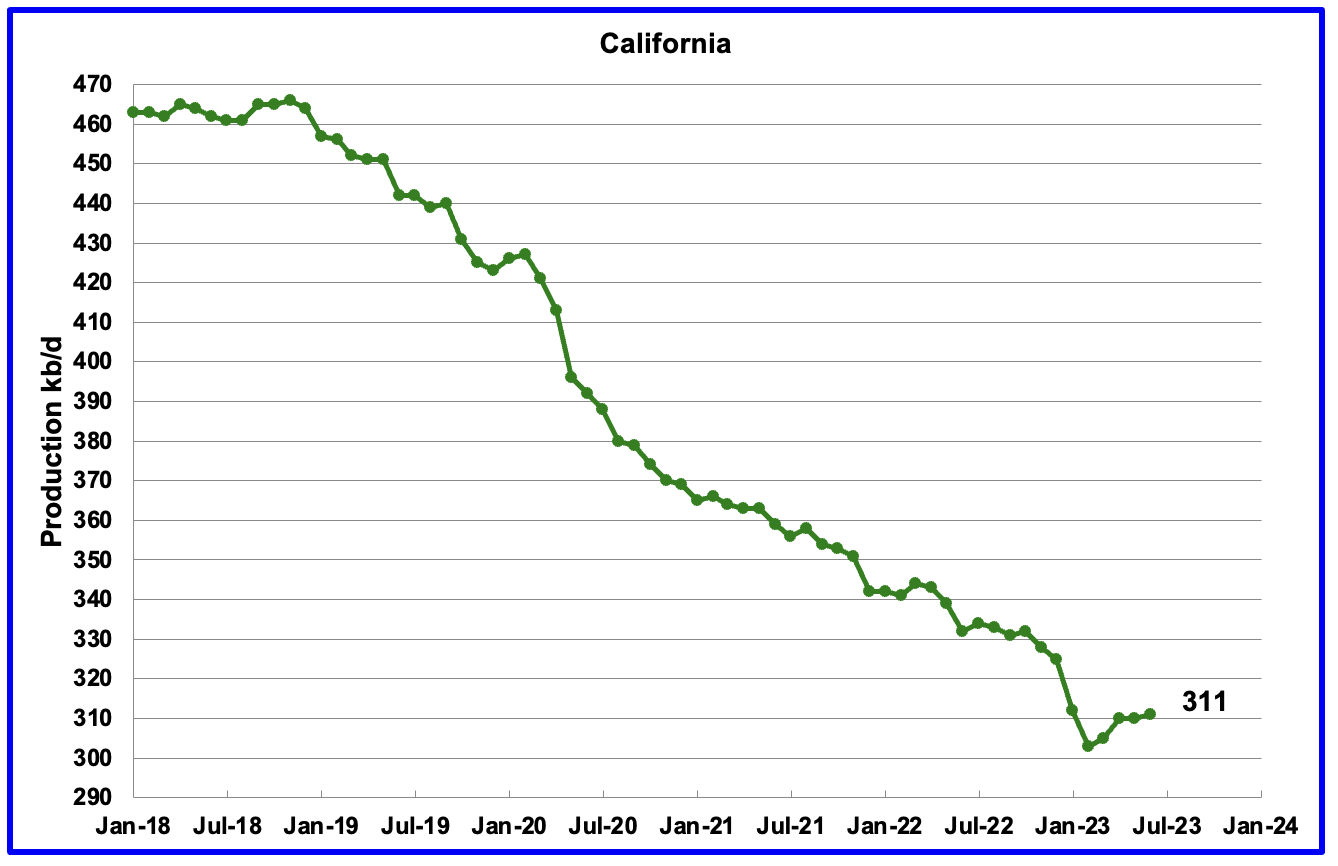
California?s overall slow output decline trend accelerated in January and February. However from March, through June production has risen. June output increased by 1 kb/d to 311 kb/d.
Wyoming’s oil production in October and November 2022 reached a post pandemic high of 270 kb/d. June’s oil production increased by 4 kb/d to 265 kb/d, 5 kb/d lower than November 2022. Production has been rebounding since February.
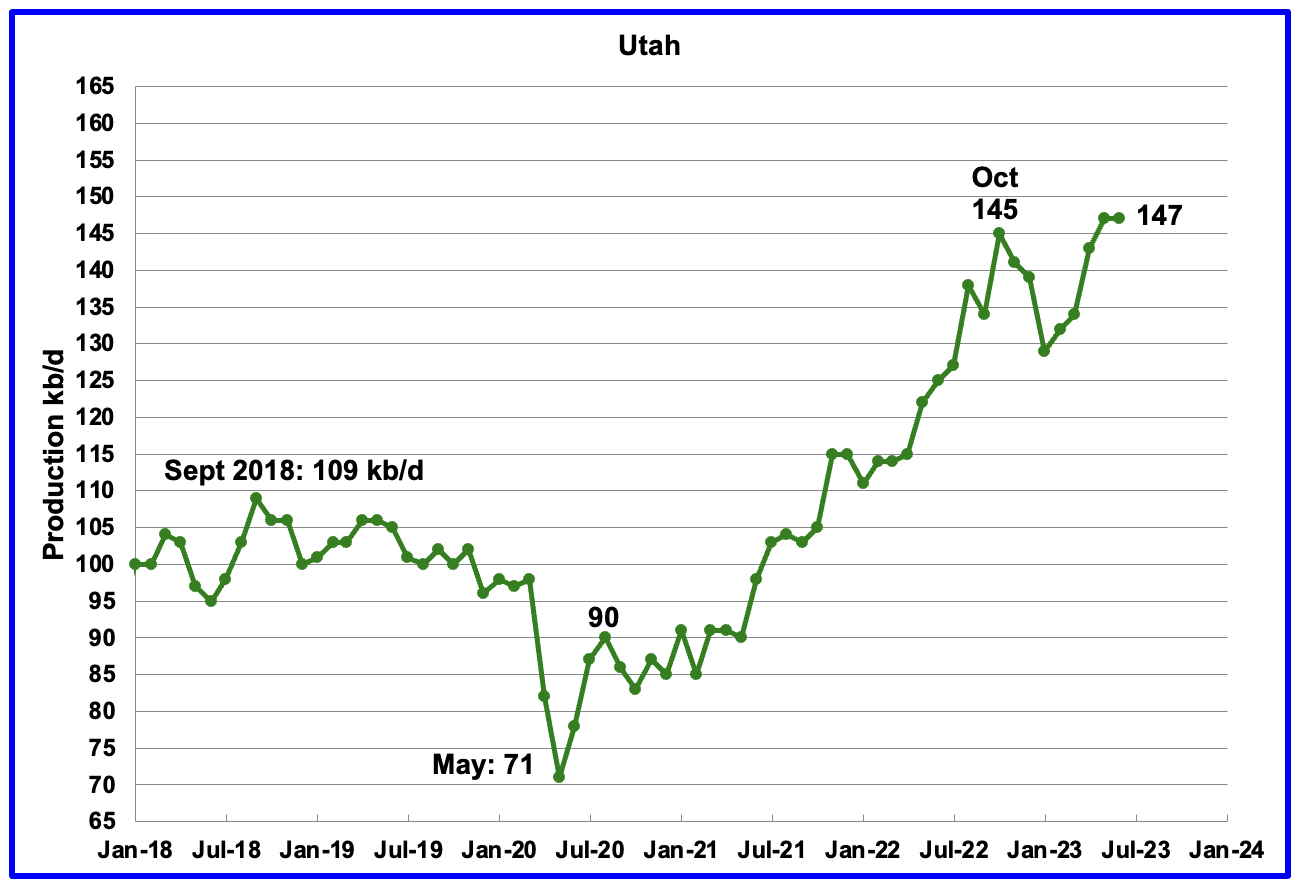
Utah’s oil production reversed its declining trend in February 2023. June’s production was unchanged at a high of 147 kb/d. For the first 4 months of 2023, Utah had 7 rigs operating. Since May the number of operational rigs has bounced between 8 and 9, which may account for the increased production.
The increased production is coming from the Uinta basin .
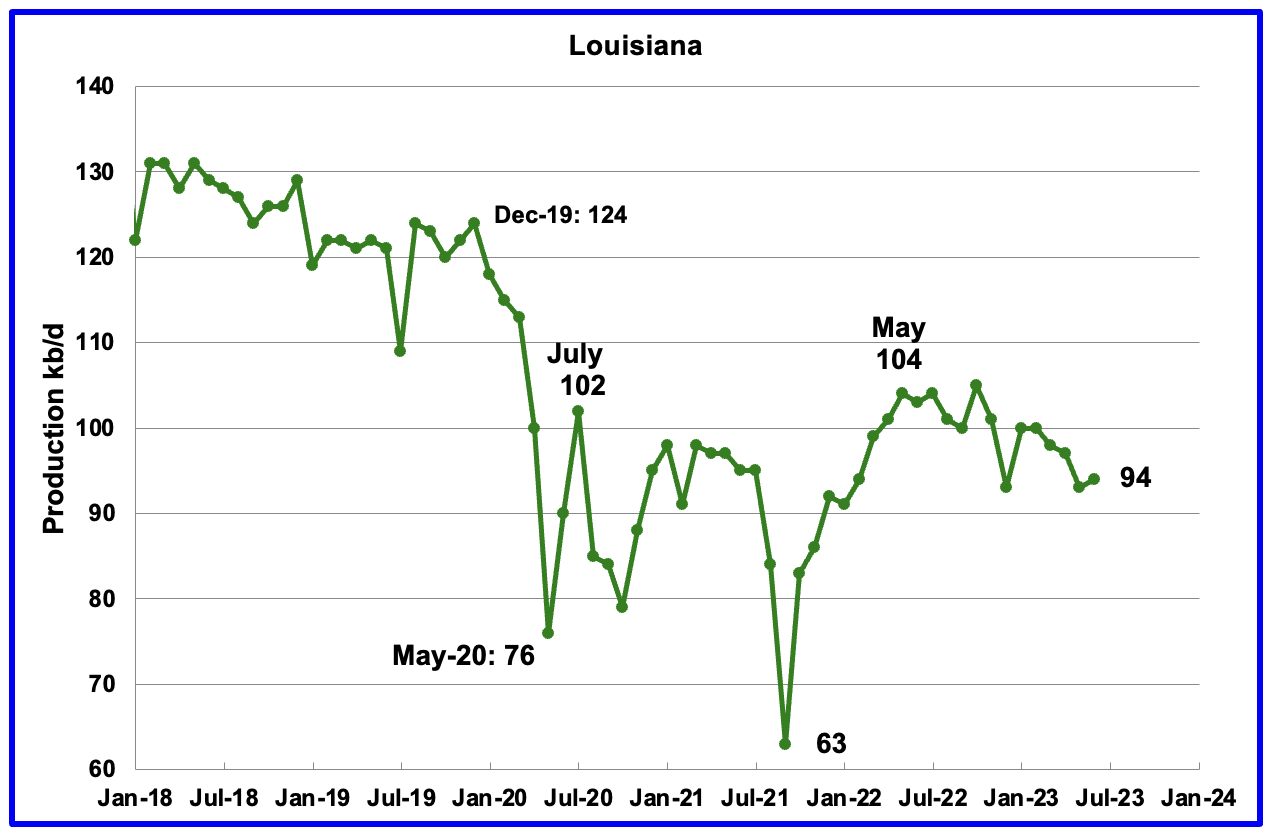
Louisiana’s output rose from the low of 63 kb/d in September 2021 to 104 kb/d in May 2022. Since then output has entered a slow declining phase. June’s production rose by 1 kb/d to 94 kb/d and is 10 kb/d lower than May 2022.
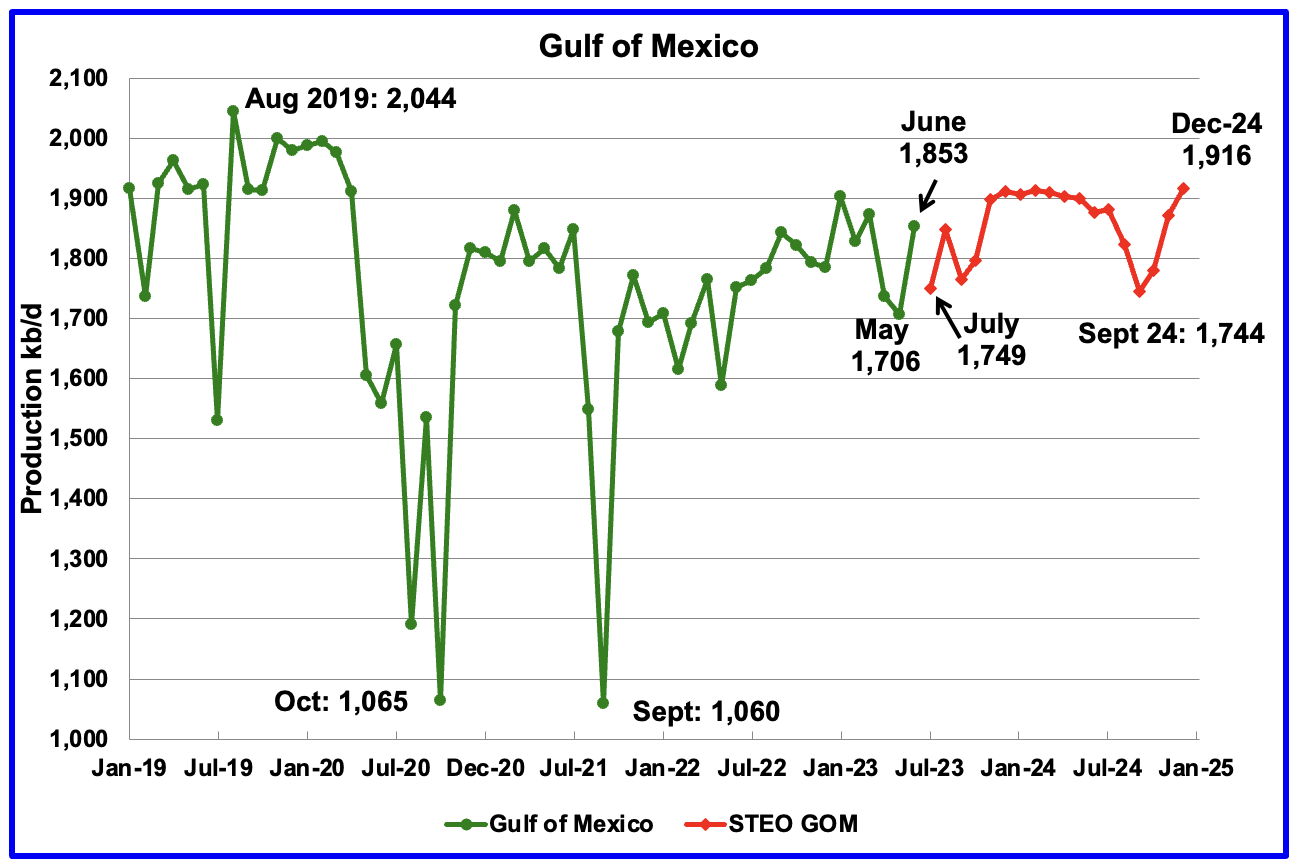
GOM production rose by 147 kb/d in June to 1,853 kb/d.
The August 2023 STEO projection for the GOM output has been added to this chart and it projects that output in July 2023 will drop by 104 kb/d to 1,749 kb/d.
The June spike to 1,853 kb/d could be a reasonable estimate since Shell announced that the Vito platform had begun production on February 15, 2023. Also according to this source Mad Dog 2 began production in April 2023.
It is not known if the GOM decline shown for August 2023 is related to extensive maintenance or potential hurricane activity.
A Different Perspective on US Oil Production
In this section US production is broken down into two parts, the Big Two, Texas and New Mexico, and the remaining states, The Rest.
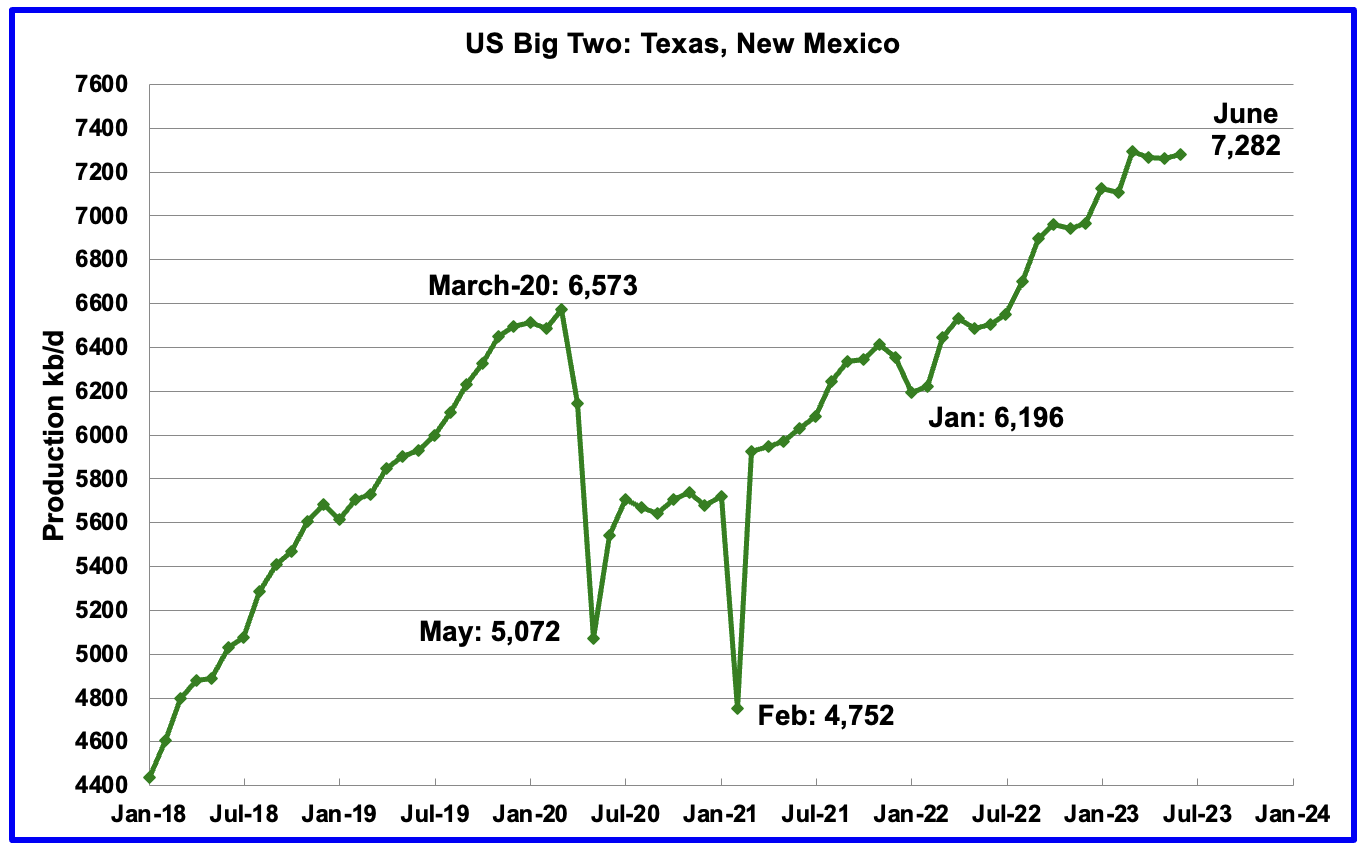
The Big Two states’ combined oil output for Texas and New Mexico.
June’s production in the Big Two states increased by a combined 21 kb/d to 7,282 kb/d with Texas adding 58 kb/d while New Mexico dropped by 37 kb/d.
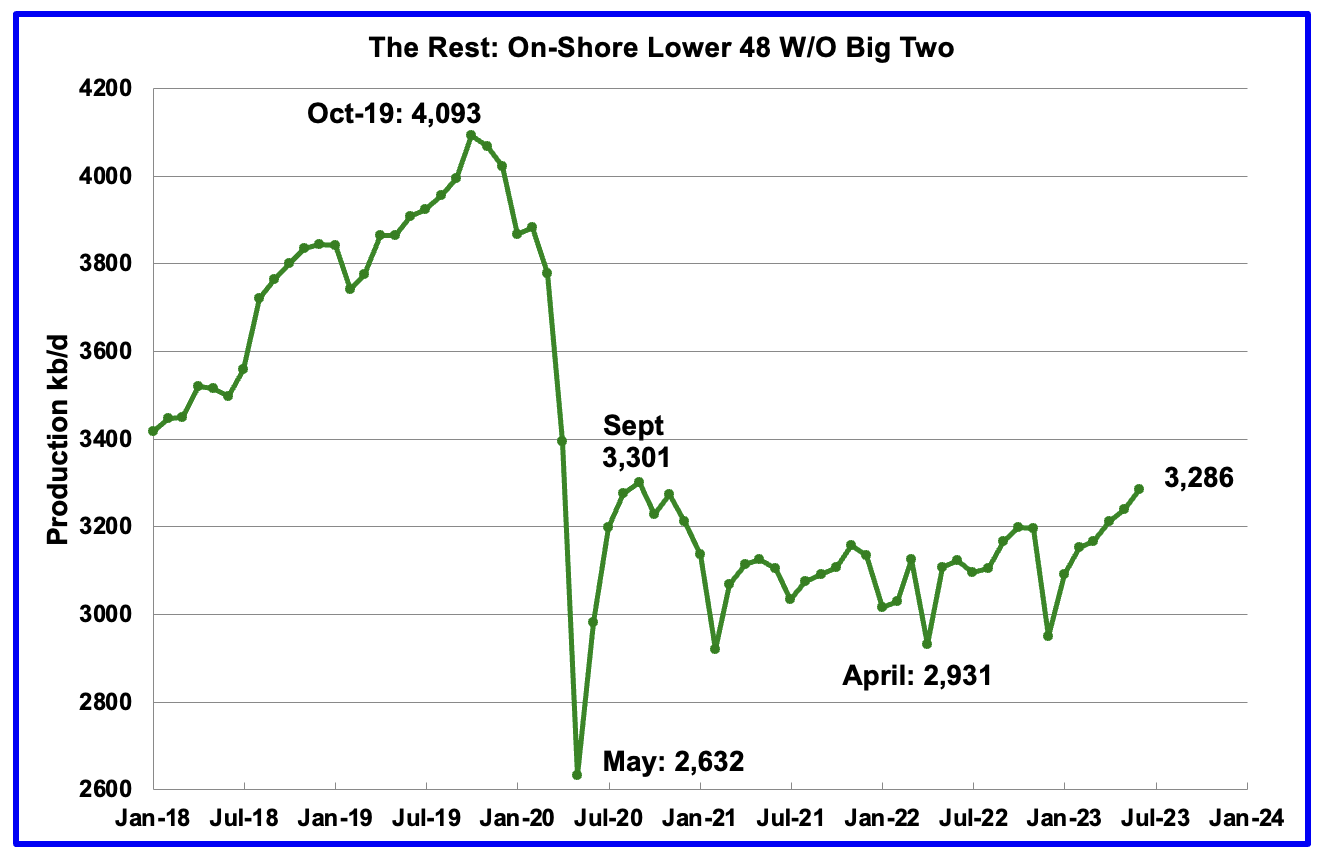
Oil production by The Rest
June’s production in The Rest rose by 46 kb/d to 3,286 kb/d. From May 2021 to April 2023, oil production in The Rest has been range bound between 3,000 kb/d and 3,200 kb/d. However May and June are the first months in which output broke above 3,200 kb/d primarily due to small YoY increases in Utah, Colorado, Oklahoma and North Dakota. Of the 46 kb/d increase in June, 37 kb/d came from North Dakota.
The main takeaway from The Rest chart is that current production is 807 kb/d below the high of October 2019 and this appears to be a permanent loss that will never be recovered.
To put June’s production increase in perspective, here are the three biggest components.
- GOM 147 kb/d. Note that GOM production is expected to drop over the next few months.
- North Dakota 37 kb/d
- Big Two 21 kb/d.
- Total 205 out of 207.
WTI
WTI has been on fire since Saudi Arabia implemented its lollipop cut of 1 Mb/d on July 1. A golden cross pattern occurred in late August which added more fuel to the fire.
Weekly Rig and Frac Spread Count
A high of 572 Hz oil rigs was reached in the week ending November 25, 2022. In the week ending Sept 1, 2023 the number of rigs was unchanged at 463 and is down 109 from the November high of 572.
In the week ending September 1, Permian rigs decreased by 2 to 305 and Texas rigs were down 3 to 256. Specifically for the Permian, Texas was down 2 while New Mexico was flat at 101. Note that the general trend for rigs in the Permian is a slow decrease since the April high and is currently 40 fewer than the 345 rigs operating on April 28, 2023.
In April 2023, WTI was over $80/b. Now that WTI is back over $80/b, will the decreasing rig count trend reverse?
Since January 2022, the frac spread count has wandered between 250 and 300 fracs per week. For all of 2022 the average weekly frac count was 280. However in the last week of August and early September, the frac count dropped below 250.
For the week ending September 1, the frac count dropped by 2 to 244 and is down 56 from the high of 300 in November 2022. The current count is significantly lower than the 2022 average of 280 frac spreads per week.
Note that these 244 frac spreads include both gas and oil spreads.
Frac Spreads by County
Above is the Frac Spread count by Basin and County for the week July 22 to July 28. Only those counties with 5 or more frac spreads are shown.
I have been working with the frac spread data published by this site . The CSV data they publish appears to be about 5 to 6 weeks delayed. While data for later weeks is there, it appears to be incomplete. For the week July 22 to July 28, the official frac count reported for that week was 268. This analysis is showing 271. This leads me to think that the analysis is reasonably correct.
A few weeks back I was concerned that Midland frac data was not appearing in the database. For this week, data for Midland county has reappeared.
The largest number of frac spreads continue to operate in New Mexico’s Lea and Eddy counties. However, under New Mexico, a new county showed up, Sandoval, which is in the NW of New Mexico and not in the Permian. It is producing close to 5 kb/d and am wondering if this is a new drilling/oil area.
One thing to note in this chart is that the NG frac spreads only account for 20% of all spreads. Earlier comments from other sources were indicating that NG spreads represented 50% of all spreads. Could this lower percentage be associated with the lower price for NG today vs one year ago?
Permian Basin County Charts
This monthly Permian section is being added to the US report because of a range of views on whether Permian production will continue to grow or will peak in the next year or two.
The issue was brought into focus recently by the report by Goehring and Rozencwajg which indicated that a few of the biggest Permian oil producing counties were close to peaking or past peak.
This section will focus on the four largest oil producing counties in the Permian, Lea, Eddy, Midland and Martin. It will track the oil and natural gas production and the associated Gas Oil Ratio ((GOR)) on a monthly basis.
The data is taken from the state’s government agencies for Texas and New Mexico . Typically the data for the latest two months is not complete and is revised upward as companies submit their updated information.
Of particular interest will be the charts which plot oil production vs GOR for a county to see if a particular characteristic develops that indicates the field is close to entering the bubble point.
While the GOR metric is best suited for characterizing individual wells, counties with closely spaced horizontal wells may display a behaviour similar to individual wells. For further information on the bubble point and GOR, there are a few good thoughts on the intricacies of the GOR in an earlier POB comment .
This chart shows oil production from the eight largest counties in the Permian. In the New Mexico Permian, there are two counties Lea and Eddy. The remaining six are in Texas; Midland, Martin, Reeves, Loving, Howard and Upton. The graphs are updated to June.
The red markers show production from the two NM counties while the blue markers show total production for NM from the EIA monthly production report. The EIA must have some correction factors to increase NM’s output from NM’s official site. The brown markers show output from the six biggest Permian counties in Texas.
In the August update for the Texas 6, the previous June production data was updated by 1% for January and 2% for February, March and April.
New Mexico Permian
Rigs are moving from Eddy county to Lea county. Over the last 10 weeks drilling activity has increased in Lea county and dropped in Eddy.
Over the last three months, oil production is falling faster than NG production in Lea county.
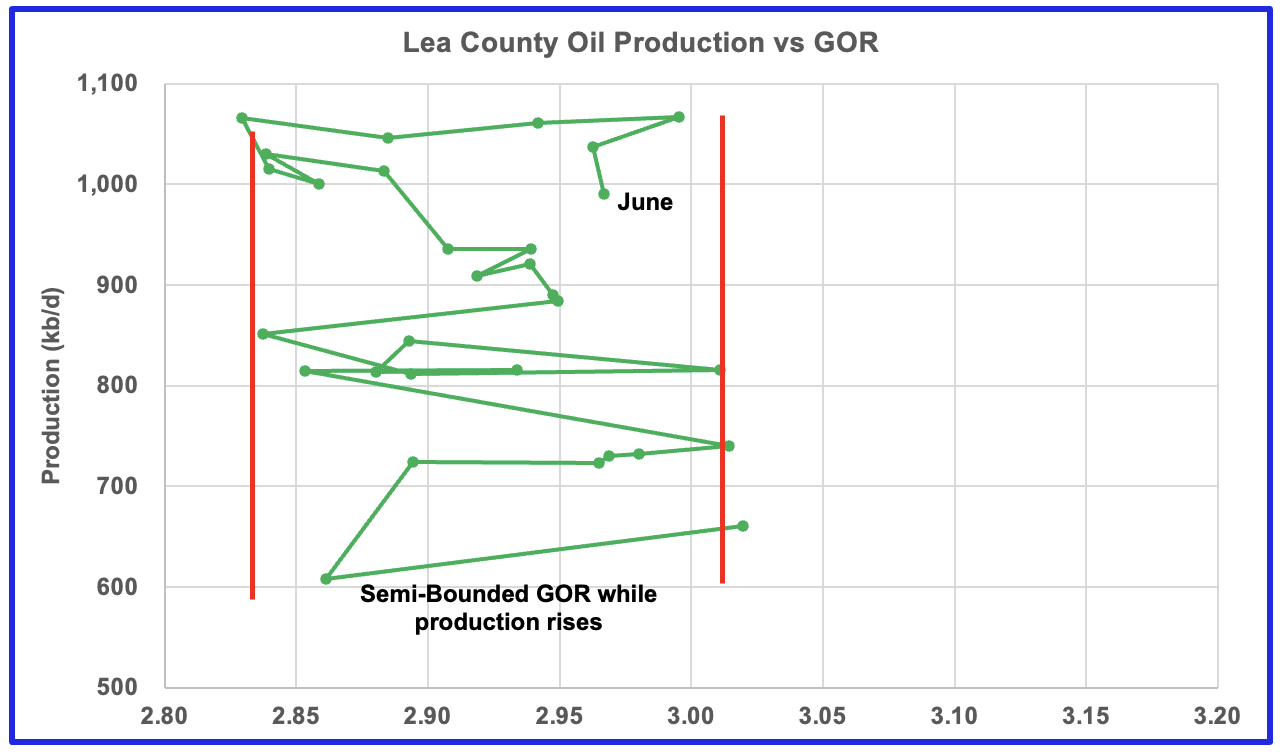
After much zig zagging, production stabilized above 1,000 kb/d and the GOR hints at an increasing trend while production stabilizes over 1,000 kb/d. The data for the last two data points, May and June, is incomplete.
This pattern of a zig zagging GOR within a semi-bounded GOR while oil production increases to some stable level and then moving out to a higher GOR to the right has shown up in a number of counties. See three cases below.
The Eddy county GOR pattern is similar to Lea county except that Eddy has broken out from the semi bounded range. Does the breakout indicate that most of the wells in this county have entered the bubble point phase?
Texas Permian
Drilling activity dropping in both Midland and Martin county has dropped over the past 6 weeks.
Natural Gas production increasing while oil production drops in Midland county
GOR breaking out to higher values and oil production dropping. Has Midland entered the bubble phase?
Similar GOR pattern to Martin county. Note that Midland county is adjacent to Martin county.
Are the oil production vs GOR charts above exhibiting characteristics indicating that three of the four counties in the Permian are in the bubble point phase and are close to or past their peak?
Biggest Oil producing County in the Eagle Ford
This is the GOR vs oil production for Karnes county but the GOR is still within its typical range while production is dropping. This may indicate that Karens county wells have not entered the bubble point phase, yet.
Drilling activity in Karnes county has been dropping since April.
Drilling Productivity Report
The Drilling Productivity Report (DPR) uses recent data on the total number of drilling rigs in operation along with estimates of drilling productivity and estimated changes in production from existing oil wells to provide estimated changes in oil production for the principal tight oil regions.
The August DPR report forecasts production to September 2023 and the following charts are updated to September 2023. The DUC charts and Drilled Wells charts are updated to July 2023.
Above is the total oil production projected to September 2023 for the 7 DPR basins that the EIA tracks. Note that DPR production includes both LTO oil and oil from conventional wells.
The DPR is projecting that oil output for September 2023 will d ecrease by 19 kb/d to 9,415 kb/d. This is the second drop in a row since the July peak of 9,449 kb/d. The drop is due to the reduced drilling and completions that began earlier this year.
The August DPR production report increased/revised production over the last few months by roughly 30 kb/d to 35 kb/d over the July report. For instance, August output in the July report, red markers, was revised up by 35 kb/d from 9,399 kb/d to 9,434 kb/d.
According to the EIA DPR report, Permian output continued to roll over in September. It is expected to decrease by 13 kb/d to 5,799 kb/d. The last six months of production data clearly shows a slowing trend in monthly production increases which now has turned to decreases, similar to the trend above for the total oil production in the DPR regions. Note the production difference with the following LTO chart
September’s output is 882 kb/d higher than the pre-pandemic high 4,917 kb/d.
EIA LTO report shows no sign of production rolling over. Which one is correct?
During July , 460 wells were drilled and 460 were completed in the Permian. (Note that July is the latest month for DUC information). The completed wells added 371 kb/d to July’s output for an average of 808 b/d/well. The overall decline was 372 kb/d which resulted in a net decrease for Permian output of 1 kb/d. Of the 460 completed wells in July, 461 would have been required to offset the decline.
This chart shows the average first month total production from Permian wells tracked on a monthly basis. The total monthly production from the newest Permian wells in September was 367 kb/d. Production continues at close to the 370 kb/d level but hinting at a dropping trend. Production has been close 370 kb/d for the last five months.
Output in the Eagle Ford basin has been in a generally flat trend since March 2021, fluctuating over a range of between 1,050 kb/d to 1,150 kb/d. September’s forecast projects output is expected to decrease by 11 kb/d to 1,109 kb/d.
At the beginning of the year 2023, 68 rigs were operating in the Eagle Ford basin. The rig count began to drop in mid March to 60 and dropped further to 50 in August .
The DPR forecasts Bakken output in September will be 1,210 kb/d an increase of 4 kb/d over August. September production is 35 kb/d lower than the post pandemic peak of 1,245 kb/d in October 2020.
Output in the Niobrara continues to increase slowly. August’s output increased by 3 kb/d to 669 kb/d.
Production increased due to the addition of rigs into the basin but stabilized at 16 ± 1 rigs in March and April. However in August and September the rig count dropped to 14.
DUCs and Drilled Wells
The number of DUCs available for completion in the Permian and the four major DPR oil basins has fallen every month since July 2020 and continued to decrease in July. July DUCs decreased by 11 to 2,552. Of the 11 DUCs decrease, 10 came from the Bakken.
July Permian DUCs were unchanged at 856, a first.
In these 4 basins, 727 wells were drilled while 738 were completed for a net decrease of 11 DUCs in July. Both drilled wells and completions are down from higher levels in late 2022 and early 2023.
In the Permian, the monthly completion rate has been showing signs of slowing since the July 2022 high of 525.
In July 2023, 460 wells were completed while 460 new wells were drilled. The gap between completed and drilled wells in the Permian has now been reduced to zero, a first.
The Permian, as of July, had 856 DUCs remaining and the completion rate was 460 wells/mth. This means that the current cycle time between drilling and completions is 1.86 months or 57 days.
Editor's Note: The summary bullets for this article were chosen by Seeking Alpha editors.
For further details see:
U.S. June Oil Production Rises On GOM Jump