USOI - U.S. May Oil Production Little Changed
2023-08-04 06:25:00 ET
Summary
- U.S. May oil production decreased by 15 kb/d to 12,662 kb/d.
- U.S. shale producers slashed drilling and well completions in the second quarter, cutting demand for equipment and services.
- Permian monthly production increments have been falling since March.
A guest post by Ovi
All of the Crude plus Condensate (C + C) production data for the US state charts comes from the EIA's Petroleum Supply monthly PSM which provides updated information up to May 2023.
U.S. May oil production decreased by 15 kb/d to 12,662 kb/d, an atypical small change. The small change is primarily due to the upward revision of April output from 12,615 kb/d to 12,677 kb/d, an increase of 62 kb/d.
Most of the states had small production changes except for New Mexico and Texas.
The dark blue graph, taken from the July 2023 STEO, is the forecast for U.S. oil production from June 2023 to December 2024. Output for December 2024 is expected to be 13,237 kb/d which is 237 kb/d higher than the November 2019 peak of 13,000 kb/d. From May 2023 to May 2024, production is forecast to increase by 28 kb/d .
The July STEO forecast for May production was 12,561 kb/d, low by 101 kb/d.
The red OLS line from June 2020 to May 2023 indicates a monthly production growth rate of 59.8 kb/d/mth. Clearly, the growth rate going forward into the rest of 2023 and 2024, shown in the dark blue graph, is projected to be lower than the 59.8 kb/d/mth seen in the previous July 2020 to May 2023 period.
While overall US oil production decreased by 15 kb/d, the Onshore L48 had a production increase of 19 kb/d to 10,527 kb/d in May. The light blue graph is the STEO projection for output to December 2024 for the Onshore L48. From June 2023, to June 2024, little change in output is expected.
Oil Production Ranked by State
Listed above are the 10 states with the largest US oil production along with the Gulf of Mexico. These 10 states accounted for 83.3% of all U.S. oil production out of a total production of 12,662 kb/d in May 2023. Note that GOM MoM production is down more than overall U.S. production.
New Mexico's oil production for the second month has passed the GOM's production.
On a YoY basis, US production increased by 1,033 kb/d with the majority, 812 kb/d coming from Texas and New Mexico.
State Oil Production Charts
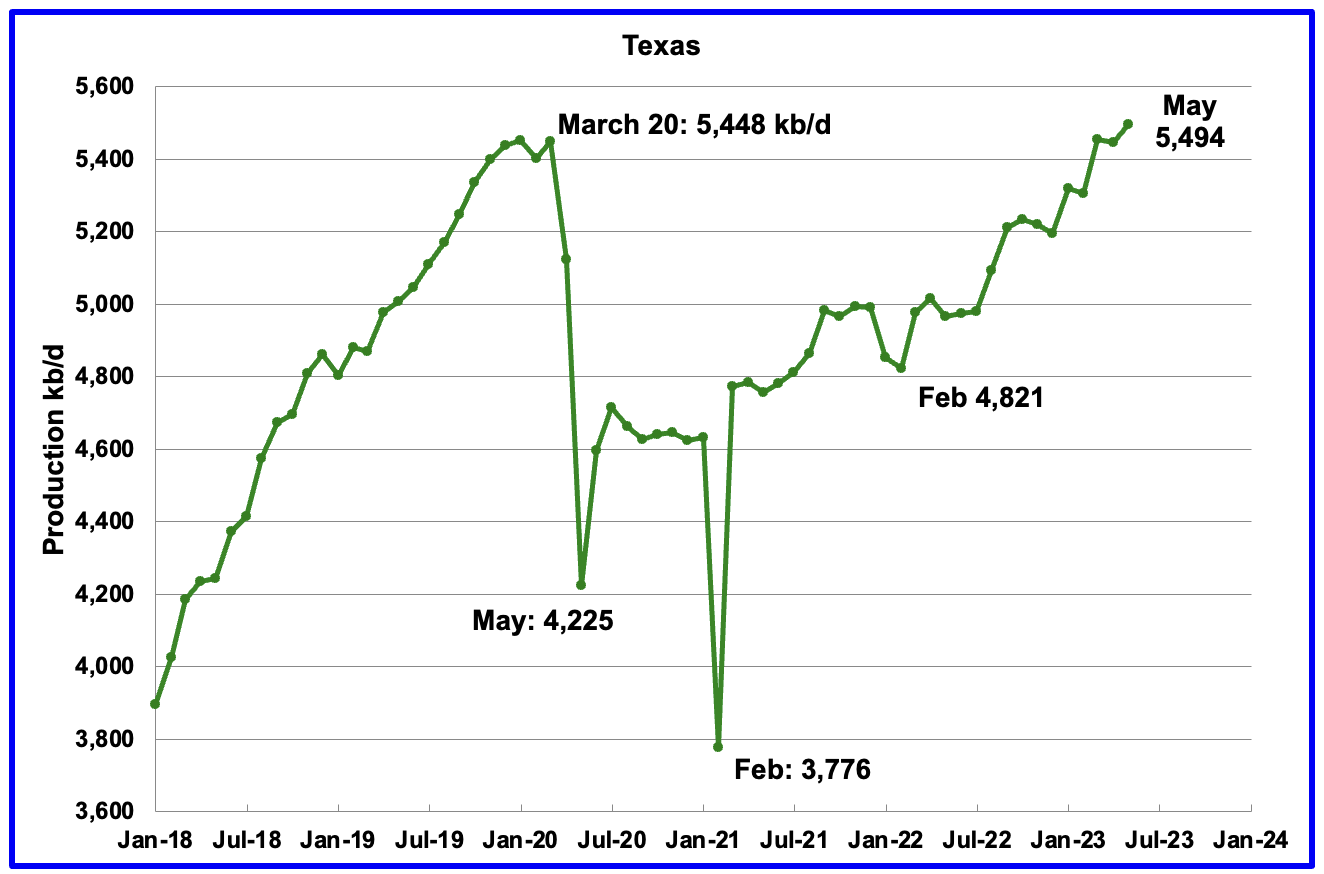
Texas production increased by 48 kb/d in May to 5,494 kb/d. May's output is 46 kb/d higher than the March 2020 high of 5,448 kb/d.
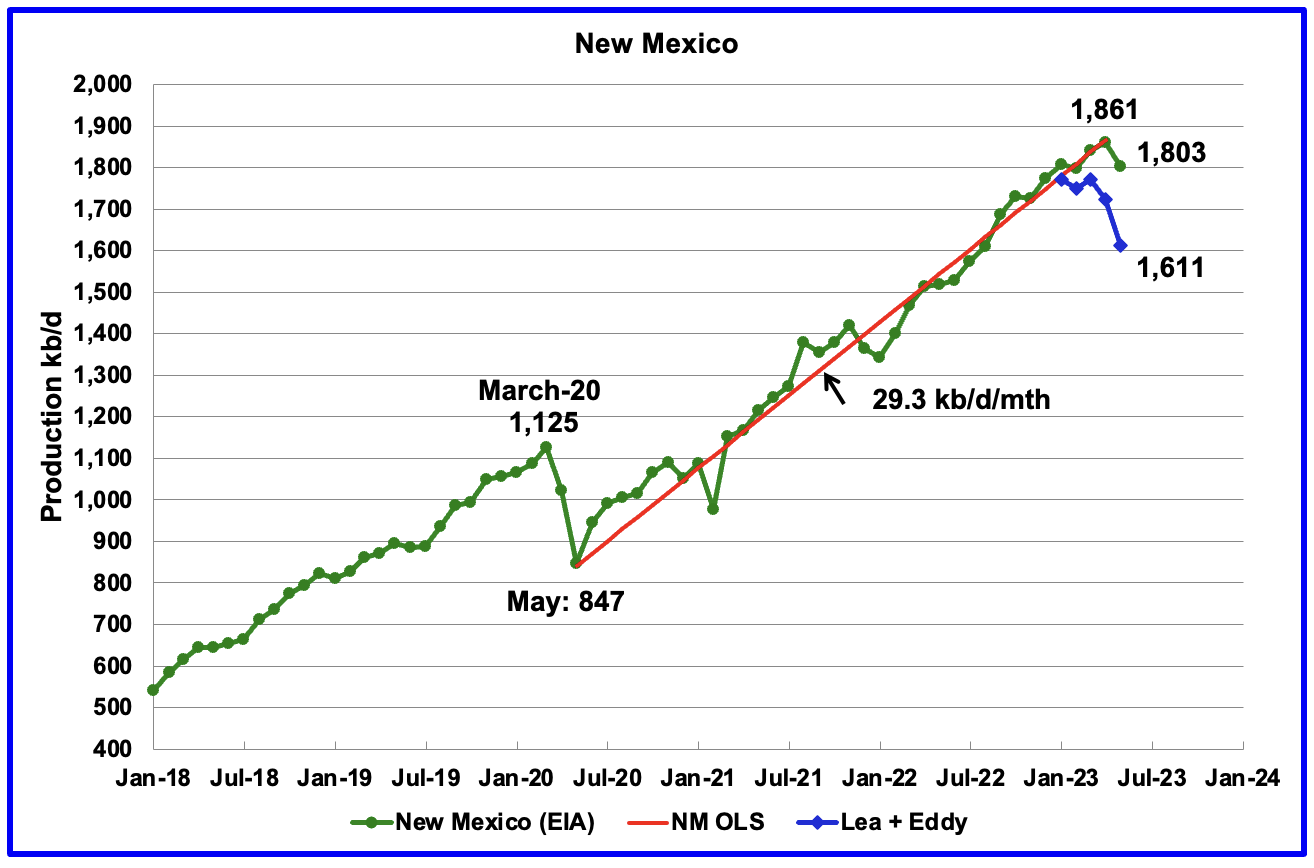
New Mexico's May production is the first significant decline since January 2022. May's production decreased by 58 kb/d to 1,803 kb/d.
Of the 1,803 kb/d, 1,611 kb/d came from the Lea and Eddy counties. The Lea and Eddy county production data for May is not complete and will be updated over the next three months. The first blue marker is January's total production from NM's Lea and Eddy counties. Their combined output was 1,772 kb/d compared with 1,808 kb/d for all of New Mexico, a difference 36 kb/d.
More production information from these two counties is reviewed in the new Permian section further down .
North Dakota's May oil production has begun to stabilize after being impacted by extreme cold weather in December. However May's increase was essentially flat. Output increased by 10 kb/d to 1,124 kb/d. Current production is little changed from January's 2021 production of 1,094 kb/d, a minimal increase of 30 kb/d. Production over the past two years has been on a plateau.
In 2019, ND was averaging 93 b/d from each well. For May 2023, production has fallen to a low of 65 b/d/well.
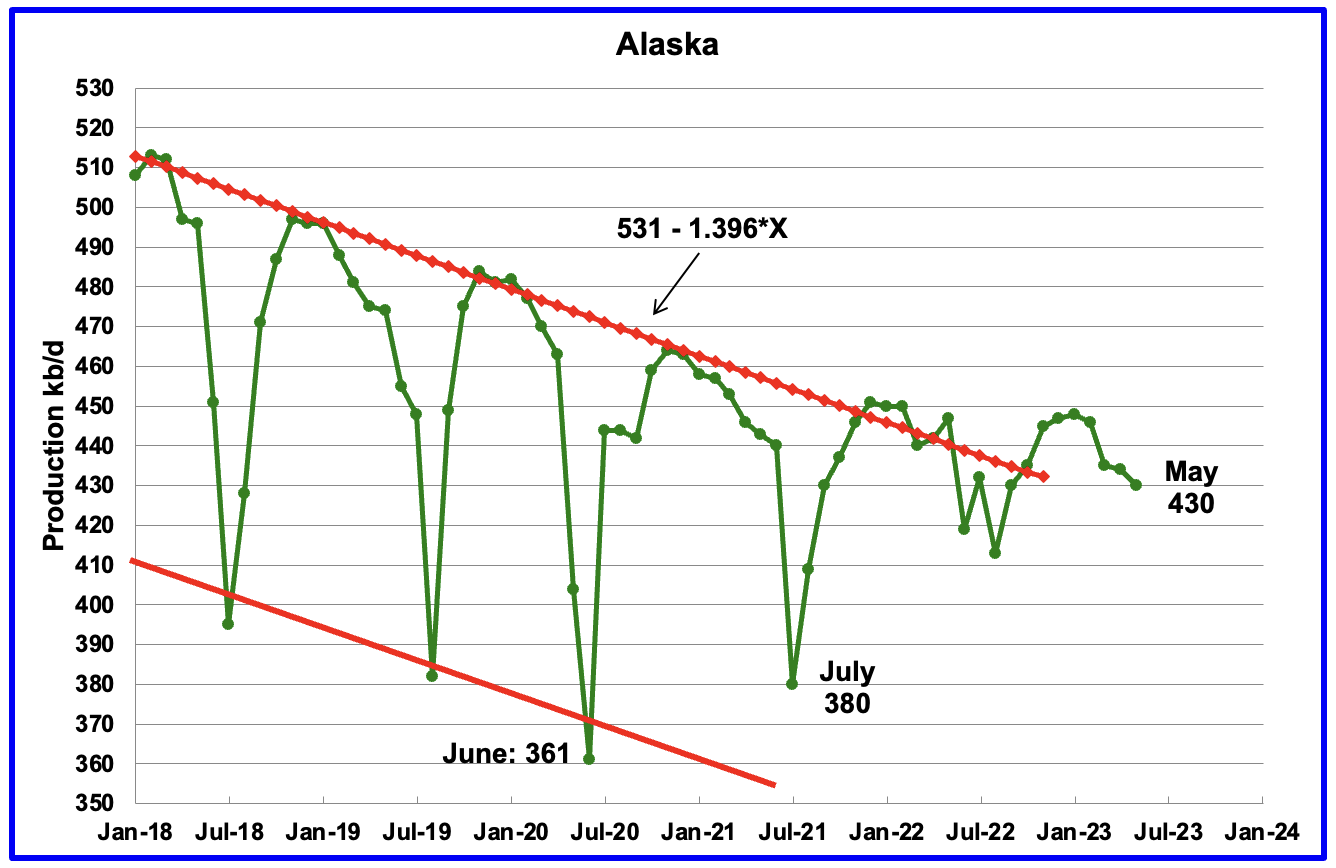
Alaska?s May output decreased by 4 kb/d to 430 kb/d. Production in 2023 is deviating from the down trend line of previous years possibly due to the addition of a new oil field. Production YoY is down by 17 kb/d.
Two new projects which were scheduled for 2020 and 2021 which would add 20 kb/d and 40 kb/d respectively according to the Frontiersman , may have been delayed due to Covid.
"A final investment decision in Pikka is expected in late 2020, which means spending for this project will be in the $3.38 billion estimate, but most will come in following years. Pikka will see initial production beginning in 2022 and full production at 120,000 b/d in 2024. Willow's investment decision will come later, with production beginning in 2025 or 2026, ConocoPhillips has said." First production at Pikka has been delayed to 2026
" Phase one is now expected to come onstream in 2026 and produce up to 80,000 barrels of oil a day. The project is expected to create more than 2,600 jobs during the construction phase and more than 500 jobs during operation."
An article in the Alaskabeacon states that increased development spending will add significantly to Alaska's output in the late 2020s.
"North Slope production is expected to hover around 500,000 barrels a day through 2027 and then rise a bit after then as new fields start up, Alaska Department of Natural Resources officials told the Senate Finance Committee in a hearing Wednesday morning.
That is a far cry from the more than 2 million-barrel-per-day peak achieved in 1988, but there is "good news" in the recent trend to flat production, John Boyle, the commissioner-designee for the department said as the beginning of the hearing.
Stability achieved to date on the North Slope is a major accomplishment "when you consider that these are legacy fields that are pushing 50 years old," Boyle said. Production has declined steadily since the peak."
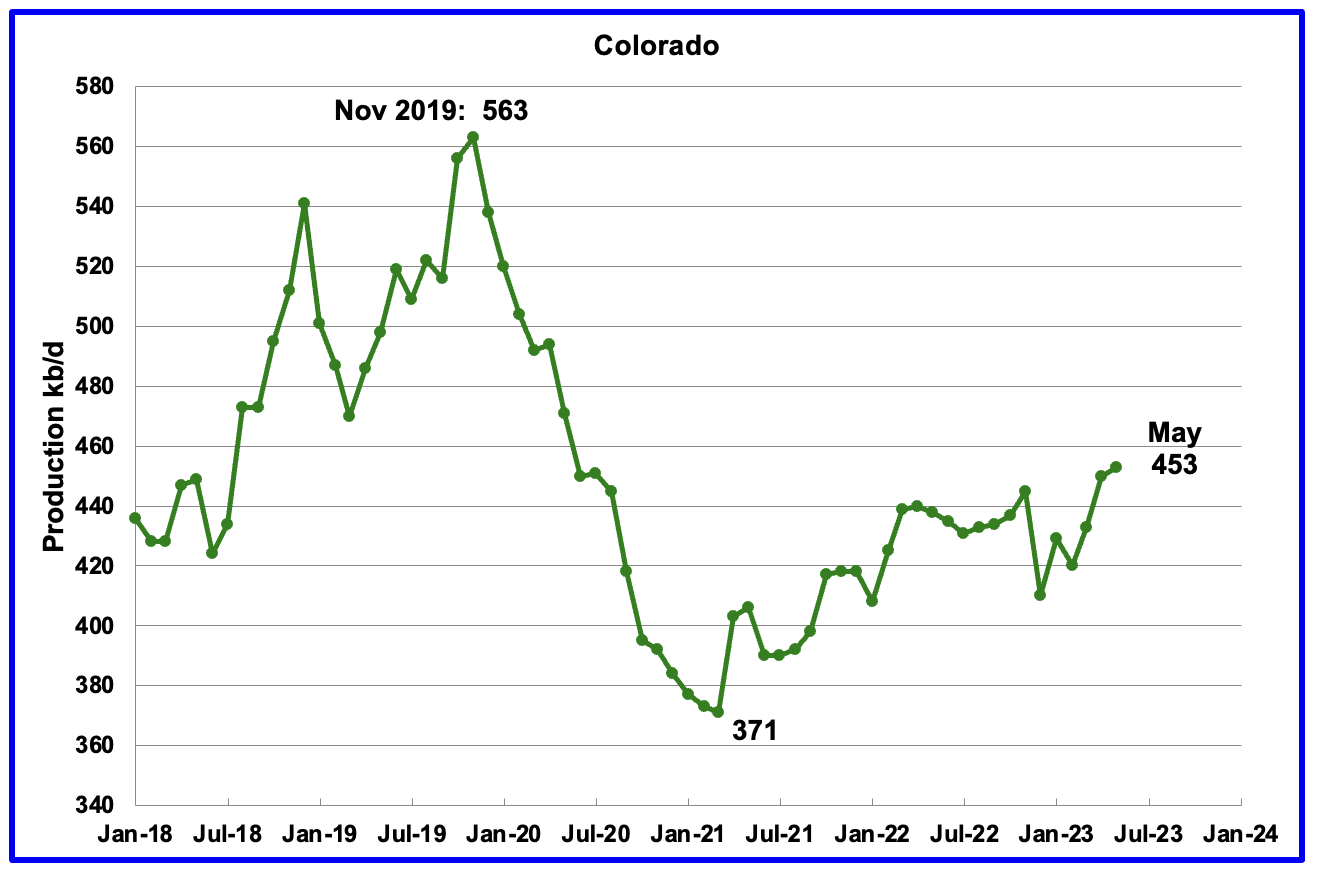
Colorado?s May production increased by 3 kb/d to 453 kb/d, a new post pandemic high.
Oklahoma's output in May rose by 4 kb/d to 445 kb/d. Production remains 31 kb/d below the post pandemic July 2020 high of 476 kb/d.
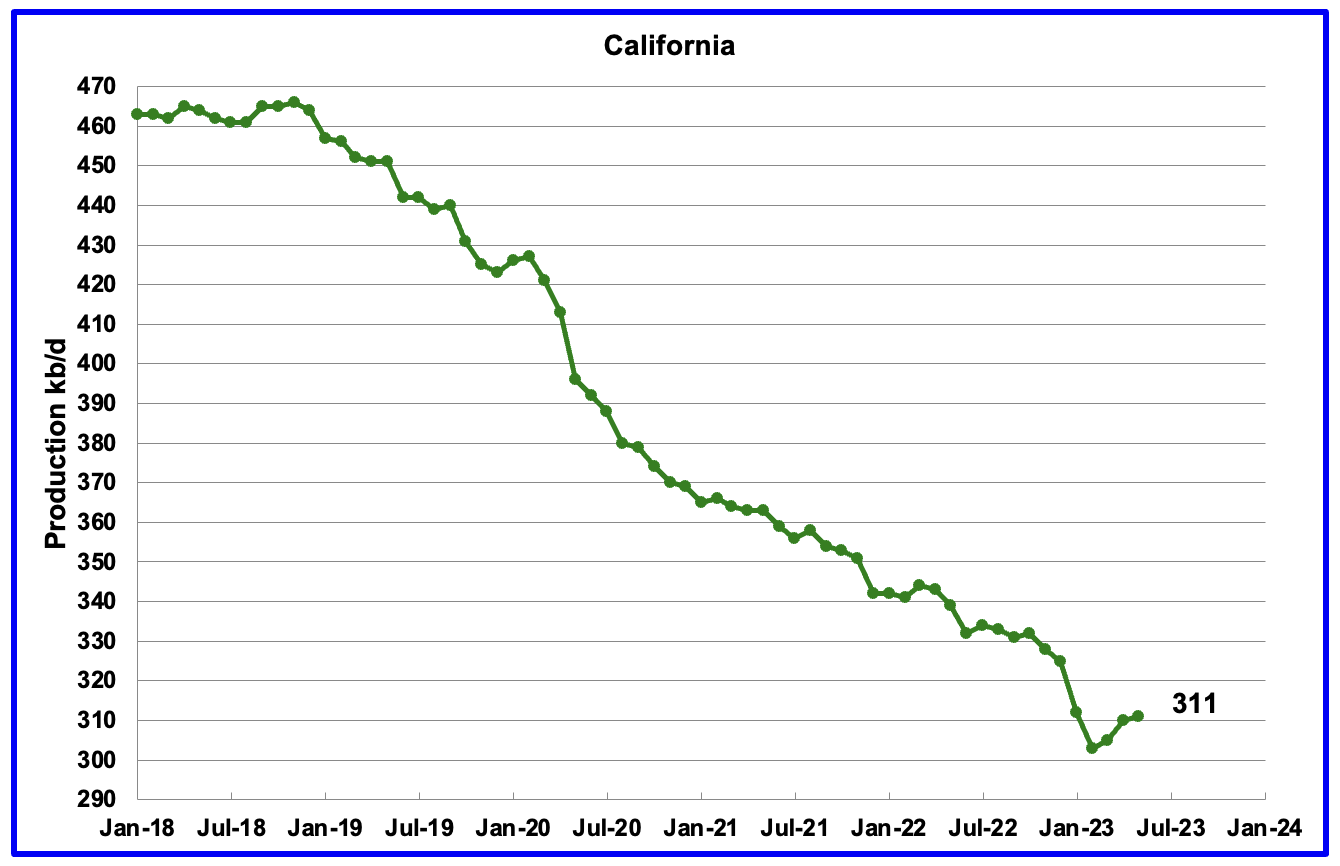
California?s overall slow output decline trend accelerated in January and February. However for March, April and May production rose. May output increased by 1 kb/d to 311 kb/d.
Wyoming's oil production in October and November 2022 reached a post pandemic high of 270 kb/d. May's oil production increased by 8 kb/d to 259 kb/d, 11 kb/d lower than November 2022.
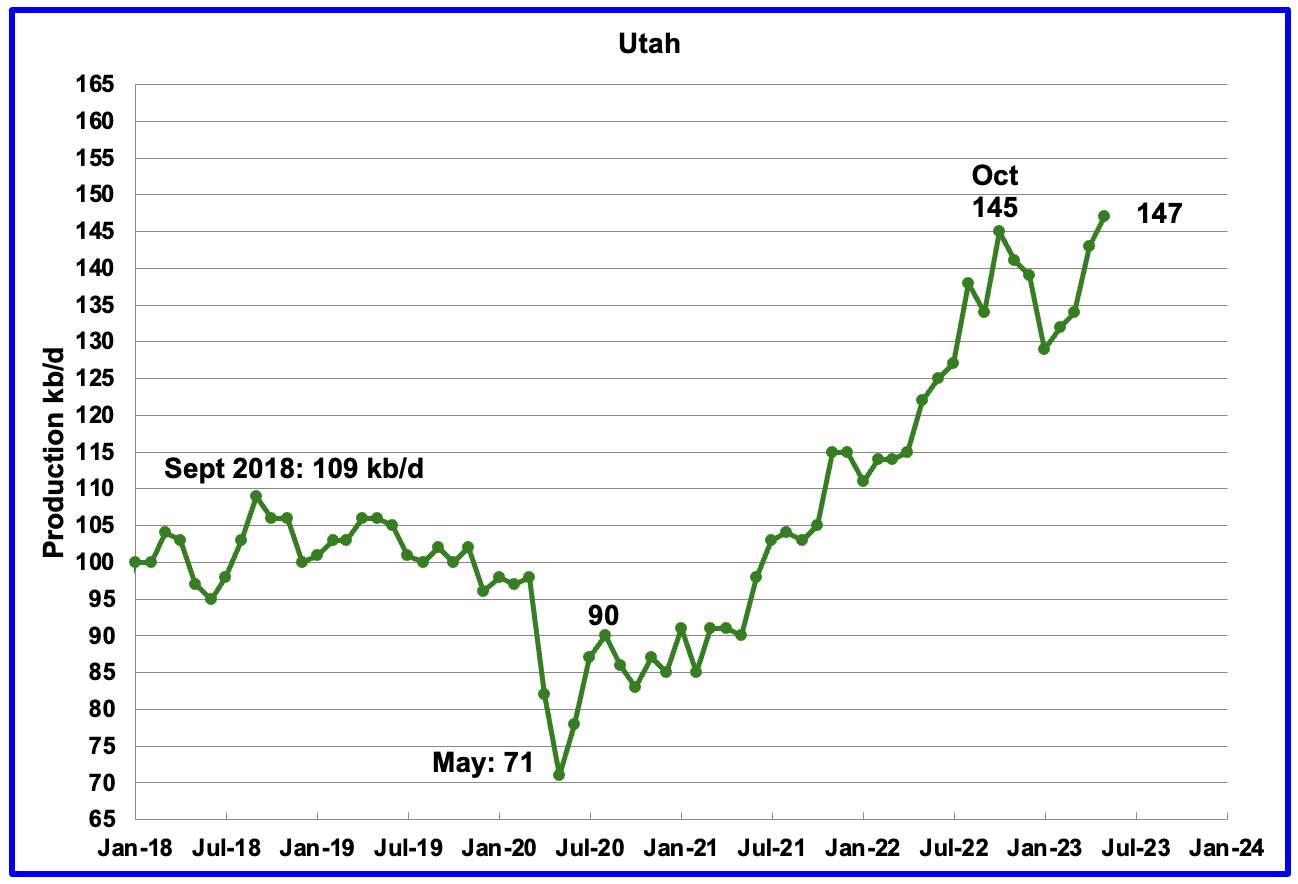
Utah's oil production reversed its declining trend in February 2023. May's production reached a new high of 147 kb/d. For the first 4 months of 2023, Utah had 7 rigs operating. Since May the number of operational rigs has bounced between 8 and 9, which may account for the increased production.
The increased production is coming from the Unita basin .
Louisiana's output rose from the low of 63 kb/d in September 2021 to 104 kb/d in May 2022. Since then output has entered a slow declining phase. May's production dropped by 3 kb/d to 93 kb/d and is 11 kb/d lower than May 2022.
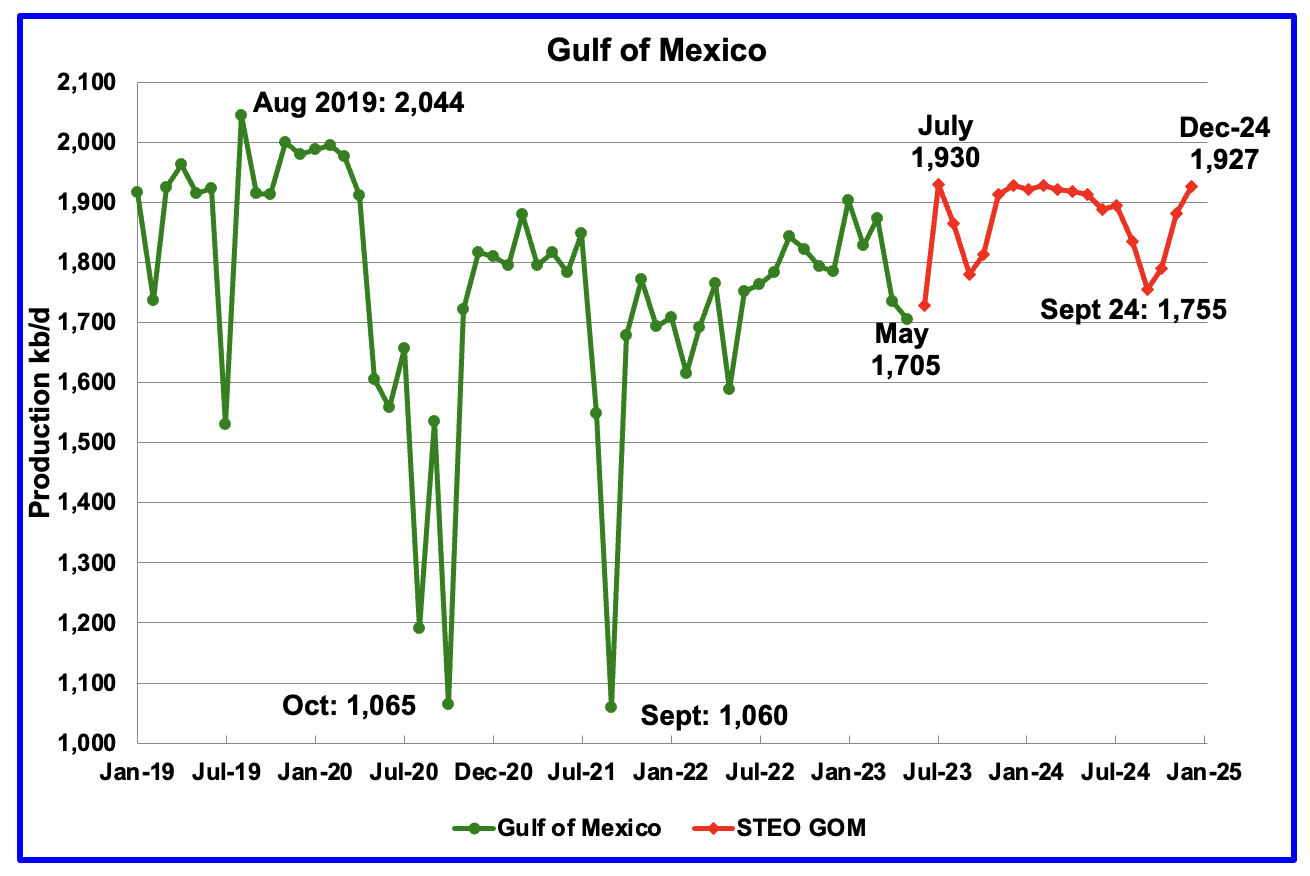
GOM production dropped by 30 kb/d in May to 1,705 kb/d.
The July 2023 STEO projection for the GOM output has been added to this chart and it projects that output in June 2023 will rise to 1,728 kb/d, up by 23 kb/d.
The July spike to 1,930 kb/d could be a reasonable estimate since Shell announced that the Vito platform had begun production on February 15, 2023. However no increase in production has been seen since then. Have there been problems with the Vito startup?
It is not known if the GOM decline shown after July 2023 is related to extensive maintenance.
A Different Perspective on US Oil Production
In this section US production is broken down into two parts, the Big Two , Texas and New Mexico, and the remaining states, The Rest .
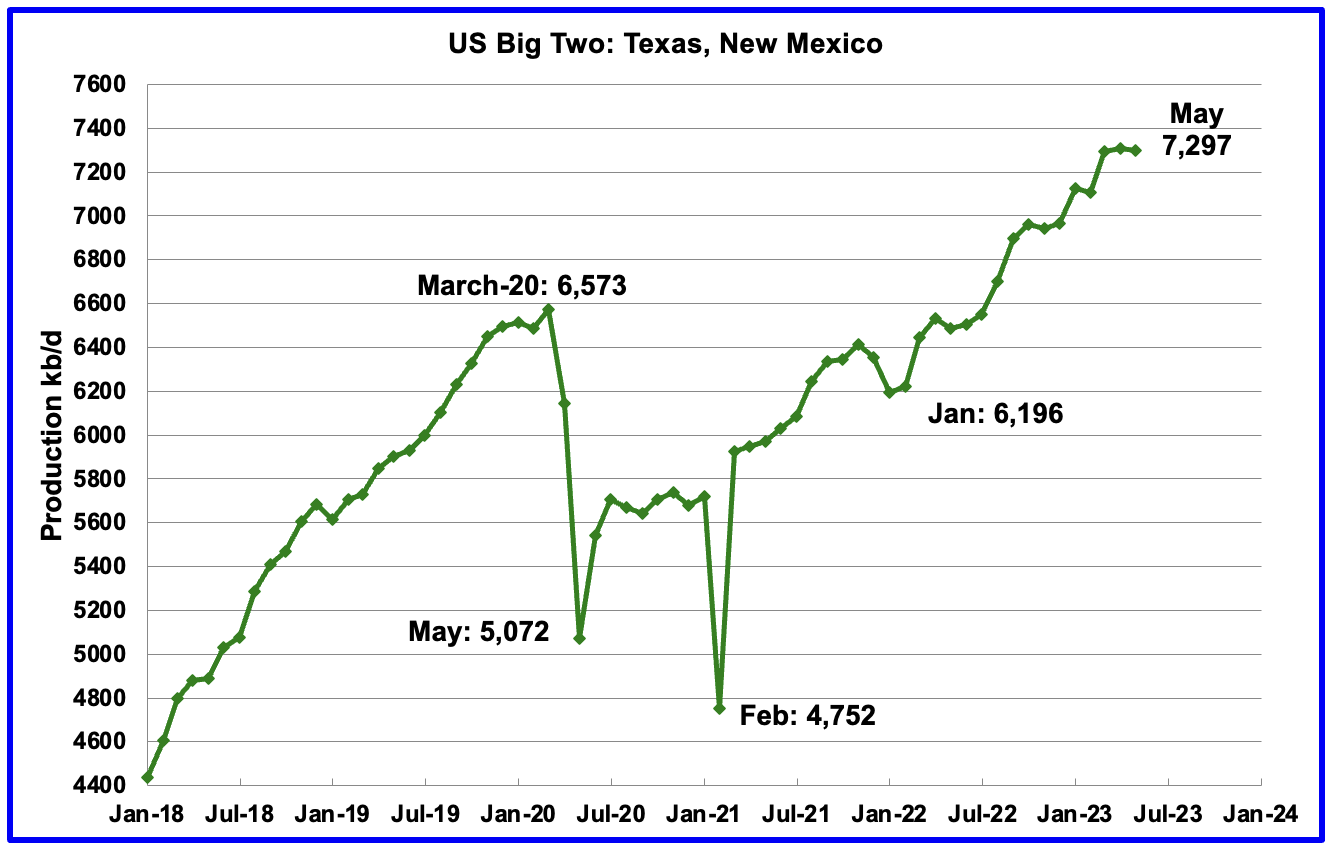
The Big Two states' combined oil output for Texas and New Mexico.
May's production in the Big Two states decreased by a combined 10 kb/d to 7,297 kb/d with Texas adding 48 kb/d while New Mexico dropped by 58 kb/d.
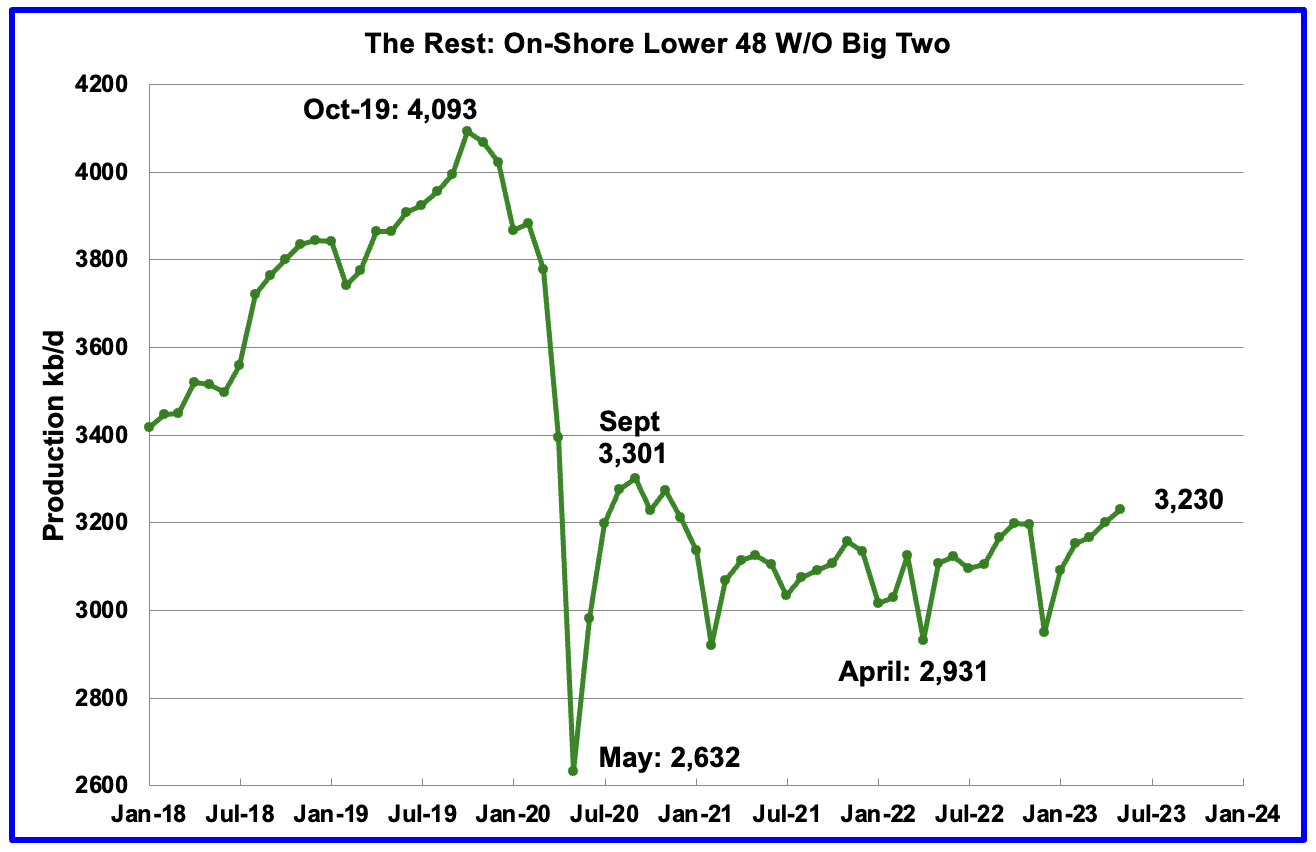
Oil production by The Rest
May's production in The Rest rose by 29 kb/d to 3,230 kb/d. Fro m May 2021 to April 2023, oil production in The Rest has been range bound between 3,000 kb/d and 3,200 kb/d. However May is the first month in which output broke above 3,200 kb/d primarily due to small YoY increases in Utah, Colorado and Oklahoma.
The main takeaway from The Rest chart is that current production is 863 kb/d below the high of October 2019. The question that needs answering is "Is this a permanent loss that will never be recovered? " All indications continue to be that this is a permanent loss.
Weekly Rig and Frac Spread Count
A high of 572 Hz oil rigs was reached in the week ending November 25, 2022. In the week ending July 28, 2023 the number of rigs decreased by 5 to 478 and are down 94 from the recent high of 572.
In the week ending July 28, Permian rigs decreased by 1 to 312 and Texas rigs were unchanged at 271. Specifically for the Permian, down 2 in NM and up 1 in Texas. Note that the general trend for rigs in the Permian is a slow decrease since April and is currently 32 fewer than the 345 rigs on April 28, 2023. In April 2023, WTI was over $80/b. Now that WTI is back over $80/b, will the decreasing trend reverse?
According to this Source : US oilfield service providers expect rig count recovery later this year on high prices
HOUSTON, July 27 (Reuters) - Oilfield service providers on Thursday signaled a recovery in rig count, an indicator of future production, later this year, citing an uptick in oil and gas prices.
U.S. shale producers slashed drilling and well completions in the second quarter, cutting demand for equipment and services. However, with U.S. crude prices climbing back to $80 per barrel, service companies are betting on a recovery in demand.
"We believe the industry rig count is near a bottom," said Andy Hendricks, CEO of Patterson-UTI Energy, adding that the company expects additional rig releases in the next few weeks before drilling activity recovers later in the year.
Since January 2022, the frac spread count has wandered between 250 and 300 fracs per week. For all of 2022 the average weekly frac count was 280.
Frac spreads have been rising from the low of 256 in the week ending June 2. For the week ending July 28, the frac count dropped by 6 to 268 and is down 32 from the high of 300 in November 2022. The current count is slightly lower than the 2022 average of 280 frac spreads per week.
The rig article above indicates that the rig count should increase as WTI increases. If correct, fracs should follow.
Note that these 268 frac spreads include both gas and oil spreads.
Scott Sheffield , the chief executive officer of large shale firm Pioneer Natural Resources said: "Recent weak oil prices have hit drilling, completion of new oil wells as US shale producers curb spending" and "is forecasting crude between $80 - $100 for the balance of this year. "
Permian Basin
This new monthly section will focus on the four largest counties in the Permian, Lea, Eddy, Midland and Martin. It will track the oil and natural gas production and the associated Gas Oil Ratio (GOR) on a monthly basis. The data is taken from the state's government agencies for Texas and New Mexico . Typically the data for the latest two months is not complete and is revised upward as companies submit their updated information.
Of particular interest will be the charts which plot oil production vs GOR for a county to see if a particular characteristic develops that indicates the field is close to entering the bubble point. While the GOR metric is best suited for characterizing individual wells, counties with closely spaced horizontal wells may display a behaviour similar to individual wells. For further information on the bubble point and GOR, there are a few good thoughts on the intricacies of the GOR in an earlier POB comment .
This chart shows the oil production from the eight largest counties in the Permian. In the New Mexico Permian, there are two counties Lea and Eddy. The remaining six are in Texas; Midland, Martin, Reeves, Loving, Howard and Kernes.
The red markers show production from the two NM counties while the blue markers show total production for NM from the EIA monthly production report. The EIA must have some correction factors to increased NM's output from NM's official site. The brown markers show output from the six biggest Permian counties in Texas.
For January 2023, Novi Labs is reporting Permian tight oil production of 5,180 kb/d compared with 4,381 kb/d from the eight counties shown in the above chart, which is 84.6% of total Permian output.
Over the last three months, it appears that oil production is falling faster than NG production.
After much zig zagging, production stabilizes above 1,000 kb/d and the GOR hints at an increasing trend.
Similar production flattening to Lea county above 700 kb/d and an increasing GOR.
Oil production dropping faster than NG over last 5 months.
Similar flattening above 600 kb/d and increasing GOR.
Oil production plateauing while NG production continues to rise.
After peaking above 550 kb/d, production drops as GOR increases. Martin county appears to have peaked since production is falling as the GOR continues to rise.
Are the production vs GOR charts above exhibiting characteristics indicating that these four counties are near the bubble point and are close to peaking?
Drilling Productivity Report
The Drilling Productivity Report (DPR) uses recent data on the total number of drilling rigs in operation along with estimates of drilling productivity and estimated changes in production from existing oil wells to provide estimated changes in oil production for the principal tight oil regions. The July DPR report forecasts production to August 2023 and the following charts are updated to August 2023. The DUC charts and Drilled Wells charts are updated to June 2023.
Above is the total oil production projected to August 2023 for the 7 DPR basins that the EIA tracks. Note that DPR production includes both LTO oil and oil from conventional wells.
The DPR is projecting that oil output for August 2023 will decrease by 18 kb/d to 9,399 kb/d, the first drop in production in over a year, excluding the December 2022 weather related drop. The drop is the culmination of the slowly reducing monthly rolling over/plateauing production trend that began seven months ago due to reduced drilling and completions. Also see next chart.
The July DPR production report increased/revised production over the last few months by roughly 40 kb/d to 50 kb/d over the June report. For instance, July output in the June report, red markers, was revised up by 41 kb/d from 9,376 kb/d to 9,417 kb/d.
This chart shows the DPR production increments tracked on a monthly basis. What is notable is the dropping monthly increments and the reduced month to month volatility since February 2023. The January 2023 spike is due to the weather related December oil production drop.
The more interesting trend to notice is the declining monthly changes in the production rate. August's production decrease was 18 kb/d while February's was an increase of 114 kb/d. This short term production rate trend is hinting at an upcoming plateau or possible peaking in Permian production, since it is the dominant producer.
The issue is whether this slowing trend is the result of management's decision on how to deploy its revenue, investors vs production increase, or is it related to geology, fewer Tier 1 locations along with the Permian gassing out and last but not least the current price of WTI, bouncing between $70/b and $75/b
Permian output rolled over in August. It is expected to decrease by 11 kb/d to 5,764 kb/d. The last six months of production data clearly shows a slowing in monthly production increases, similar to the trend noted above for the total production for the DPR regions.
August's output is 847 kb/d higher than the pre-pandemic high 4,917 kb/d.
During June , 460 wells were drilled and 480 were completed in the Permian. (Note that June is the latest month for DUC information). The completed wells added 376 kb/d to June's output for an average of 782 b/d/well. The overall decline was 365 kb/d which resulted in a net increase for Permian output of 11 kb/d. Of the 480 completed wells in June, 466 were required to offset the decline.
Note: The additional 14 wells over those required to offset decline only added 11 kb/d to overall production in June, less than 1 kb/d per well.
June completions are at a new recent low in the Permian.
Permian monthly production increments have been falling since March. They are following the same trend as shown in the completions chart above.
This chart shows the average first month total production from Permian wells tracked on a monthly basis. The total monthly production from the newest Permian wells in August continues to be at the 370 kb/d level but hinting at a dropping trend. Production has bounced around 370 kb/d for the last five months.
Output in the Eagle Ford basin has been in a generally flat trend since March 2021, fluctuating over a range of between 1,050 kb/d to 1,150 kb/d. August's forecast projects output is expected to decrease by 12 kb/d to 1,124 kb/d.
At the beginning of the year 2023, 68 rigs were operating in the Eagle Ford basin. The rig count began to drop in mid March to 60 and dropped further to 58 in June.
The DPR forecasts Bakken output in August will be 1,222 kb/d an increase of 4 kb/d over July.
Output in the Niobrara continues to increase slowly. August's output increased by 3 kb/d to 665 kb/d.
Production increased due to the addition of rigs into the basin but stabilized at 16 ± 1 rigs in March and April. However in June and July the rig count dropped to 14.
DUCs and Drilled Wells
The number of DUCs available for completion in the Permian and the four major DPR oil basins has fallen every month since July 2020 and continued to decrease in June. June DUCs decreased by 28 to 2,574. The biggest decrease came from the Permian where DUCs decreased by 20 while Bakken DUCs dropped by 10, Eagle Ford by 4 and the Niobrara added 6.
June Permian DUCs decreased by 20 to 857 because 460 wells were drilled and 480 were completed.
In these 4 basins, 730 wells were drilled while 758 were completed for a net decrease of 28 DUCs in June. Both drilled wells and completions are down from higher levels in late 2022.
In the Permian, the monthly completion rate has been showing signs of slowing since the July 2022 high of 525. June hit a new recent low of 480 completions.
In June 480 wells were completed while 460 new wells were drilled. The gap between completed and drilled wells in the Permian has now been reduced to 20.
The Permian, as of May, had 857 DUCs remaining and the completion rate was 480 wells/mth. This means that the current cycle time between drilling and completions is 1.79 months or 54 days.
Editor's Note: The summary bullets for this article were chosen by Seeking Alpha editors.
For further details see:
U.S. May Oil Production Little Changed