USOI - U.S. October Oil Production Held Steady
2024-01-05 02:50:00 ET
Summary
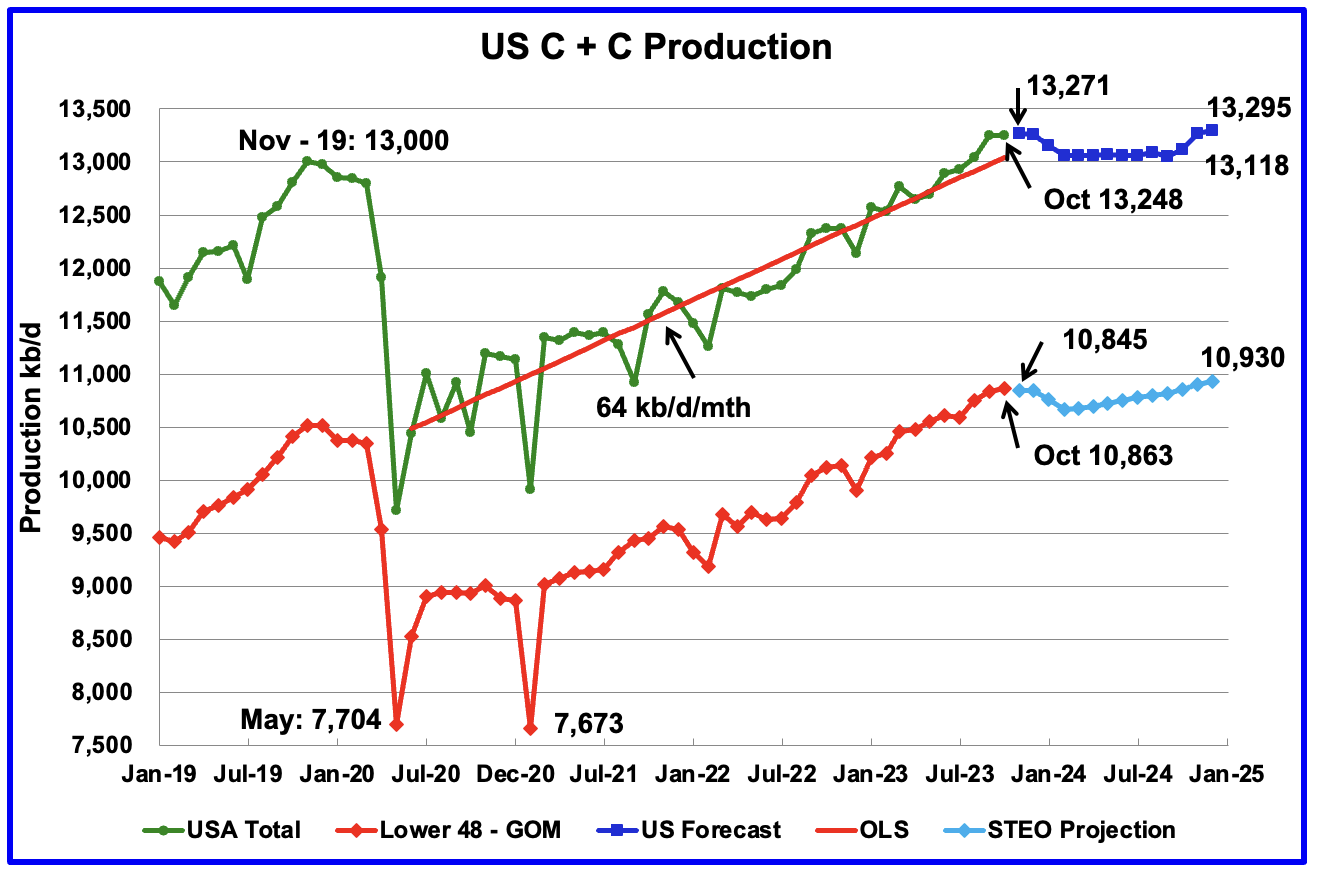
- U.S. October oil production decreased by 4 kb/d to 13,248 kb/d.
- The growth rate going forward into 2024 is flat and significantly lower than seen in the previous June 2020 to October 2023 time period.
- Martin County is displaying a new trend of increasing oil production while at the same time showing a retrograde GOR.
- In the Permian, the monthly completion and drilling rates have been slowing since the March 2023 high of 545.
By Ovi
All of the Crude plus Condensate (C + C) production data for the US state charts comes from the EIA?s Petroleum Supply monthly PSM, which provides updated information up to October 2023.
U.S. October oil production decreased by 4 kb/d to 13,248 kb/d. The decrease was primarily due to decreases in the GOM and North Dakota being partially offset by increases in Texas and New Mexico. Note that September production was revised up from 13,236 kb/d to 13,252 kb/d.
The dark blue graph, taken from the December 2023 STEO, is the forecast for U.S. oil production from November 2023 to December 2024. Output for December 2024 is expected to reach 13,295 kb/d which is 145 kb/d lower than forecast last month.
The red OLS line from June 2020 to October 2023 indicates a monthly production growth rate of 64 kb/d/mth or 768 kb/d/yr. Clearly, the growth rate going forward into 2024, shown by the dark blue graph, is flat and significantly lower than seen in the previous June 2020 to October 2023 time period. From November 2023 to December 2024, production is expected to grow by 24 kb/d. Production is expected to fall from December 2023 to October 2024 before beginning to rise.
While overall US oil production decreased by 4 kb/d, the Onshore L48 had a production increase of 25 kb/d to 10,863 kb/d in October.
The light blue graph is the STEO's projection for output to December 2024 for the Onshore L48. From November 2023 to December 2024, production is expected to increase by 85 kb/d to 10,930 kb/d. However, note that the December 2024 production was revised down by 139 kb/d from 11,069 kb/d.
Oil Production Ranked by State
Listed above are the 10 states with the largest US oil production along with the Gulf of Mexico. These 10 states accounted for 82.1% of all U.S. oil production out of a total production of 13,248 kb/d in October 2023.
On a YoY basis, US production increased by 831 kb/d with the majority, 648 kb/d coming from Texas, New Mexico and North Dakota. GOM production dropped by 40 kb/d MoM while YOY it is up 138 kb/d.
State Oil Production Charts
Texas production increased by 21 kb/d in October to 5,607 kb/d. However, relative to September's production reported last month, 5,573 kb/d, October output was up by 34 kb/d.
The red graph shows Texas October oil production as reported by the Texas Rail Road Commission ((RRC)). The Green graph is a projection for Texas production using a methodology based on two months of production data, September and October, from the Texas RRC. The October estimate is low by 84 kb/d while the September estimate is low by 20 kb/d, 5,566 kb/d vs 5,586 kb/d. Next month the EIA's October estimates will be revised and will be re-compared against the blue graph.
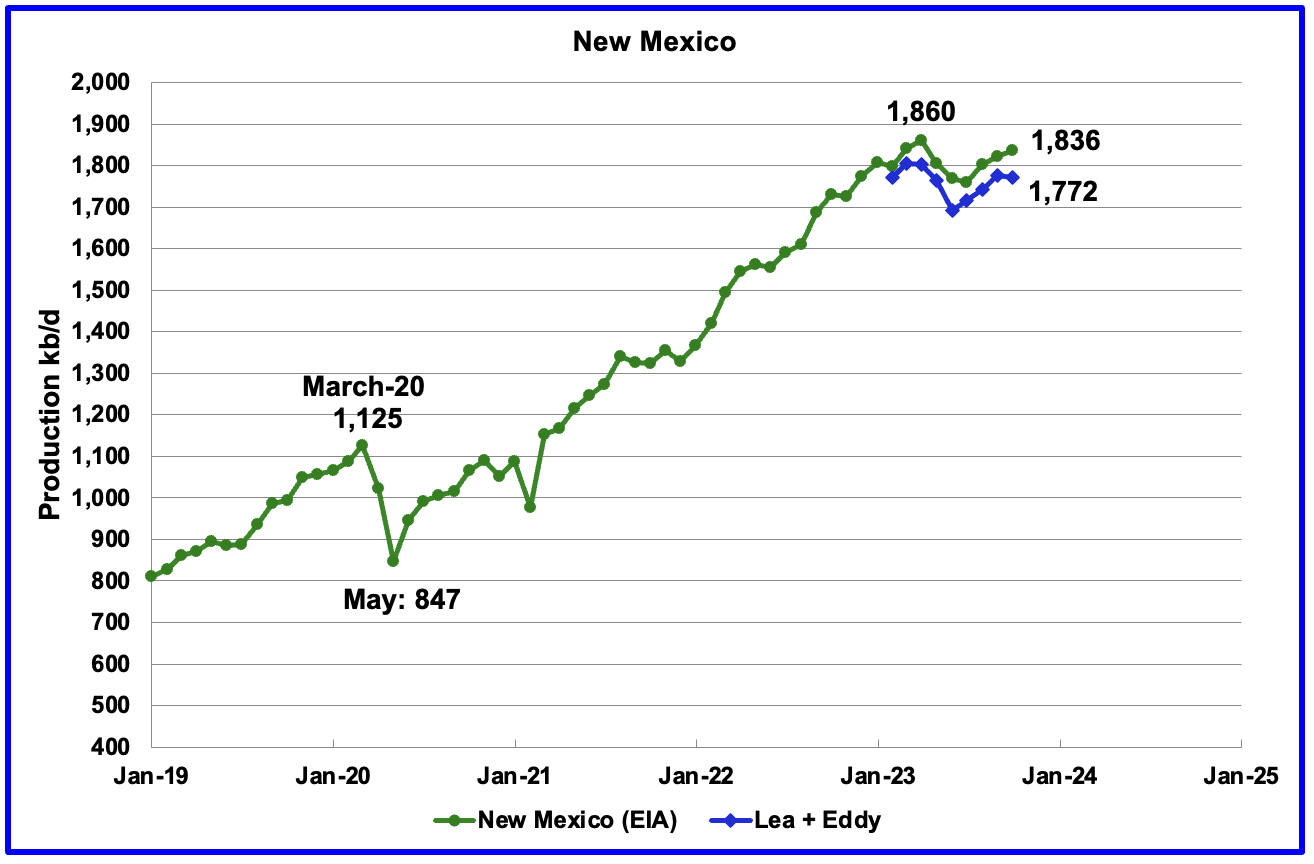
New Mexico's October production rose by 14 kb/d to 1,836 kb/d. The combined output from Lea and Eddy counties dropped by 5 kb/d. It is interesting to see that the Lea + Eddy production trend is similar to the EIA's except for the last month. The current gap between the New Mexico production report and the EIA's is 64 kb/d and the majority of that gap will be closed over the next six months as the producers update their information. Part of the 64 kb/d gap comes from four additional New Mexico counties, San Juan, Sandoval, Chaves and Rio Arriba that produce close to 30 kb/d.
Of the EIA's 1,836 kb/d output from New Mexico, 1,772 kb/d (96.5%) came from the Lea and Eddy counties. The Lea and Eddy County production data for October is not complete and will be updated over the next three months.
More production information from these two counties is reviewed in the special Permian section further down.
October's output decreased by 31 kb/d to 1,274 kb/d.
According to this source , production growth for October was lower due to October bad weather.
"North Dakota oil and gas production both fell in October, largely due to bad weather, the state's top oil regulator says.
There were 18,619 wells producing in October, another all-time high.
The state's figures lag two months as officials collect and analyze data from energy companies.
Most of October's drop was due to a period of heavy snow at the end of October, state Department of Mineral Resources Director Lynn Helms said during his monthly report.
"Somewhere between 50,000 and 90,000 barrels (of oil) a day shut in, and it took a full month to completely recover from that," he said."
This last statement Implies that November will also be down.
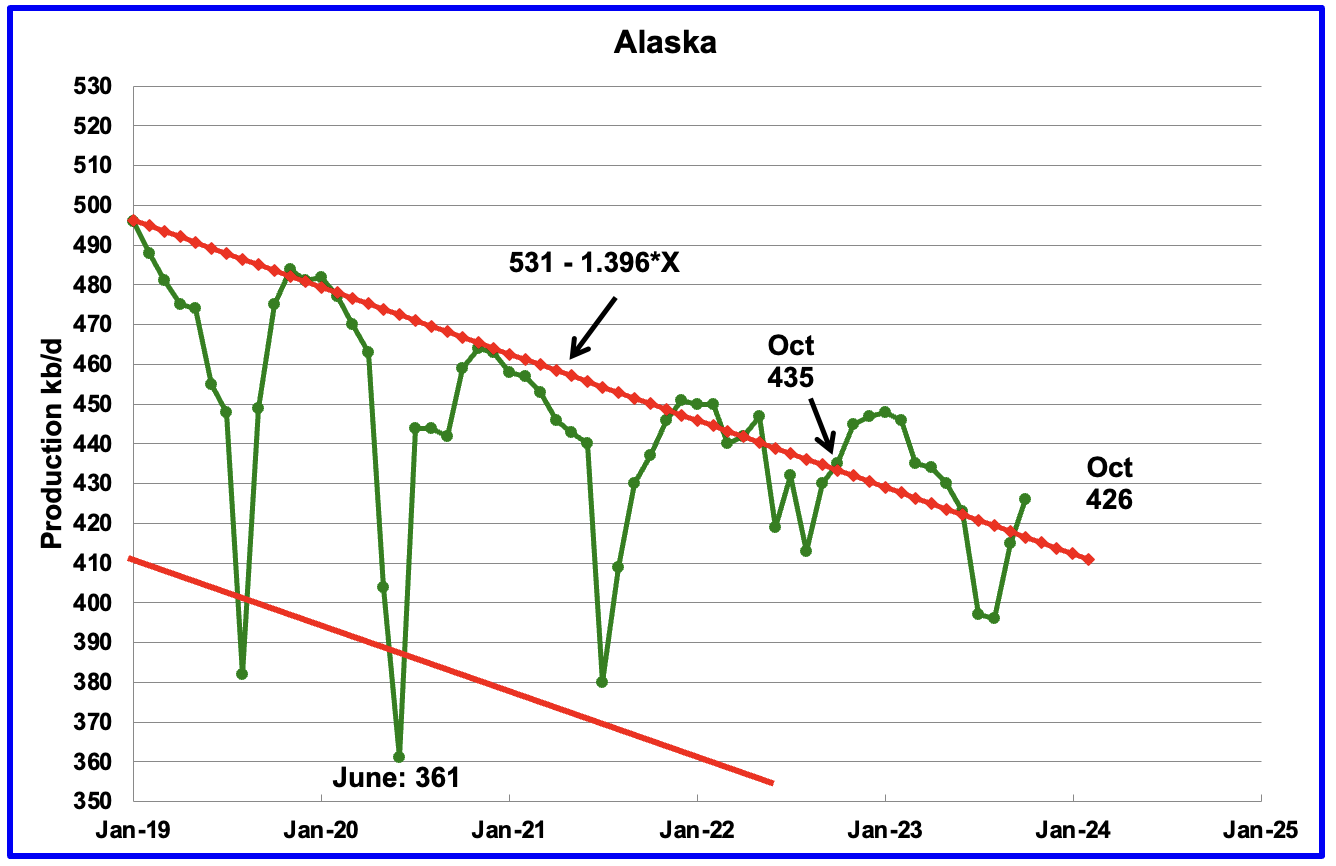
Alaska?s October output increased by 11 kb/d to 426 kb/d. Production YoY is down by 9 kb/d. The weekly EIA report continues to show December Alaska production is in the 430 kb/d to 440 kb/d range.
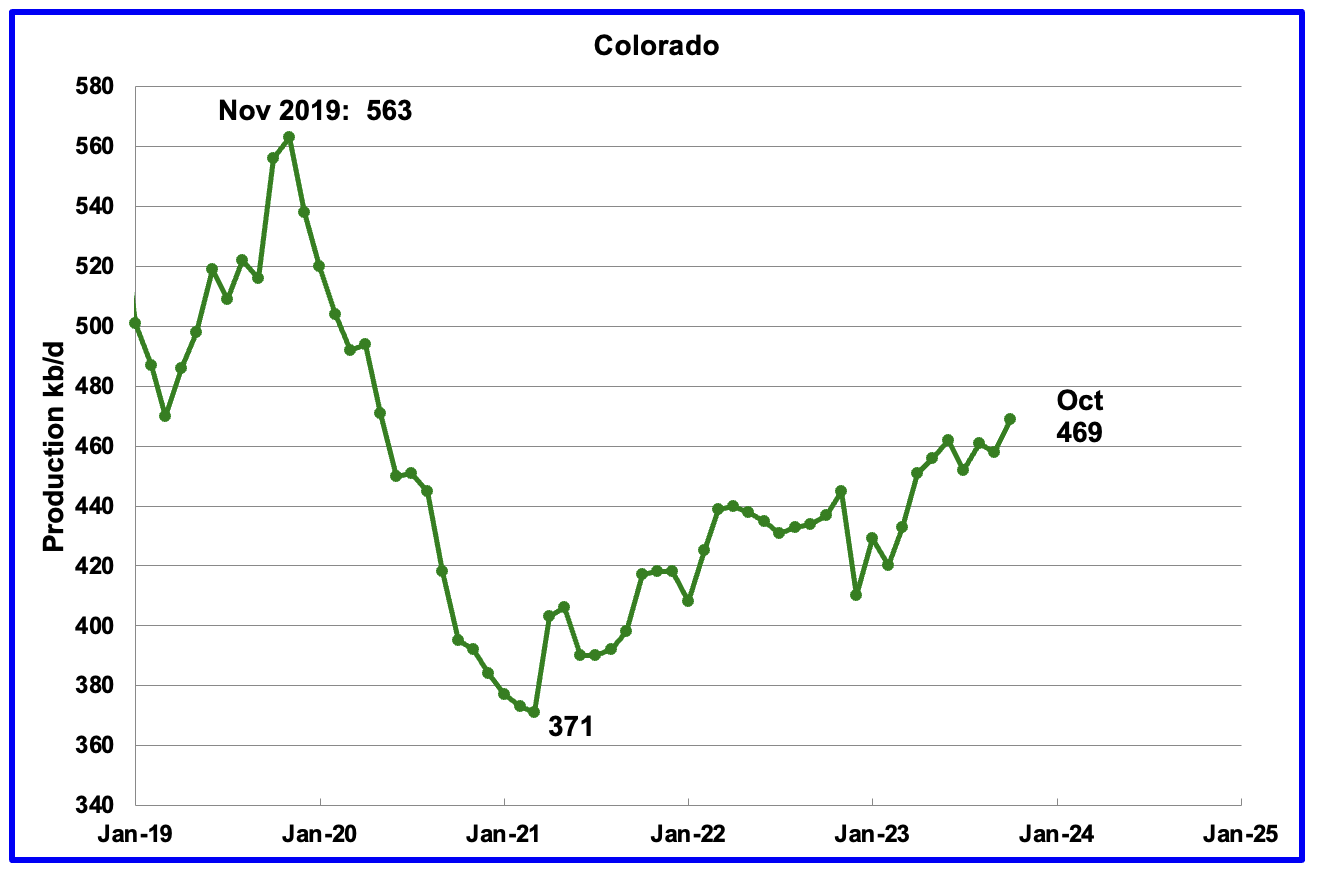
Colorado?s October production increased by 11 kb/d to 469 kb/d.
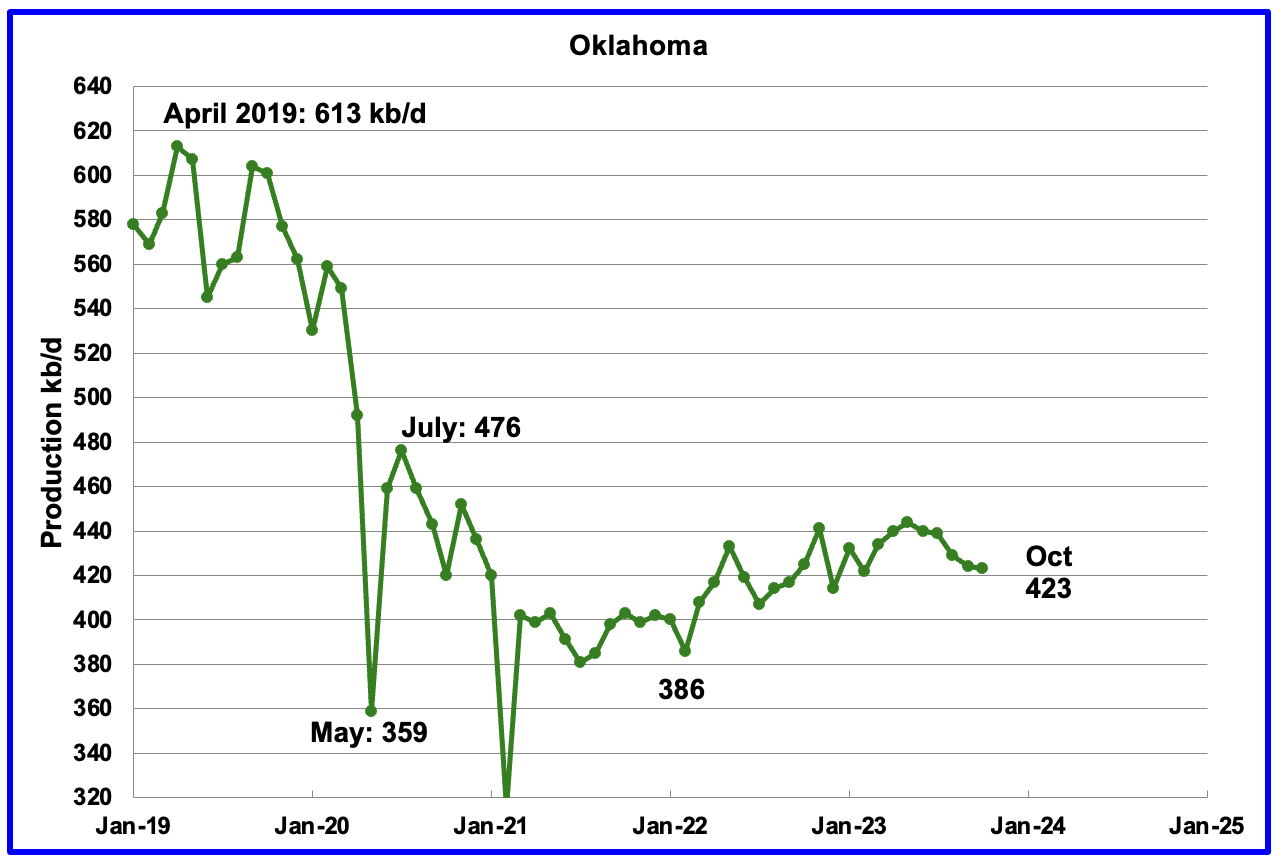
Oklahoma's output in October decreased by 1 kb/d to 423 kb/d. Production remains 53 kb/d below the post-pandemic July 2020 high of 476 kb/d. Output may be in a plateau/declining phase.
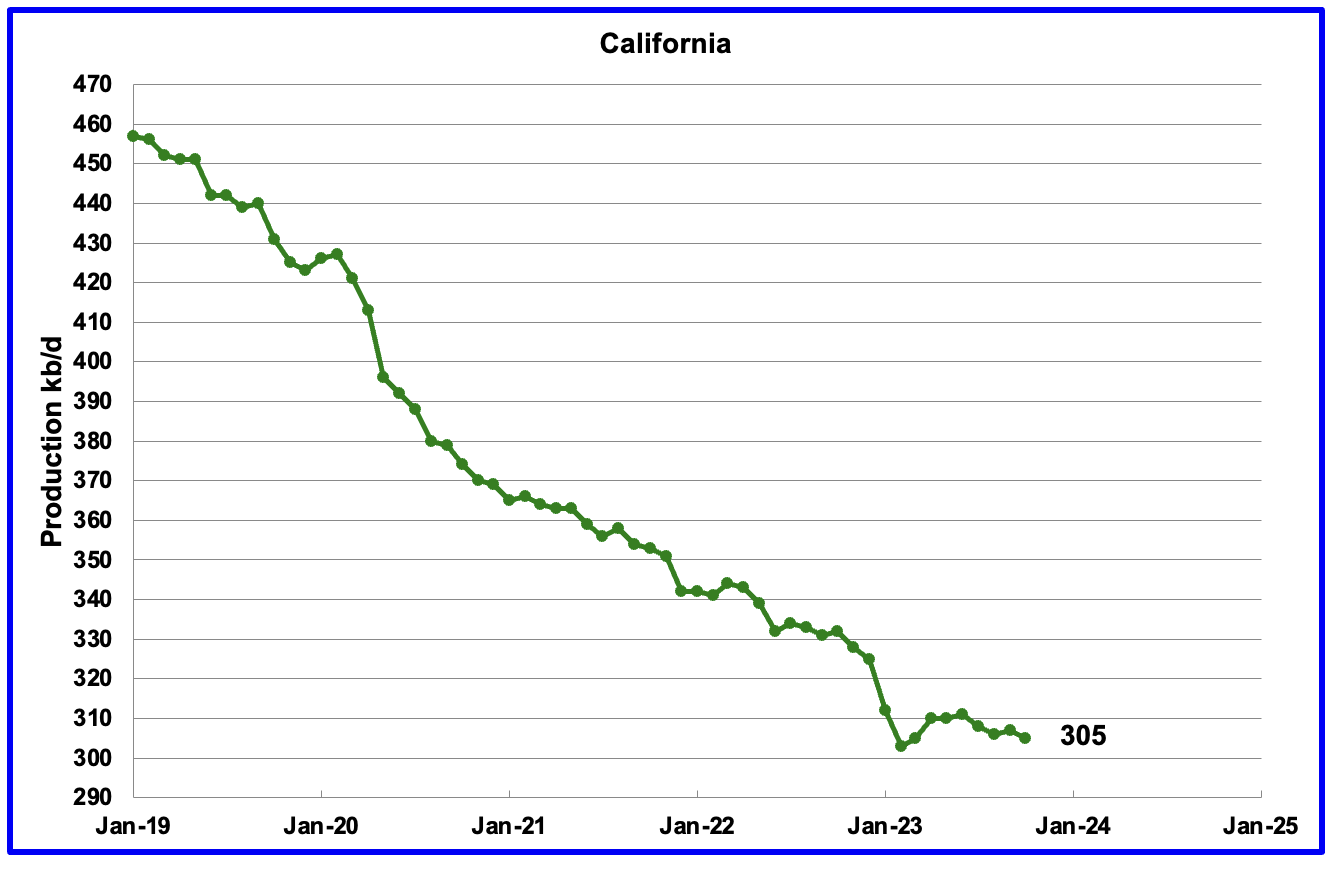
California's October production declined 2 kb/d to 305 kb/d.
Wyoming's oil production has been rebounding since March 2023. October's oil production rose to 274 kb/d, a post-pandemic record high, exceeding November 2022 by 4 kb/d.
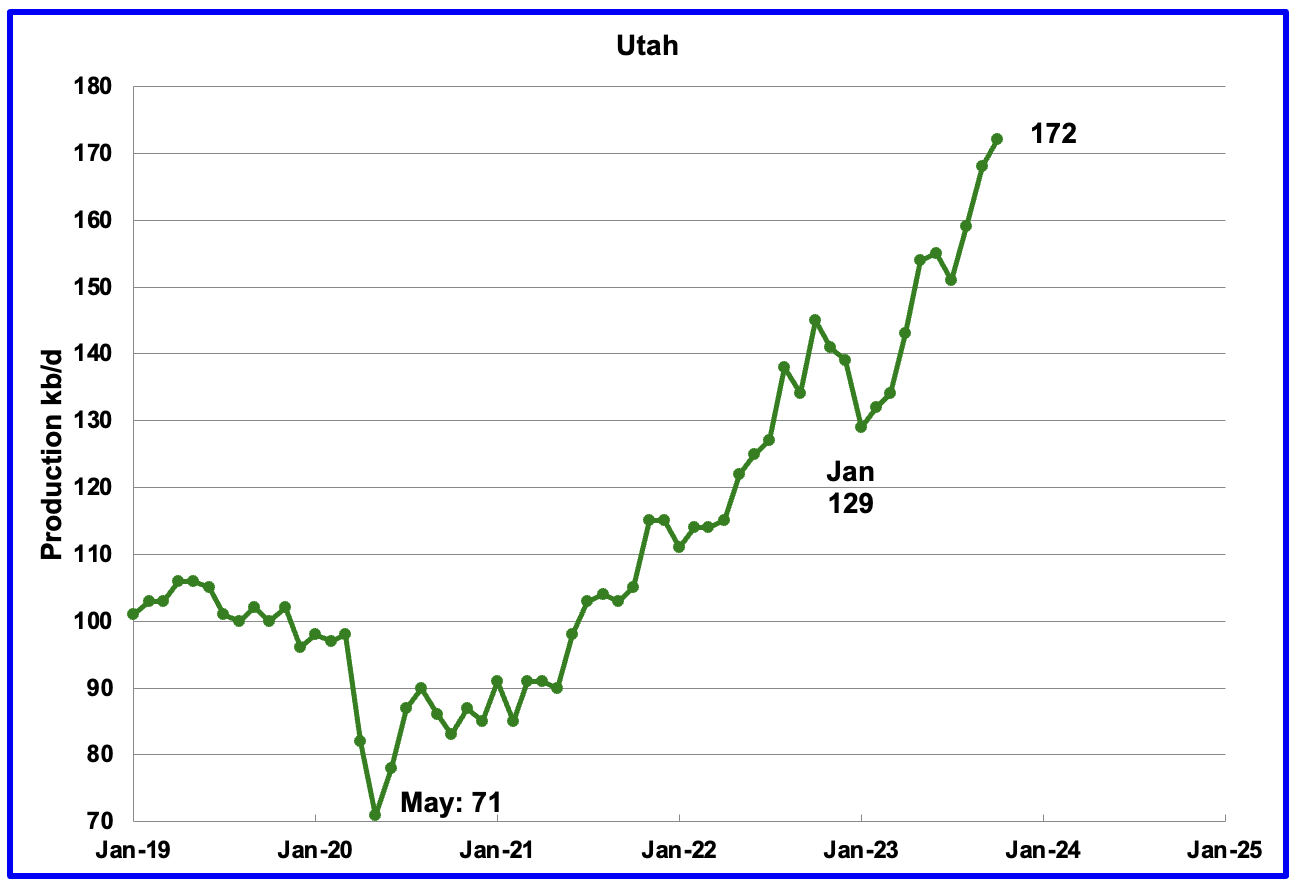
October's production increased by 4 kb/d to 172 kb/d to another record high. For the first 4 months of 2023, Utah had 7 rigs operating. Since May, the number of operational rigs has bounced between 8 and 9, which may account for the increased production.
The increased production since February has come from the Uinta Basin .
Louisiana's output entered into a slow decline phase in October 2022. October's production decreased by 2 kb/d to 92 kb/d and is 13 kb/d lower than October 2022.
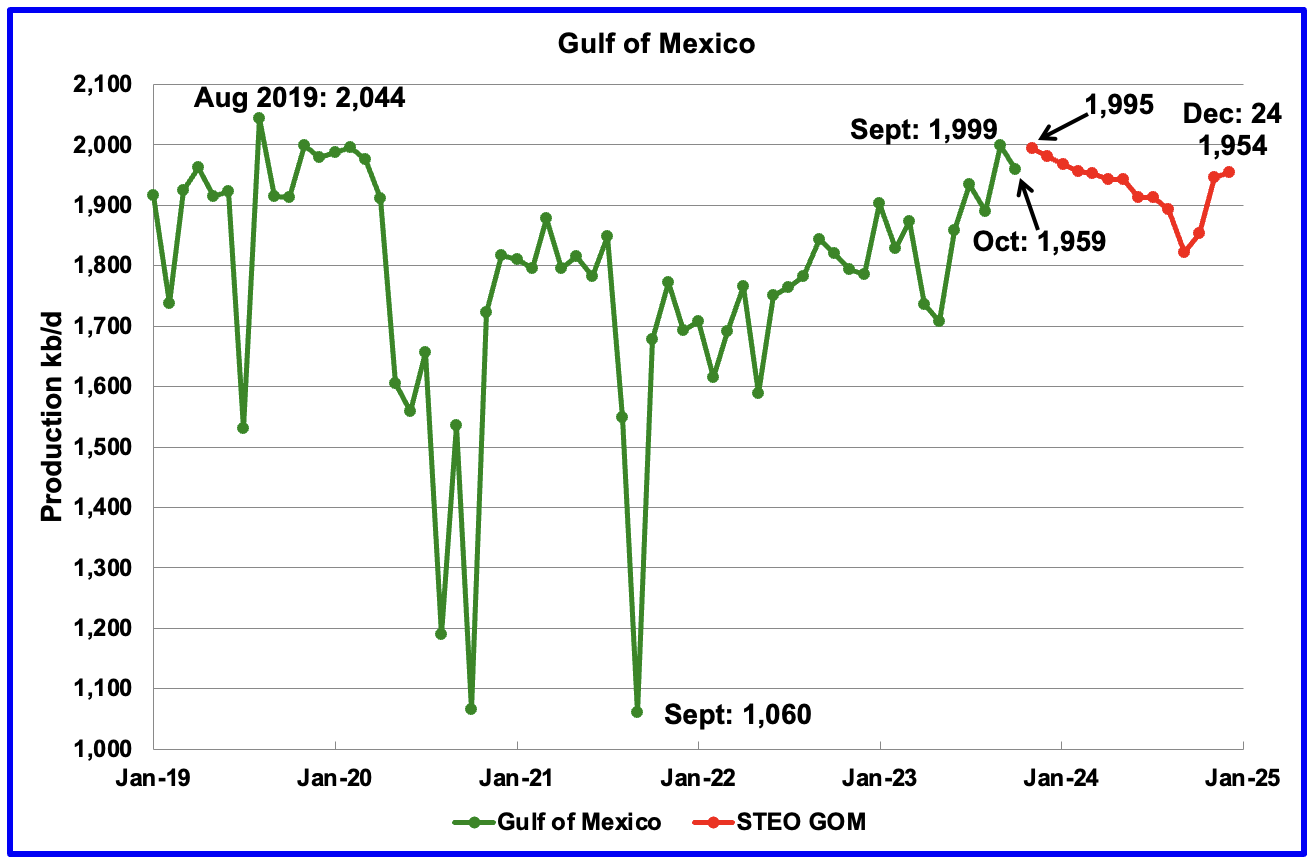
GOM production decreased by 40 kb/d in October to 1,959 kb/d but is expected to add 36 kb/d in November to 1,995 kb/d.
The December 2023 STEO projection for the GOM output has been added to this chart. It projects that over the next eleven months, production will fall to 1,822 kb/d before rebounding to 1,954 kb/d in December 2024.
It is not known if the GOM decline shown after November 2023 is related to a combination of extensive maintenance and a general decline of wells. Also, disappointing production from some highly touted wells could be an issue according to this source .
"PowerNap looks like an even bigger disappointment and is declining towards zero having produced less than 5% of its original reserve estimate."
A Different Perspective on US Oil Production
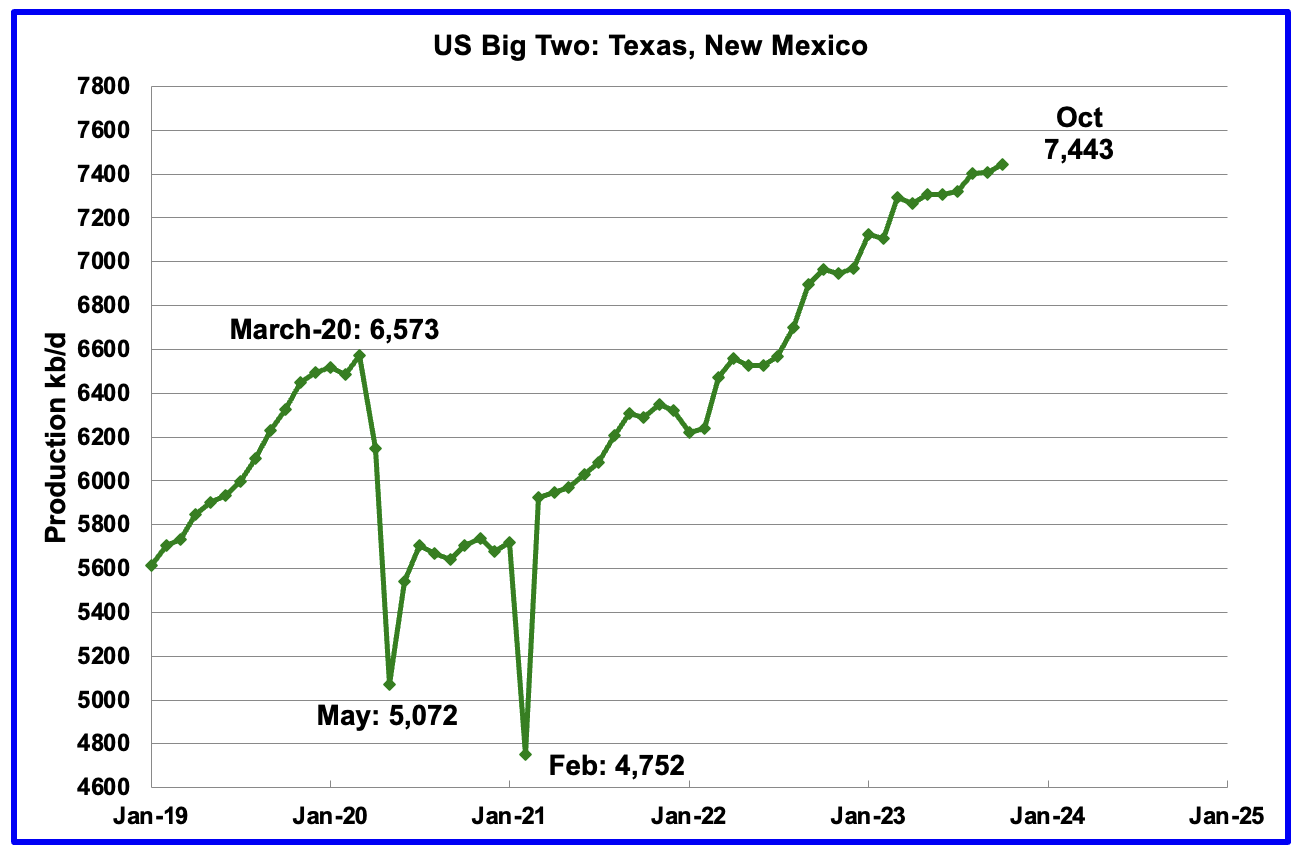
The Big Two states' combined oil output for Texas and New Mexico.
October's production in the Big Two states increased by a combined 35 kb/d to 7,443 kb/d, with Texas adding 21 kb/d while New Mexico added 14 kb/d. October production of 7,443 kb/d is 53 kb/d higher than reported last month for September.
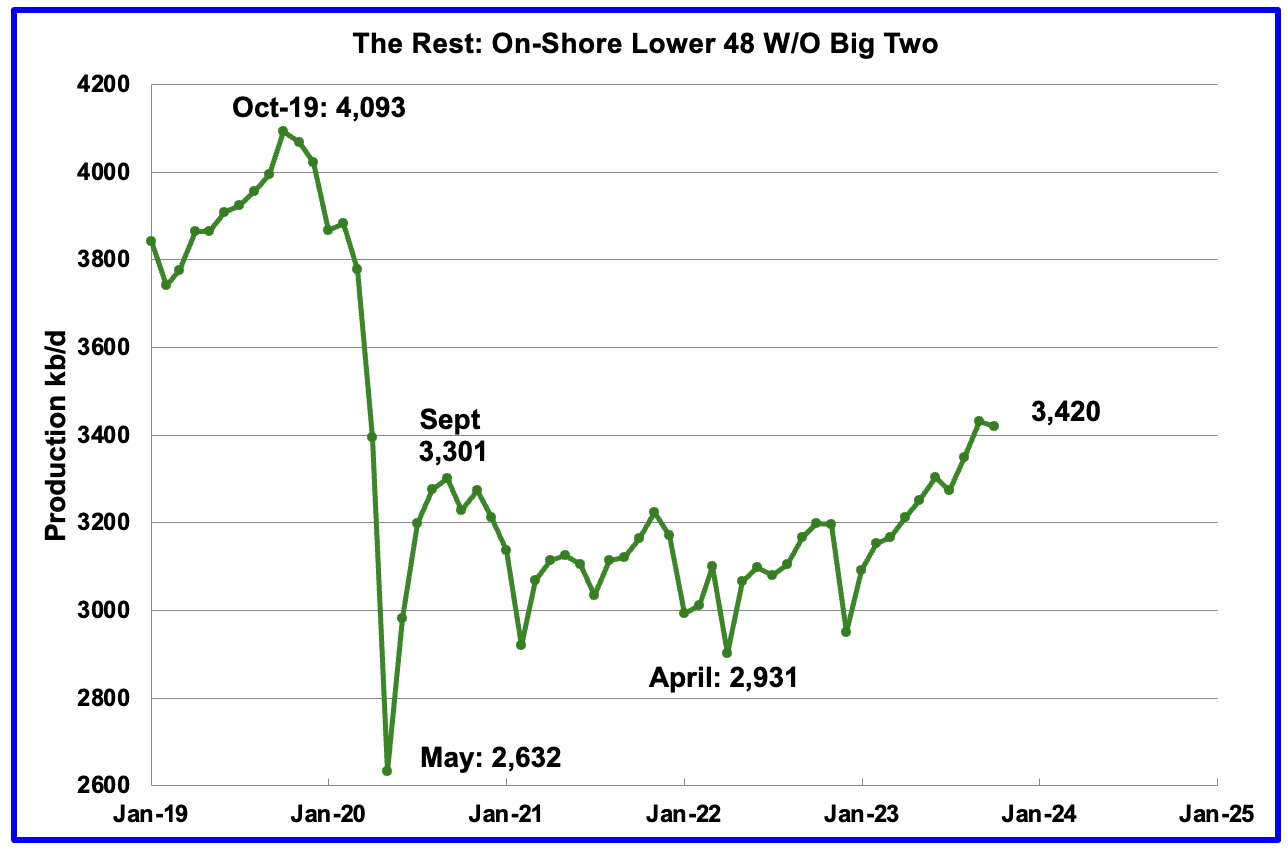
Oil production by The Rest
October's production in The Rest decreased by 10 kb/d to 3,420 kb/d.
The main takeaway from The Rest chart is that current production is 673 kb/d below the high of October 2019 and this appears to be a permanent loss that will never be recovered.
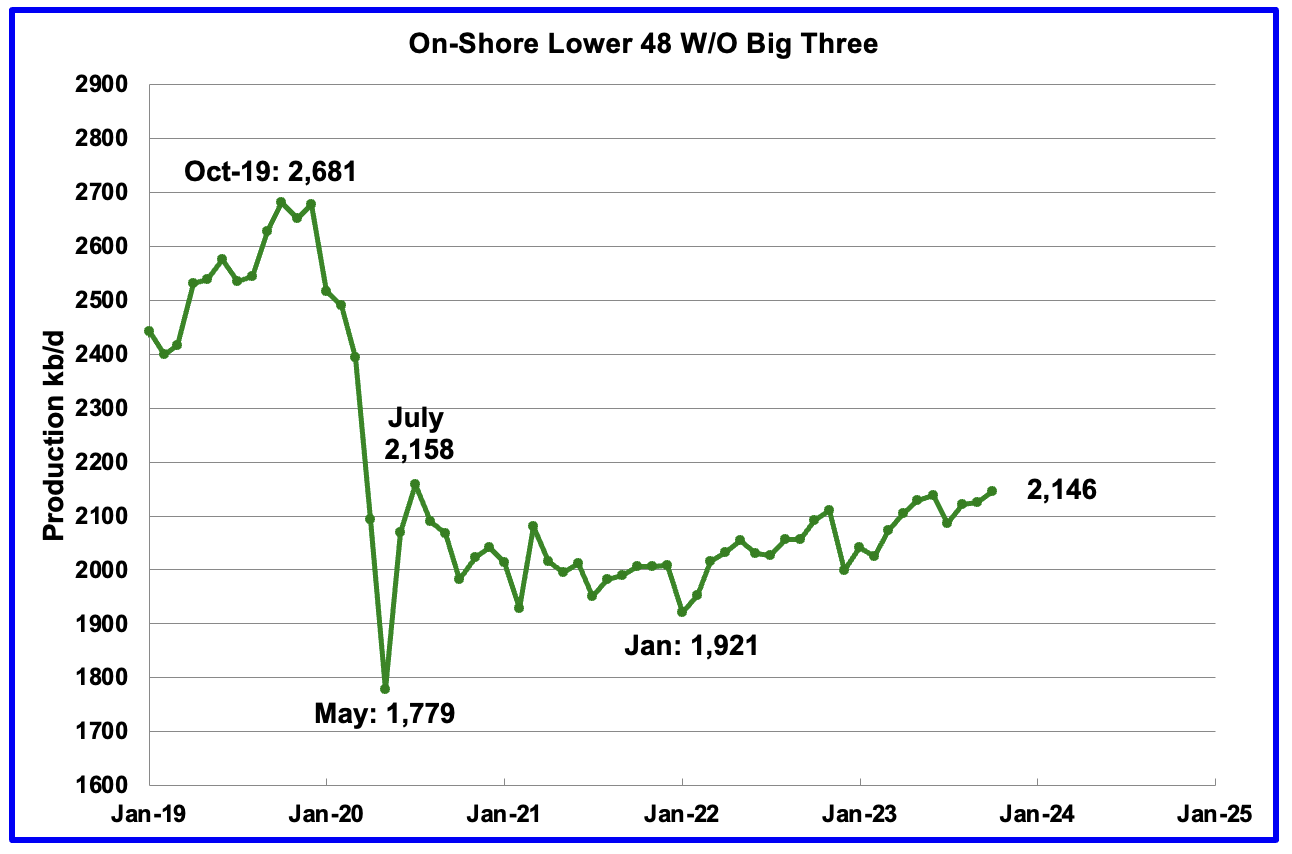
The Onshore lower 48 W/O the big three shows a slow rising trend from the low of January 2022. October's production increased by 21 kb/d to 2,146 kb/d. The majority came from Alaska and Colorado with both adding 11 kb/d each. It is just 12 kb/d lower than the post-Covid rebound to 2,158 in July 2020.
Permian Basin Report by Main Counties and Districts
This special monthly Permian section was recently added to the US report because of a range of views on whether Permian production will continue to grow or will peak over the next year or two. The issue was brought into focus recently by the Goehring and Rozencwajg Report which indicated that a few of the biggest Permian oil-producing counties were close to peaking or past peak. Also, comments by posters on this site have similar beliefs from hands-on experience.
This section will focus on the four largest oil-producing counties in the Permian, Lea, Eddy, Midland and Martin. It will track the oil and natural gas production and the associated Gas Oil Ratio (GOR) on a monthly basis. The data is taken from the state's government agencies for Texas and New Mexico . Typically the data for the latest two or three months is not complete and is revised upward as companies submit their updated information. Note the natural gas production shown in the charts that is used to calculate the GOR is the gas coming from both the gas and oil wells .
Of particular interest will be the charts which plot oil production vs GOR for a county to see if a particular characteristic develops that indicates the field is close to entering the bubble point phase. While the GOR metric is best suited for characterizing individual wells, counties with closely spaced horizontal wells may display a behaviour similar to individual wells due to pressure cross-talking. For further information on the bubble point and GOR, there are a few good thoughts on the intricacies of the GOR in an earlier POB comment . Also check this EIA topic on GOR.
This chart shows four oil production projections for the Permian Basin. The gap between the DPR and LTO projections is there because the DPR projection includes both LTO oil along with oil from conventional wells in the basins that it covers.
The red and green graphs show oil production as published by the EIA's DPR and the LTO offices. Comparing the two, it appears that the LTO office believes Permian LTO production is currently in a plateau phase while the DPR office is showing a small increase in growth before plateauing. The brown and blue markers are projections by D Coyne and yours truly respectively based on different methodologies. Dennis' projection is tight oil only and does not include conventional oil from Permian counties.
The blue graph only uses two months of production data from New Mexico and the Texas RRC, September and October, to make its October projection. Note the projection for October is required because the October production data from the States is incomplete . A few more months of data is required to refine and modify the methodology. The blue graph is similar to the DPR and LTO graphs in the sense that it is also indicating that Permian production may be entering a plateau phase.
New Mexico Permian
Over the past 4 months, drilling activity in Lea has fallen each month. For the week ending December 29, the rig count in Lea dropped by one and was unchanged in Eddy. Since August, the New Mexico rig count has dropped from 104 in August to 89 at the end of December.
From June to September gas production rose faster than oil production in Lea County. However, October saw a reversal and NG production dropped faster than oil production and the GOR dropped, next chart.
October oil production was 1044 kb/d and relatively unchanged since August, even though the rig count has dropped by 17.
After much zigging and zagging, oil production in Lea County stabilized above 1,000 kb/d while the GOR started to increase in January 2023 and exceeded the semi-bounded GOR in July 2023 while production remained relatively flat. The data for the last four months, July to October, is incomplete.
This zigging and zagging GOR pattern within a semi-bounded GOR while oil production increases to some stable level and then moves out to a higher GOR to the right has shown up in a number of counties. See an additional two cases below. While this is the fourth month in which Lea County has registered a GOR outside the semi-bounded GOR range, the trend has changed since the GOR has started to drop.
This dropping GOR trend has also shown up in Martin County. This implies that the concentration of dissolved NG in the oil phase is lower than previous months at the current temperature and pressure conditions and that going forward the GOR should continue to drop. A deeper explanation for this reversing GOR phenomena, if it continues, would be much appreciated.
Eddy County oil production is showing early signs that it has peaked. October production was 692 kb/d.
The Eddy County GOR pattern is similar to Lea County except that Eddy broke out from the semi-bounded range earlier and for a longer period while oil production has been dropping.
Texas Permian
During December drilling activity increased in Midland County while it dropped in Martin County.
Both natural gas and oil production are dropping in Midland County. Cannot find any explanation for the July spike in oil and gas production. Oil production has dropped by 103 kb/d to 548 kb/d since July.
Oil production is dropping and the GOR is increasing. It appears that Midland has entered the bubble phase.
Both natural gas and oil production are increasing in Martin County.
The blue line is a production estimate which the Texas RRC will be reporting for Martin County one year from now as drillers report additional updated information. This projection is based on a methodology that used September and October production data and will be re-estimated next month.
Martin County is displaying a new trend of increasing oil production while at the same time showing a retrograde GOR. Martin County has the lowest GOR of these four counties and at a GOR of 2.53, Martin may not be at the bubble point that results in a dropping oil production trend.
Three of the four oil production vs GOR charts above are exhibiting characteristics indicating that three of the largest oil-producing counties in the Permian are in the bubble point phase and are close to or past their peak. Not clear as to what is happening in Martin County.
Eagle Ford Basin
This chart is an estimate for oil production in the Eagle Ford Basin using the RRC output from Districts 1 and 2, which are the two main districts comprising the Eagle Ford Basin. The green graph shows the most recent production data from the Texas RRC. The blue graph is the expected oil production that the RRC will post about a year from now.
Karnes County is the biggest oil-producing county in the Eagle Ford Basin and is ranked as the seventh-largest oil-producing county in Texas. Both oil and gas production are falling in Karnes County and both are down close to 30% from the peak.
This is the GOR vs oil production for Karnes County but the GOR is still within its typical range while both production and GOR are dropping. This may indicate that Karnes County wells never entered the bubble point phase and weren't very gassy to start with. Karnes County ranks fifteen in Texas natural gas production.
Drilling Productivity Report
The Drilling Productivity Report (DPR) uses recent data on the total number of drilling rigs in operation along with estimates of drilling productivity and estimated changes in production from existing oil wells to provide estimated changes in oil production for the principal tight oil regions. The December DPR report forecasts production to January 2024 and the following charts are updated to January 2024. The DUC charts and Drilled Wells charts are updated to November 2023.
Above is the total oil production projected to January 2024 for the 7 DPR basins that the EIA tracks. Note that DPR production includes both LTO oil and oil from conventional wells.
The DPR is projecting that oil output for January 2024 will decrease by 1 kb/d to 9,692 kb/d.
While the green graph shows DPR production being essentially flat since September, it also had an upward revision to its production since the last report, red graph. For December, DPR production has been revised up by 41 kb/d, from 9,552 kb/d to 9,693 kb/d with the biggest increase occurring in the Bakken Basin.
According to the EIA's December DPR report, Permian output continued its slow rise in January. It is expected to increase by 5 kb/d to 5,986 kb/d. The last five months of production data clearly show a dropping trend in monthly production growth.
What is remarkable about the December projection is that the production from September to December is the same in both the November and December DPR reports, note the overlapped red and green markers.
During November, 438 wells were drilled and 449 were completed in the Permian. (Note that November is the latest month for DUC information). The completed wells added 410 kb/d to November's output for an average of 913 b/d/well. The overall decline was 400 kb/d which resulted in a net increase to Permian output in November of 10 kb/d. Of the 449 completed wells in October, 438 were required to offset the decline . Those extra 11 completed wells producing at 913 b/d resulted in the 10 kb/d increase in November.
At this time information, the number of drilled and completed wells is not available to account for the 5 kb/d Permian production increase in January.
This chart shows the average first month total production from Permian wells tracked on a monthly basis. The total monthly production from the newest Permian wells in January is expected to be 414 kb/d and 4 kb/d higher than December.
Recall that this production of 414 kb/d is offset by a decline of 409 kb/d for a net overall output increase in the Permian Basin of 5 kb/d, actually 4.65 kb/d, the smallest recent monthly increase. The monthly increase in November was 9.8 kb/d. This all hints at slowing production growth in the Permian.
Output in the Eagle Ford Basin has been in a downtrend since August. December's forecast projects January output to decrease by 2 kb/d to 1,149 kb/d. The Eagle Ford's output for November was not revised in the December report.
At the beginning of the year 2023, 68 rigs were operating in the Eagle Ford Basin. The rig count began to drop in mid-March to 60 and slowly dropped further to 47 in November. December has seen an increase of 3 to 50 rigs.
The DPR forecasts Bakken output in January will be 1,308 kb/d, 2 kb/d higher than December. September 2023 to January 2024 production is now projected to be 63 kb/d higher than the post-pandemic peak of 1,245 kb/d in October 2020.
Note that the production from September to December has been revised up by 34 kb/d in the December report and accounts for most of the upward revision to DPR production.
The North Dakota government reported that October production dropped by 35 kb/d to 1,245 kb/d. The October drop was associated with a severe weather storm in North Dakota.
Note that in the Bakken chart above, September production shows a similar spike in production. The DPR is missing the October decline associated with inclement weather.
Output growth in the Niobrara continues to slow. January's output decreased by 1 kb/d to 690 kb/d.
Production increased starting in January 2023 due to the addition of rigs into the basin but stabilized at 16 ± 1 rigs in March and April. However, from August to December, the rig count has held steady at 14.
DUCs and Drilled Wells
The number of DUCs available for completion in the Permian and the four major DPR oil basins has fallen every month since July 2020. November DUCs decreased by 72 to 2,222. The average DUC decline rate since March has been 93 DUCs/mth. Of the 72 DUCs decrease in November, 29 came from the Niobrara, followed by 15 and 17 from the Bakken and Eagle Ford respectively.
In these 4 basins, 758 wells were completed while 686 were drilled. Both drilled wells and completions are down from higher levels in early 2023.
In the Permian, the monthly completion and drilling rates have been slowing since the March 2023 high of 545.
In November 2023, 449 wells were completed while 438 new wells were drilled. The gap between completed and drilled wells in the Permian is now very small compared to late 2022 and early 2023. Regardless, it is those extra completions that increase Permian production.
The Permian, as of November, had 821 DUCs remaining and the completion rate was 449 wells/mth. This means the current cycle time between drilling and completions is 1.83 months or 56 days .
Editor's Note: The summary bullets for this article were chosen by Seeking Alpha editors.
For further details see:
U.S. October Oil Production Held Steady