ACTV - U.S. Stock Market: On The Brink?
2023-03-30 05:29:05 ET
Summary
- We are seeing early warning signs that the U.S. stock market is headed for a bear market and the economy headed for a recession for several months now.
- Banks failing in the United States and Europe is just the next domino, and we see a resemblance to 2008.
- It seems like many market participants still ignore the risks and see many events as isolated incidents and not part of a systemic problem.
Last week I published an article about the collapses of banks in the United States as well as European banks being in trouble - Credit Suisse Group AG ( CS ) and maybe also Deutsche Bank Aktiengesellschaft (DB).
And while the banking crisis got most of the headlines, it is just one domino within a bigger picture. Without doubt, when banks are collapsing it creates huge problems - but not every banking crisis had to go hand in hand with a crumbling stock market (see the savings & loans crisis in the 1980s). And as investors, we are not just interested what will happen to banks, but rather what will happen to the stock market. In this article we will look at the bigger picture with the collapsing banks being only one part of the puzzle, just one jigsaw.
The Start: Early Warning Signs
I am not interested in charts comparing the current performance of an index to the past performance of the same index used to either demonstrate why the stock market will collapse in the next few weeks or to demonstrate why the next rally is immanent. Let's be honest, we will always find a time in history that resembles to some point the current price action of any stock or index, but I seriously question the informativeness of such charts.
That being said: Learning from history and identifying patterns is important. But we need to find patterns that happened again and again throughout history and not just find an event resembling current market conditions and assume the stock market will imitate price action from that period.
We need to look at patterns that have not only identified major turning points in the stock market several times in a row, but also produced close to zero false signals. An indicator that is correctly identifying every stock market top but gave also five false wrong warning signs in-between is useless. I identified five early warning indicators in my article "5 Indicators that might tell you about a recession before it happens".
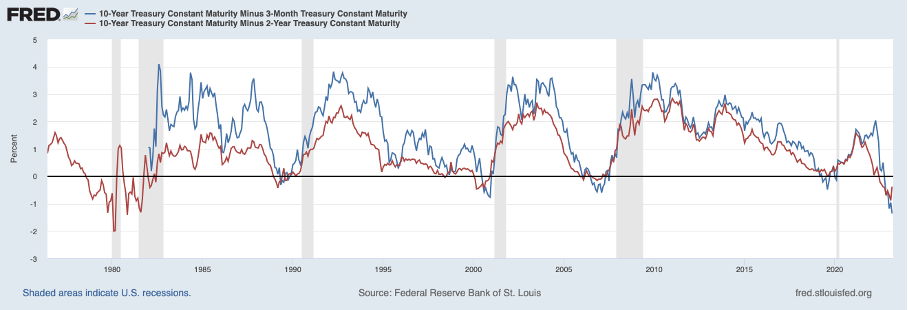
One of the most reliable early warning indicators is the yield curve inversion - that can be identified by the spread between the 10-year and 2-year yield as well as the spread between the 10-year and 3-months yield - which already rang the bell in October 2022 when both spreads dropped below zero. Since then, we have seen one of the most negative numbers ever.
And although we saw improving metrics recently, housing permits also declined rather steep and the ISM non-manufacturing PMI dropped below 50 in December 2022. These two are also early warning signs for a recession - in case of the non-manufacturing PMI, a drop below 50 signaled the last three recessions and there were basically no false signals.
Looking At 2008
The first step towards any recession or economic contraction are usually these early warning signs indicating trouble. Additionally, information about the economy being in trouble is already out there and some people are already warning about it but are mostly ignored and only a few people connect the dots.
The next steps are usually real events indicating trouble, but these events are often not enough to get people worried as they are seen as isolated incidents. In most cases, explanations are provided why these collapses, bankruptcies or delinquencies are isolated incidents - they are the result of "individual management mistakes" or just "bad luck". Instead, these events are often the first warning signs for deep, underlying problems and indicate systematic problems. Nevertheless, as long as just a few businesses are failing, only some banks collapsing or delinquency rates rising only slightly we seldom see panic and these events - after a first initial shock - are ignored again.
And a look back in history can help to provide some context - we are looking at the year 2008 and take a closer look at the events that happened. Looking back in history has one major advantage - we already know all the events and news stories; we know the events that happened a few weeks or months later and we also know how the stock market reacted in the next few weeks. Of course, the year 2008 is just one case study and a certain period in history. And while we can learn and draw comparison, we should not jump to conclusion based on just one example from history.
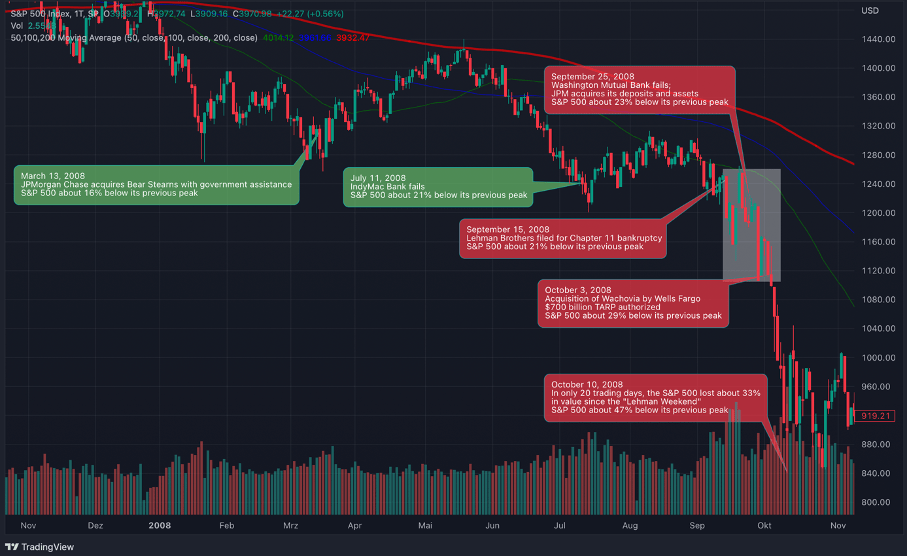
Chart S&P 500 in 2008 (TradingView)
When looking at the events during 2008 a few lessons are worth mentioning:
- After Bear Stearns collapsed in March 2008 and had to be "saved" by JPMorgan Chase, the stock market could increase in the coming weeks - although the collapse was a serious warning sign. And after IndyMac Bank failed in July 2008, we saw a similar pattern and the S&P 500 ( SPY ) could gain in value in the following weeks.
- After Lehman Brothers collapsed (and at least in hindsight everybody should have known at that point that the crisis is serious) the stock market declined in the following days but could also recover and it took till the beginning of October before everybody seemed to realize the crisis was serious and the stock market crashed.
- However, in the following days we saw a brutal sell-off and on October 10, 2008 - only 20 trading days after Lehman Brothers filing for bankruptcy - the S&P had lost 33% since the Lehman weekend.
When trying to sum up, we can put it like this: The stock market is no simple machine, and no linear system and stock market movements are certainly not the result of simple if/then patterns. It is not like the input "failing bank" leads to the output "declining stock market" the next trading day. The stock market (and the economy) is too complex to be described in such simple patterns. And the reason is quite simple: Not only events play a role and might influence the stock market, but also how market participants interpret these events (and interpretations may differ). Additionally, expectations of market participants about future events or the economy are playing a role as well as expectations of expectations (meaning, market participants are also trying to think about the expectations of other market participants and are trying to act accordingly).
For example: Betting on a stock market crash after the Bear Stearns collapse would have paid off eventually, but patience was necessary.
Where Are We Right Now?
And this brings us to the years 2022 and 2023 with rather similar patterns. Once again, we are just comparing two single events and finding pattern in only two different events or periods in history can be called interesting but is far away from being some form of "proof".
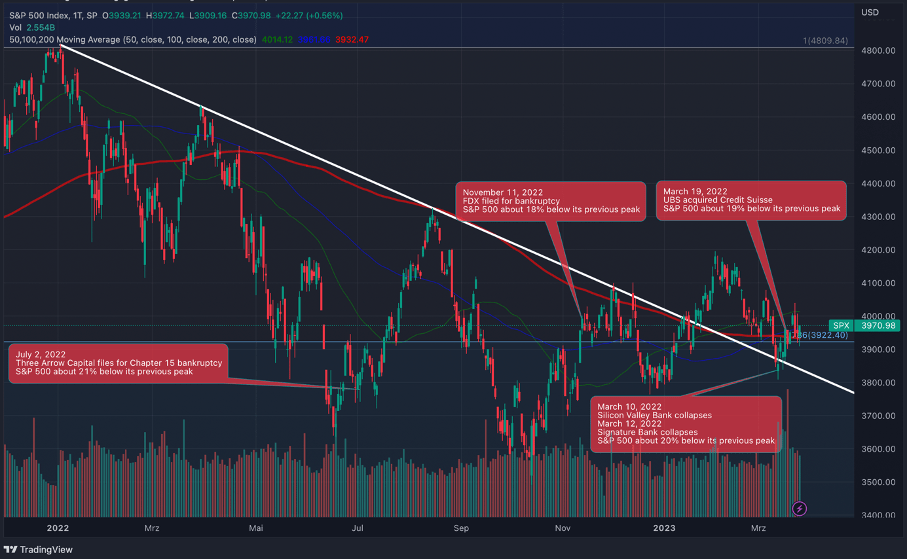
At first, it seems interesting that we are also about 20% below the previous peak. In 2008, the S&P 500 was also at a similar level when Bear Stearns or Lehman Brothers collapsed. I am not saying that 20% below the peak is somehow magical. It is just interesting that the S&P 500 was not really in bear market territory when the Lehman Brothers collapse happened. It should just show you that the S&P 500 does not have to be in a deep decline already when bad things for the economy and the stock market happen.
S&P 500 since January 2022 (TradingView)
The problem is that it sometimes just takes time before stock market participants realize the full extent of the events and the consequences.
Could The Stock Market Increase?
In 2008 we saw the stock market increase in the weeks following Bear Stearns collapse and in the weeks following the crash of IndyMac Bank. And of course, a similar scenario is possible this time and we might see increasing stock prices in the following weeks and months. Of course, when looking at the bad news and rather bearish sentiment right now with banks collapsing, it seems absurd to assume an increasing stock market. But as I mentioned above - and especially Avi Gilburt is never getting tired of explaining - the stock market and news stories are not correlated, but a complex system that can be influenced by several factors.
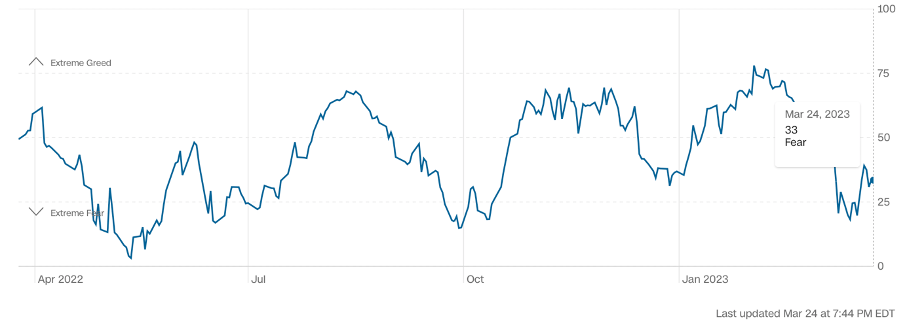
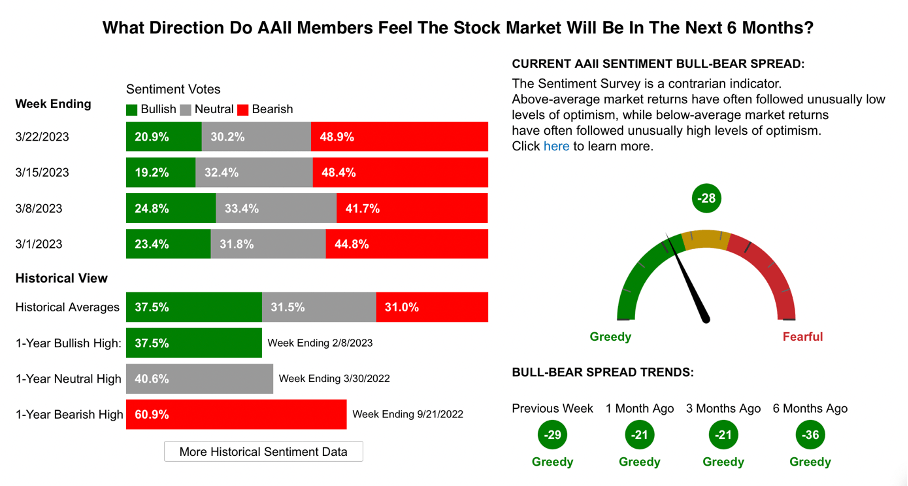
And when looking at the " Fear and Greed Index " one could argue that market participants are rather bearish right now, which could be the base for an increasing stock market in the coming weeks.
Additionally, the AAII survey is indicating in a similar direction with bearish sentiment rising in the last few weeks.
Additionally, when looking at the chart for the S&P 500, we can see a breakout above the white trendline and a pullback towards that trendline, which has been completed and is indicating higher prices in the coming weeks.
In my opinion it is possible to see an increase to 4,300 in the coming weeks or months. But I honestly have extreme difficulties to imagine the S&P 500 increasing much higher. Despite me explaining that the stock market is not connected to news events, we can't ignore the bigger picture with several warning indicators pointing towards a recession and the economy facing headwinds.
Market Is Ignoring Risks
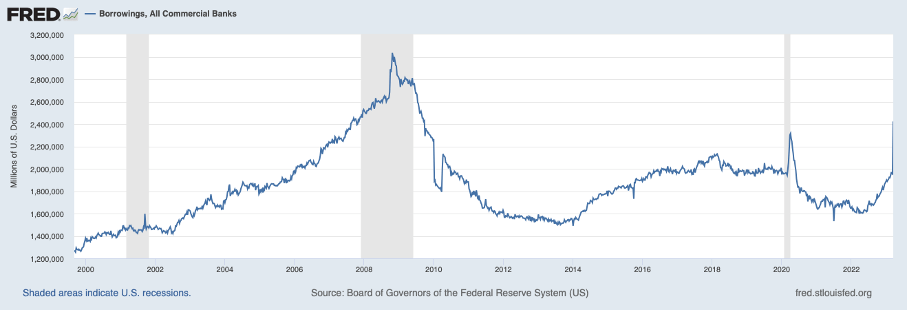
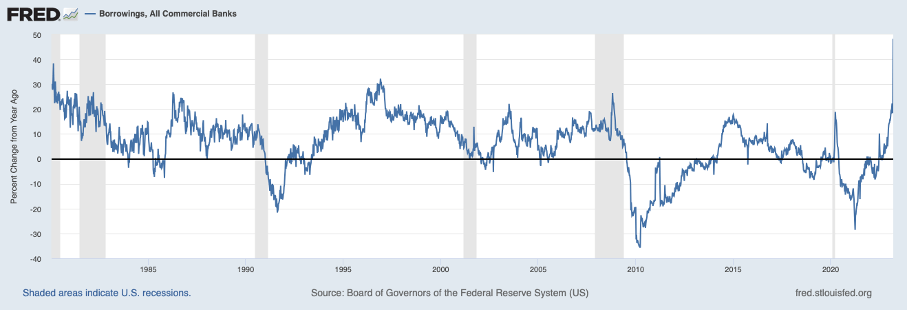
While we are talking about risks and everybody can see banks collapsing and is reading and writing about these events, the market seems to be ignoring these risks. However, this is also typical: We have several early warnings signs, and we have troubles arising. Still many market participants are either not willing to or actually can't see the connections and the bigger picture. But the warning signs are clearly out there - for example the increased borrowings by banks.
The number increased during the Great Financial Crisis as well as during the COVID-19 crisis, but at least since the 1980s we haven't seen a jump like this.
Another problem could be credit card debt with delinquencies slowly rising in the last few quarters. Of course, numbers are still as low as they haven't been at least since the early 1990s, but we also don't have data for 2023 yet.
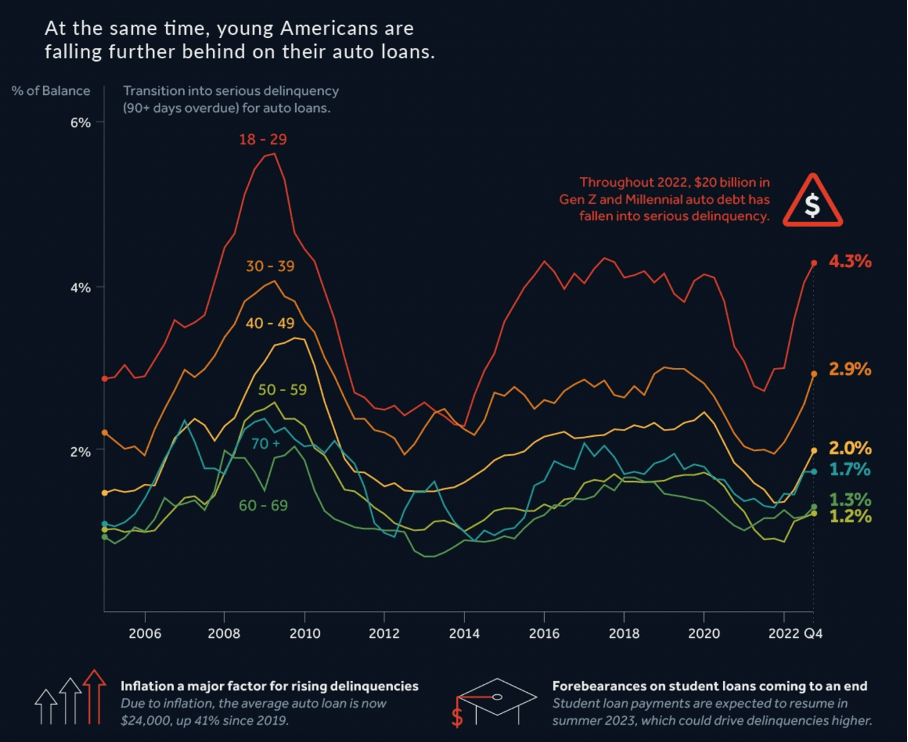
Car loan delinquencies are also rising - especially younger people are falling behind on their auto loans.
Of course, credit card debt is roughly $1 trillion and car loans are about $1.5 trillion and therefore only a fraction of the housing market. Nevertheless, we should not underestimate the ripple effects this could have on banks and the economy as a whole.
Additionally, we have many big tech companies laying off thousands of workers . However, when looking at the initial claims, the only conclusion can be that the U.S. labor market is still in excellent condition.
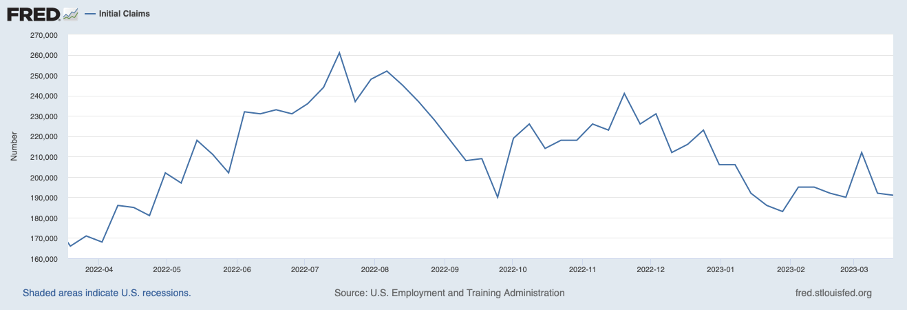
The major problem for investors is a fatal combination we are seeing right now - but which is also ignored or justified in different ways. We have on the one side an economy already in distress and showing signs of trouble. On the other hand, we have a stock market - exemplified by the S&P 500 - that is trading for one of the highest valuation multiples in history. And although the CAPE ratio declined already, a CAPE ratio of 29 is still not justified and nowhere close to a reasonable CAPE ratio.
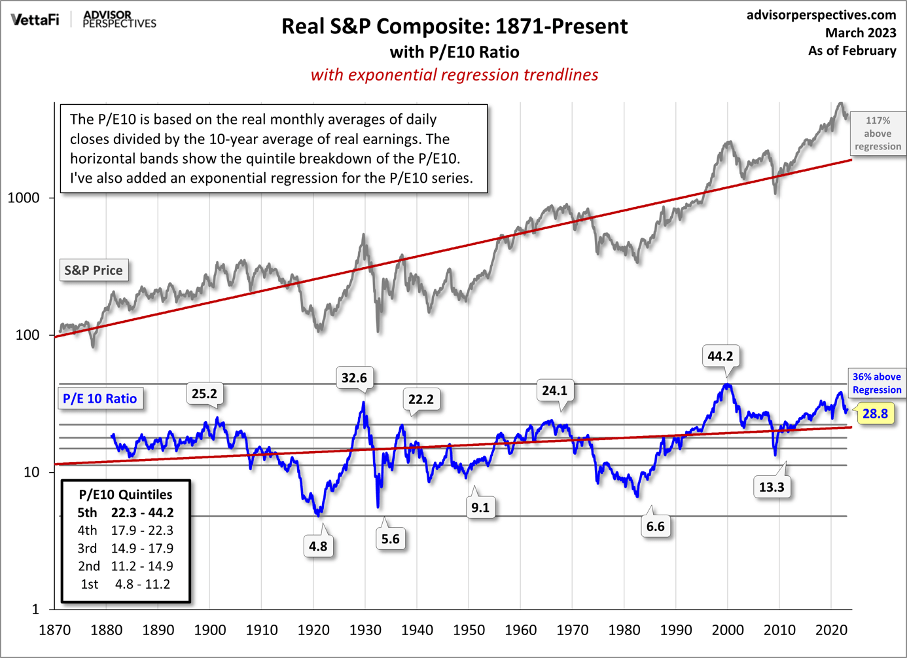
Conclusion
While we see similarities to 2008, we should not assume 2023 will play out in a similar way. Nevertheless, the warning signs for a severe crisis and recession are increasing. If we will also see another banking crisis like in 2008 or the 1980s - I don't know. But in the end, I see it similar as Ray Dalio who wrote in a recent blogpost :
I think that it is a very classic event in the very classic bubble-bursting part of the short-term debt cycle (which lasts about seven years, give or take about three) in which the tight money to curtail credit growth and inflation leads to a self-reinforcing debt-credit contraction that takes place via a domino-falling-like contagion process that continues until central banks create easy money that negates the debt-credit contraction, thus producing more new credit and debt, which creates the seeds for the next big debt problem until these short-term cycles build up the debt assets and liabilities to the point that they are unsustainable and the whole thing collapses in a debt restructuring and debt monetization (which typically happens about once every 75 years, give or take about 25 years).
And as I have outlined in past articles (see here and here) , I see the S&P 500 going to most likely 1,600 points over the next few years - of course it could bottom even lower (and in a rather unlikely scenario it could find its bottom higher). Of course, the S&P 500 could increase at first and going to 4,300 seems within the possible scenarios for the coming weeks - but I would not bet on increasing stock prices on a mid-term horizon (3 to 5 years).
For further details see:
U.S. Stock Market: On The Brink?