WSM - Upscale Retailer Williams-Sonoma Gets A Buy Rating Despite Overheated Share Price
2023-10-08 06:10:52 ET
Summary
- Williams-Sonoma gets a Buy Rating.
- Its strengths include multi-year dividend growth, low valuation, outperforming the S&P 500, and company capital strength/cash growth.
- Its offsetting factors include an expensive share price right now vs the moving average, and YoY drops in revenue and net income.
- The downside risk of the high interest-rate environment on this type of business has been discussed.
Analysis Summary
Today I'll be covering Williams-Sonoma ( WSM ) , in the consumer discretionary sector, subsector of retail homefurnishings.
According to its Seeking Alpha profile , it trades on the NYSE, is based in San Francisco, and serves as omni-channel specialty retailer of various products for home.
One of its listed peers is Wayfair ( W ), but I want to mention that another retail competitor in the US that I know of is Crate & Barrel . The Williams-Sonoma brand is a common sight when I visit various shopping malls in the US, and as soon as you enter one of their stores you are immersed in the brand which is a focus on upscale home furnishings. Also, the Pottery Barn brand of stores is also owned by Williams-Sonoma.
In today's article, I gave this stock a buy rating, due to having more strengths in my review than offsetting factors.
Its strengths include dividends, valuation, capital & liquidity, and performance vs S&P500.
Its offsetting factors include revenue growth, net income & EPS, share price.
A downside risk to my bullish outlook that I can foresee is the increasing cost of debt due to high rates.
Analysis Methodology
My updated rating methodology as of October 2023 is to analyze the stock holistically across the following 7 categories of equal weight, and if it has more strengths than offsetting factors it gets a buy rating, otherwise will get a hold or sell rating:
dividends, valuation, revenue growth, net income and EPS, capital and liquidity, share price vs moving average, performance vs S&P 500.
All data sources come from publicly available info such as the most recent quarterly report and company presentations, Seeking Alpha data, and media reports.
The anticipated next quarterly earnings release is expected on Nov. 16th for fiscal 2023, Q3, which ends Oct. 31st. Their most recent reported quarter was fiscal 2023, Q2 which ended July 30th, released in late August.
Dividends
Here I discuss the dividend yield , 10-year dividend growth, and dividend stability over the last few years. As a dividend-focused analyst and investor, I believe these are vital metrics to look at.
Though not all investors are dividend-oriented, including many of my readers, I do think generally-speaking it can be a way to generate cashflow while holding an equity longer-term.
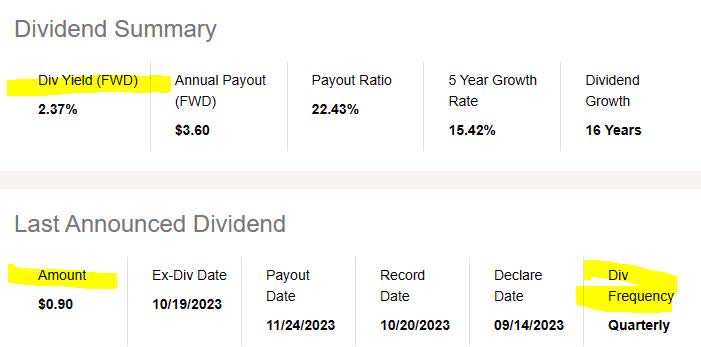
First, let's look at the dividend yield , which is 2.37% as of the writing of this article, along with a dividend payout of $0.90 per share, on a quarterly basis.
Williams Sonoma - dividend yield (Seeking Alpha)
Whether or not I think it is a good yield depends how it compares to the industry it is in, and not to other industries.
In comparison to its sector average, this yield is 8.01% below the average. I consider this only a slightly negative point as I am looking for a yield between 2% and 4% when considering the sector/industry. With that said, my target for a yield would be 3%, so this stock has a yield that is slightly lower than my goal.
I consider yield important because it tells me a story: how much of a return I am getting on the capital invested, in terms of dividend income. A sudden drop in share price, as you may know, can result in a higher yield if the dividend amount remains the same.
Williams Sonoma - dividend yield vs sector (Seeking Alpha)
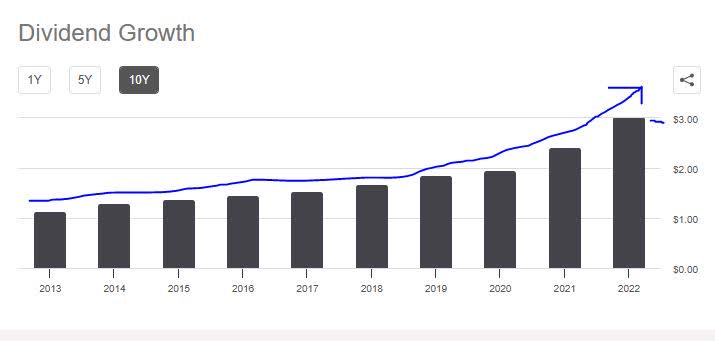
Next, I am looking at the 10-year dividend growth rate, shown in the chart below, which shows a steady growth. I think that is a positive point and I always look for a good dividend growth story to tell, backed by the data. The story here is one of growth.
Williams Sonoma - 10 yr dividend growth (Seeking Alpha)
Finally, I want to see dividend payout stability, especially if you are relying on the steady quarterly cashflow.
In looking at the table below, you can see stable payouts over the last few years, with 3 dividend increases in this time period. A cashflow scenario: if I was holding 1,000 shares, for example, I could realize $900 in quarterly cashflow from the dividends on this stock. (1,000 shares x $0.90 per share).
Williams Sonoma - dividend stability (Seeking Alpha)
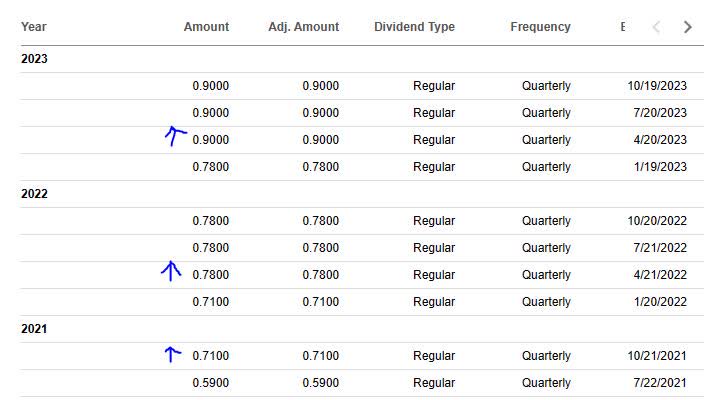
Based on the evidence, I consider the category of dividends a strength for this stock, on the basis of steady dividend payouts and dividend growth outweighing the yield that is slightly below average.
Valuation
To simplify analyzing the valuation , I have chosen a single metric to focus on, and that is the price-to-earnings ratio (P/E) , both the trailing and forward P/E, as it tells me what the market is pricing this stock at in relation to its earnings.
My portfolio goal is to find a valuation lower than or close to the sector average, but not too much higher. Sometimes a stock is undervalued but otherwise has strong fundamentals, so that is a company I want to uncover.
Williams Sonoma - PE ratio (Seeking Alpha)
In the case of this stock, the trailing P/E is 10.41, which is 30.31% below the sector average , and the forward P/E of 10.83 is 23.8% below the sector average.
Hence, I would consider this stock undervalued compared to its industry, both on a trailing and forward basis.
Based on the data, I think this valuation metric is a strength for this stock.
Revenue Growth
One topic many analysts and investors look at is the top-line revenue growth, as a metric tracking revenue generated before expenses, to put it simply.
Manageable growth is important, in my opinion, because companies have competition and are striving to capture market share in their sector.
For this company, we can see from the most recent quarterly results that it achieved a YoY decrease in total revenue :
Williams Sonoma - revenue YoY (Seeking Alpha)
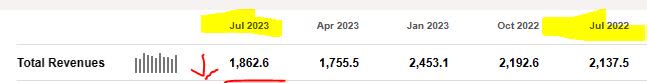
At first glance, I think this is a negative for this company.
Looking further into the company's most recent reported quarterly results, the firm has actually revised revenue projections downward.
According to the company, "we now expect annual revenues to come in at a range of down 5% to down 10%."
From a forward perspective, they added:
Over the long-term, we continue to expect mid-to-high single-digit annual net revenue growth with operating margin above 15%.
In breaking down net revenue by the company's various brands, we see that all of the brands they own have YoY declines in net revenue. However, the company did not provide any commentary specific to what was driving headwinds to its brands.
Williams Sonoma - net revenue by brand (company earnings release)
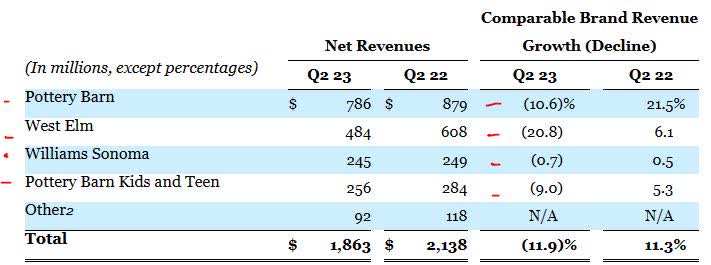
Overall, I think the data shows that top-line revenue YoY growth is an offsetting factor for this stock's rating.
Net Income and EPS
Net income and earnings per share are getting their own section here to make the analysis easier to understand and to separate these results from top-line revenue.
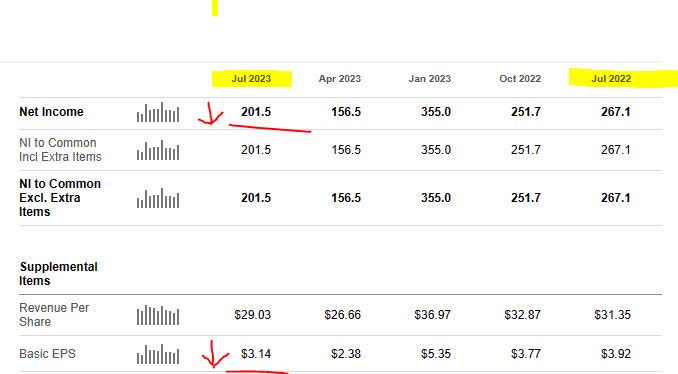
Based on the most recent quarterly results available, this firm achieved a YoY drop in net income and the basic earnings per share “EPS” decreased on a YoY basis .
Williams Sonoma - net income & EPS (Seeking Alpha)
I also want to call out the following from the company's most recent earnings report, which shows that interest expense rose drastically on a YoY basis when comparing fiscal Q2 this year vs the year prior:
Williams Sonoma - interest expense (company quarterly earnings)
Keep in mind that running a chain of upscale retail stores nationwide is a very capital-intensive business with much overhead, so sales volume is vital, yet it is evident from just walking into any mall or having worked seasonally in one as a student that the peak sales period is the holiday season (November through New Years).
If you look again at the net income table as well as the revenue table, you can see that the quarter ending January was the best quarter for revenue and net income for this company.
I think, therefore, that this category of net income and EPS is an offsetting factor for this stock's rating, and as analysts / investors we have to consider the seasonality of this type of business model.
Capital and Liquidity
Here we'll focus on one or more items related to capital and liquidity strength of this stock's parent company.
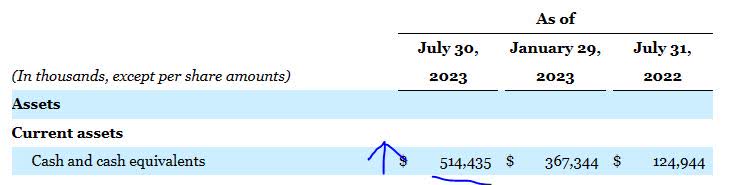
The following is relevant data from the company's quarterly earnings results that I want to call out, which is a steady increase in company cash, which I think is a positive trend. Remember the saying, cash is king , especially in a business model with such high overhead:
Williams Sonoma - cash position (company earnings report)
Further, here is additional data of interest, which points to a decrease in total liabilities since the year prior, also a positive I think.
Williams Sonoma - liabilities (company quarterly report)
From its cashflow statement we can see that the firm has positive free cash flow both levered and unlevered as well as positive free cashflow per share. This is a good direction I think.
I think that the equity along with the cashflow definitely adds confidence to this stock's rating, backed up by strong company financial health.
Based on the evidence found, I consider this firm's capital and liquidity situation a strength to its overall rating.
Share Price vs Moving Average
Now we've come to the part where I like to talk about the share price and whether I think it's a buying opportunity right now or not.
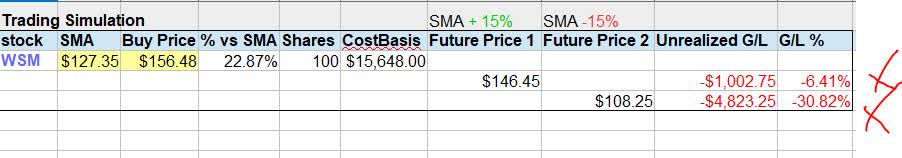
First, let's take a look at the share price and 200-day moving average "SMA" as of the writing of this article:
The share price of $156.48 is almost 23% above the 200-day SMA which stands at $127.35 . I think this moving average is a good long-term trend indicator which is why I track it.
In my portfolio goal, I am looking for crossover opportunities, where the price crosses below the moving average after a period of bullishness, which I consider a buy signal as long as other fundamentals are strong. However, a buy opportunity could also exist if the price is hovering around the moving average.
This chart shows a crossover already occurred in June, followed by a bullish rebound. So, to test the share price against my portfolio goals I created the following simulated trade scenario. I buy 100 shares at the current price, hold 1 year, and want to achieve at least a 10% or better (unrealized) capital gain at that time.
In addition, in anticipation of losses as well, I have set my maximum loss tolerance as -20% (unrealized capital loss).
Williams Sonoma - trade simulation (author analysis)
The above simulation shows two scenarios, one where the future share price rises +15% above the current 200 day SMA, and the other where it drops -15% below the SMA.
The outcome of both scenarios is that they are not in line with my goals for gains and losses. In the first scenario, my projected loss is -6.4% and in the second scenario I am projecting a loss of -30.8%.
Based on this simulation, I think the current share price is an offsetting factor, and essentially too expensive at this time.
Though your portfolio strategy may differ, consider this section a general and simplified framework with which to think about this stock in a longer-term sense, in which time one can expect potential gains as well as losses, so establishing a maximum risk tolerance is important.
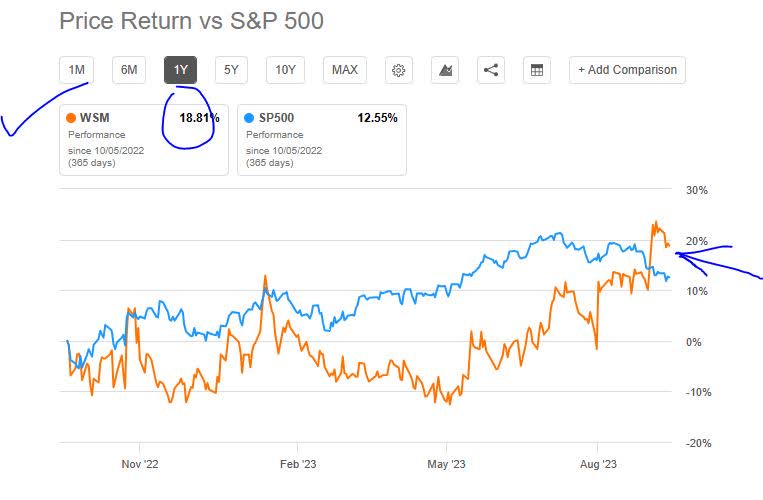
Performance vs S&P 500
The following is a comparison of the 1-year price performance of this stock vs the S&P 500 index. I have included this metric in my updated rating methodology so as to compare this equity to a major market index that is tracked often, and whether it was able to outperform it or not.
I consider this relevant because it shows the market momentum for this stock. It may be a great company fundamentally, the market reality is that other investors influence the share price based on demand for the stock, so comparing it to this major index could add some clues as to market sentiment.
William Sonoma - performance vs S&P500 (Seeking Alpha)
The data shows the stock outperforming vs this index , which I consider an strength to my rating, as I believe it to indicate a bullish market sentiment for this stock. If you correlate this to the price chart I showed earlier, the bullishness is evident.
Risk to my Outlook
A downside risk to my bullish outlook that I am concerned about is the increasing cost of debt, due to the elevated rate environment. I already showed that the YoY interest expense for this company has gone up a lot, and again it depends on how its debt is structured it may be impacted by the fact that the Fed is not in a rush to lower its policy rate yet, which also can affect all other interest rates.
This could have an impact on consumers as well since it costs more to buy things on credit cards.
However, a study earlier this year by JP Morgan pointed to the resilience of the upscale sector:
During the current cost-of-living crisis, consumers are cutting back on spending — but demand for luxury goods remains high . In the fourth quarter of 2022, the luxury market grew 7% organically year-over-year, figures from J.P. Morgan Research show.
So, I think that this retailer will likely steer through the headwinds, and the Fed appears to be tapering back on rate hikes, even though they are still elevated.
Like mentioned earlier, these are seasonally-driven business models so let's hope for a strong holiday season coming up right around the corner, and I think it may take a few more quarters of reporting to really see an impact by the end of January perhaps when we should revisit this stock again.
In closing, my bullish sentiment on this stock remains and my buy rating stands.
For further details see:
Upscale Retailer Williams-Sonoma Gets A Buy Rating Despite Overheated Share Price