CA - URA Vs. URNM: Which Is The Better Uranium ETF?
Summary
- URA and URNM are the two main ETFs offering equity exposure to the uranium space.
- URA may look better at first glance – it has better expense ratio, liquidity and discount to NAV.
- On the other hand, URNM is the purer-play uranium bet, as URA has holdings outside the sector.
Many investors, myself included, believe that uranium is the solution to the energy transition challenge. However, the nearly decade long uranium bear market has wreaked havoc in the miners space. Many companies were forced to shut down, due to low market prices of the commodity. As a result, nowadays the uranium space has very few producers, while most companies are explorers/developers. The latter are a lot riskier than producers, since there’s permitting, exploration and initial capital investment inflation risk. So obtaining a diversified uranium exposure by picking individual names may be a challenge. This is where ETF’s come to the rescue. The three most common instruments used for that purpose are the Sprott Physical Uranium Trust ( SRUUF ), the Global X Uranium ETF ( URA ) and the Sprott Uranium Miners ETF ( URNM ). While the first one is tracking the commodity itself, the latter two are offering exposure to uranium equities. More risk-seeking investors will likely choose equity exposure, since it generally offers leverage on the commodity price itself. For that reason, I’ll compare URA and URNM in order to assess which is the better uranium ETF. Each of them has its own advantages and disadvantages, but when it comes to pure-play uranium equity exposure, I think URNM has the upper hand.
A high level view
| URNM |
| URA |
| Inception date |
| 03 Dec 2019 |
| 04 Nov 2010 |
| AUM |
| US$814M |
| US$1.47B |
| Expense ratio |
| 0.85% |
| 0.69% |
| Number of holdings |
| 36 |
| 53 |
| Premium/Discount to NAV* |
| -0.48% |
| -1.18% |
| Average daily turnover |
| US$12.9M |
| US$37.8M |
| Top 10 positions share of total |
| 76.5% |
| 61.6% |
| Dividend payments |
| ? |
| Yes |
Source: Sprott; Global X; Seeking Alpha
* as of 23 December 2022
Looking at the highlights of both ETFs, it seems at first glance that URA has the upper hand – it has lower expense ratio, larger discount to NAV, more liquidity, less concentration into its top 10 positions and has more AUM. When it comes to dividend payments, URA makes semi-annual distributions to shareholders by passing through the income it received from its holding companies. When it comes to URNM, things are more complicated. According to the latest available prospectus , a similar policy to that of URA should be followed. However, it appears that the shareholders won’t be receiving a dividend for 2022, but I wasn’t able to find any changes in the distributions policy.
Correlation to the uranium price
The aim of ETFs that offer equity exposure to a certain commodity is to give leverage to the particular commodity. In the case of URA and URNM, their correlation with SRUUF as a proxy for uranium could be a sign as to what extend they follow the price of the commodity.
While the latest figures for URNM are better, most of the time both equity ETFs followed very similar patterns in terms of correlation as evident from their very high correlation with each other. That being said, the best indication of the sensitivity to uranium could be obtained by a deep dive in the holdings of both ETFs.
Holdings breakdown
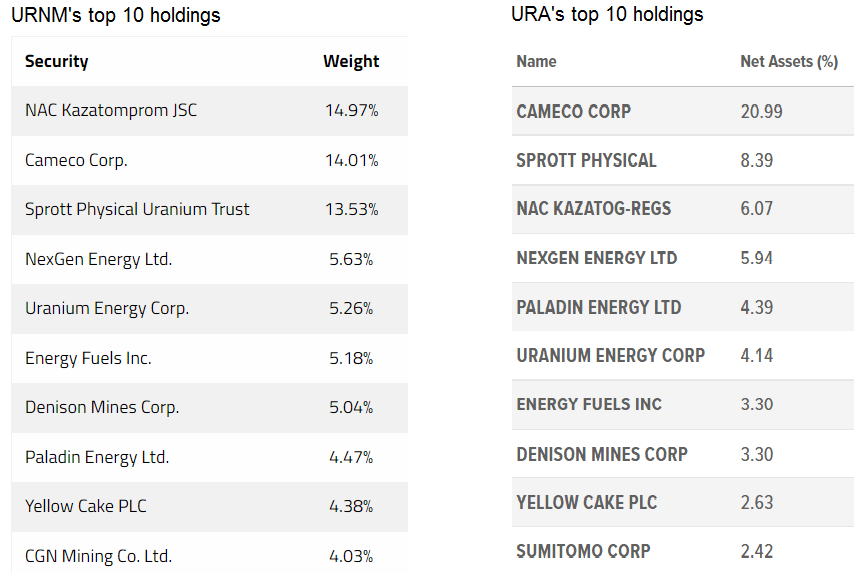
Looking the top 10 positions of the two ETFs, while URNM is more concentrated than URA (76.5% vs. 61.6%), URA has larger concentration to a single security – Cameco Corporation ( CCJ ). However, the latest strategic business move by the company – the acquisition of 49% stake in Westinghouse signals that the Canadian major will likely try to vertically integrate into the nuclear energy business, which will move it away from being pure-play uranium miner. On the other hand, URNM’s top position with almost 15% share in total assets is Kazatomprom (KAP: LSE), which is the largest and lowest cost public producer of uranium.
URNM's and URA's top 10 holdings (Sprott; Global X)
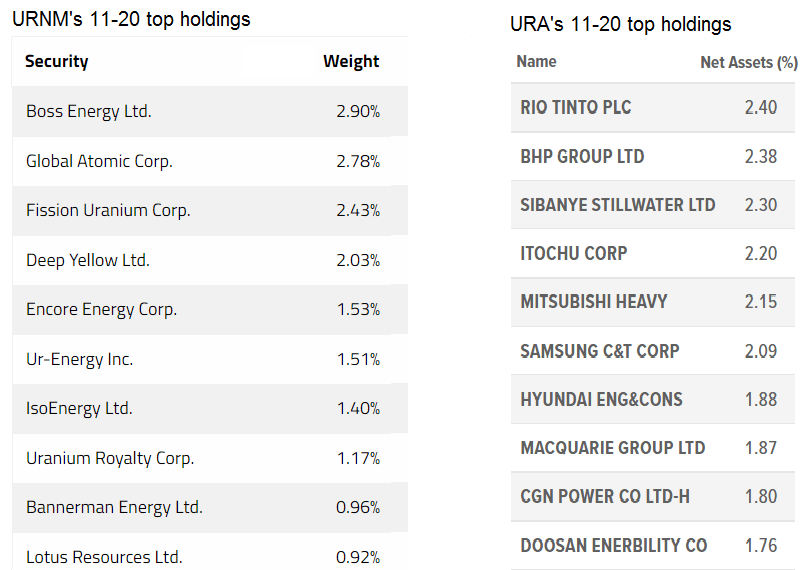
Overall, looking at the total holdings of the two ETFs, I estimated the overlap between the two at around 63.4%. The remaining 36.6% will be what makes the difference as to which is the better uranium ETF. While the top 10 positions of URNM and URA are quite similar, the presence of Sumitomo Corporation ( SSUMF ) in URA’s holdings may seem a bit odd. While it has some involvement in the uranium business, it’s quite hard to make the case for the Japanese conglomerate being sensitive to the price of the commodity, given that the overwhelming majority of revenue comes from other sources. Looking at the 11-20 ranked holdings in terms of market cap of the two ETFs gives an even better idea as to which is the pure-play uranium ETF.
URNM's and URA's top 11-20 holdings (Sprott; Global X)
While in the case of URNM, all holdings ranked 11-20 in terms of weight are pretty much pure-play uranium companies, exactly the opposite is true for URA. The latter has in its portfolio multi-billion conglomerates or mining majors, where the uranium exposure is quite miniscule. I suspect that even if the price of the commodity doubles, none of these conglomerates will have a meaningful move in its share price. Based on that, I think that although URA is better diversified, URNM is the pure-play uranium bet and will do better in a uranium bull market.
Performance
YtD, both ETF’s have yielded negative returns for their shareholders, with URA’s doing about 1.2% better than URNM. This is reflective of the uranium price being only slightly higher than in the end of 2021, while cost inflation has hit mining companies in terms of operating expenses as well as initial capital required to put a project into production. However, zooming out to 2020 and 2021, when uranium had some sharp upward moves, it’s clear than URNM yields better returns in a bull market.
Conclusion
Investors who seek pure-play exposure to uranium equities through an ETF, shouldn’t be deceived by URA’s better key highlights like the lower expense ratio and slightly larger discount to NAV. While URA also has higher average daily turnover, URNM hardly could be characterized as illiquid, especially for retail investors. When it comes to probably the most important factor – pure-play uranium exposure, URNM clearly has the upper hand and is the better choice to position for a bull market.
For further details see:
URA Vs. URNM: Which Is The Better Uranium ETF?