META - VGT Has Become A Mediocre Tech Sector ETF; IYW Is Consistently Better
2023-07-31 07:30:00 ET
Summary
- Because it tracks the GICS Technology Sector which has been weakened by arbitrary changes I recommended investors seek alternatives to VGT in March 2022. Here we track their performance.
- The alternatives we look at are IYW, FSPTX, QQQ, and IETC.
- We examine their holdings and look at their performance over three different intervals going back to GICS's earliest and most destructive 2018 changes.
- IYW emerges as the most consistently high performing of these investments for reasons only partially explained by its independence from the GICS sector definitions.
One of the things I do to keep myself honest is follow up on how suggestions I make in my investing articles play out over time. In both February and April of 2022 I wrote two articles pointing out that the GICS's definition of what stocks belong in the Information Technology sector have been intentionally changed by the organization in ways that have damaged investors who own the Vanguard Information Technology ETF ( VGT ).
That is because the GICS sector definition is the one used to create the index tracked by the Vanguard Information Technology ETF. Another ETF, the Technology Select Sector SPDR Fund ( XLK ) also uses that same GICS sector definition, but it only holds the 68 stocks from the Information Technology sector that are also included in the S&P 500, where VGT holds all 322 stocks that the GICS classification system assigns to that sector.
At the end of the March article I suggested some alternatives for investors who wanted to invest in Technology using investments that did not use the GICS definition of the Tech sector.
You can read those articles, which will give you a more detailed look at how the GICS Technology sector definitions were changed in 2018 and 2022 here . My suggestion to ditch VGT can be found here . Note that I owned shares in VGT at the time I published both articles but sold them and took profits shortly afterwards.
In this article I am going to look at how the alternative Tech investments discussed in that article, which don't follow indexes that track the GICS-defined sector, performed relative to each other and VGT. Were there better alternatives for Tech investors now that the GICS sector has made major changes to its classification system? If so, what seems to be the best, and, finally is a better alternative likely to continue to outperform VGT?
GICS's Changes Since 2018 Have Removed Very Profitable Stocks from the Tech Sector
Before we look at how the new GICS sector has performed let's review exactly what it was that GICS has done to its selection of stocks assigned to the Technology Sector over the past five years, keeping in mind that this has been a period when it has largely been a handful of Tech stocks that have driven the outsized gains made by stock investors.
In 2018 GICS removed Alphabet ( GOOG ) ( GOOGL ), and what was then Facebook ( META ), from their Technology index. In March of 2022 they announced they would be removing all Data Processing and Outsourced Services stocks from that index. The axed stocks included heavy-hitters, Visa ( V ), Mastercard ( MA ), PayPal (PYPL) and Automatic Data Processing ( ADP ) along with a host of other, smaller companies. With just the changes made in 2022 the stocks to be removed from the Tech sector and moved into other sectors made up almost 10% of what had been the GICS Tech sector before March 2022. It is difficult to calculate what percentage of the original ETF the loss of Alphabet and Meta, which were removed back five years ago made up.
Given the significant changes made in 2022, coming on the heels of the earlier removal of Alphabet and Meta, I wrote back in 2022 that VGT was no longer the optimal way to invest in Technology.
What Are The Alternatives to Investing in GICS Sector ETFS for the Tech Investor?
The alternatives I identified in my 2022 article were the passive iShares U.S. Technology ETF (IYW), which tracks an index that uses the ICB sector classification framework, and an active mutual fund, The Fidelity® Select Technology Portfolio ( FSPTX ). Readers suggested two other alternatives in the comments section of that article, the Invesco QQQ Trust ( QQQ ) and the iShares U.S. Tech Independence Focused ETF ( IETC ). Let's take a closer look at them.
IYW
A quick look at the holdings of the iShares U.S. Technology ETF tells us that IYW holds far fewer stocks than VGT, 136 as opposed to VGT's 322. Unlike VGT it still holds shares in Alphabet and Meta, which GICS dropped in 2018. Those two stocks alone make up 13.92% of the total value of IYW as of July 28, 2022.
IYW's .39% expense ratio is higher than that of VGT's .10%.
Though most of the stocks held in IYW are defined as being in the GICS Information Technology sector, quite a few are not. Here is a list of all the stocks it holds that are in other sectors.
| Ticker |
| Name |
| GICS Sector |
| Weight |
| Exchange |
| GOOGL |
| ALPHABET INC CLASS A |
| Communication |
| 5.29 |
| NASDAQ |
| GOOG |
| ALPHABET INC CLASS C |
| Communication |
| 4.6 |
| NASDAQ |
| META |
| META PLATFORMS INC CLASS A |
| Communication |
| 4.03 |
| NASDAQ |
| ( PINS ) |
| PINTEREST INC CLASS A |
| Communication |
| 0.19 |
| NYSE |
| ( MTCH ) |
| MATCH GROUP INC |
| Communication |
| 0.14 |
| NASDAQ |
| ( ZI ) |
| ZOOMINFO TECHNOLOGIES INC |
| Communication |
| 0.09 |
| NASDAQ |
| ( IAC ) |
| IAC INC |
| Communication |
| 0.06 |
| NASDAQ |
| (DASH ) |
| DOORDASH INC CLASS A |
| Consumer Discretionary |
| 0.3 |
| NYSE |
| ( TOST ) |
| TOAST INC CLASS A |
| Financials |
| 0.08 |
| NYSE |
| (PAYC ) |
| PAYCOM SOFTWARE INC |
| Industrials |
| 0.21 |
| NYSE |
| ( LDOS ) |
| LEIDOS HOLDINGS INC |
| Industrials |
| 0.14 |
| NYSE |
| (SSNC ) |
| SS&C TECHNOLOGIES HOLDINGS INC |
| Industrials |
| 0.14 |
| NASDAQ |
| ( CDAY ) |
| CERIDIAN HCM HOLDING INC |
| Industrials |
| 0.12 |
| NYSE |
| (KBR ) |
| KBR INC |
| Industrials |
| 0.09 |
| NYSE |
| ( VRT ) |
| VERTIV HOLDINGS CLASS A |
| Industrials |
| 0.09 |
| NYSE |
| (CACI ) |
| CACI INTERNATIONAL INC CLASS A |
| Industrials |
| 0.09 |
| NYSE |
| ( SAIC ) |
| SCIENCE APPLICATIONS INTERNATIONAL |
| Industrials |
| 0.07 |
| NYSE |
| (CLVT ) |
| CLARIVATE PLC |
| Industrials |
| 0.05 |
| NYSE |
| ( CNXC ) |
| CONCENTRIX CORP |
| Industrials |
| 0.04 |
| NASDAQ |
| (DNB ) |
| Dun & Bradstreet HLDG INC |
| Industrials |
| 0.04 |
| NYSE |
| PYCR |
| PAYCOR HCM INC |
| Industrials |
| 0.02 |
| NASDAQ |
Note that it did not hold shares of the major data processing stocks removed from the GICS sector before the March 2022 change. You will recall that those stocks were Visa, Mastercard, PayPal, or ADP. It also does not hold the many small semiconductor companies VGT holds. Note however, that like VGT, IYW does not hold shares of Amazon ( AMZN ). Despite its large presence as a Cloud provider, these ETFs still treat Amazon as a retail stock.
FSPTX
The active Fidelity mutual fund, Fidelity® Select Technology Portfolio, FSPTX, is a No Transaction Fee (NTF) fund available at other brokerages besides Fidelity. It has been trading since 1981. It has a much higher expense ratio than the other ETFs we are discussing--.70%. It does hold Mastercard among its top holdings (as of 6/30/2022) and appears to be relatively market cap weighted. It holds even fewer stocks than IYW, only 86 stocks which represent shares in only 72 companies. Its current top holdings are:
FSPTX Top Holdings (Fidelity)
Since it is an active mutual fund that does not follow a published index, it does not make public the complete list of its holdings. Investors should keep in mind that even its top 10 holdings, which it does disclose, and their weights, could change at any time.
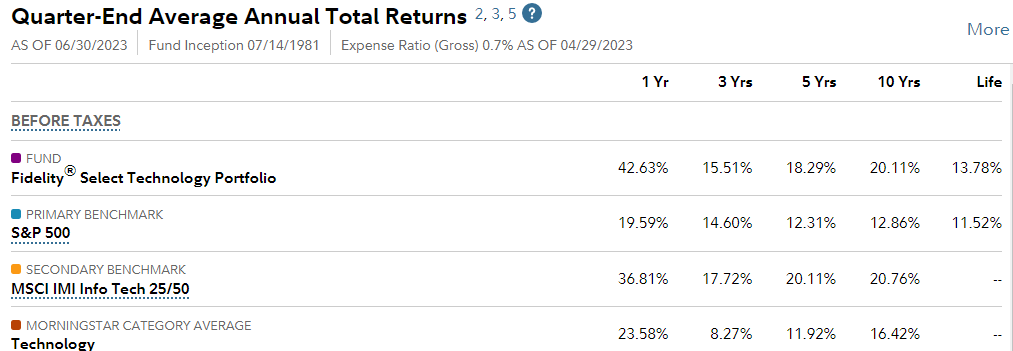
Below you can see how its performance over time compares to several different benchmarks, including the MSCI index that follows the GICS Technology definitions.
FSPTX Performance Vs. Benchmarks (Fidelity)
As you can see at some intervals has outperformed its benchmarks strongly, particularly over the past year. But over longer intervals it has lagged.
Investors investing in taxable accounts should be aware that FSPTX has distributed significant amounts of capital gains over the past few years, which has not been the case with VGT.
FSPTX Capital Gains Distributions
Fidelity
QQQ
In the comment section of that article, readers suggested two other options: One was the Invesco QQQ Trust ( QQQ ), which admittedly is what most investors seem to turn to when they want a Technology tilt. However, it is good to keep in mind, as I have pointed out in several articles, that QQQ is only accidentally a tech-heavy ETF. The only criterion for its selection of stocks is that they be among the 100 stocks with the largest market caps which IPOs on the NASDAQ exchange. Since so many 1980s and 1990s Tech stocks listed on that exchange, as it was cheaper than the better established New York Stock Exchange, QQQ is currently Tech heavy, though there is no guarantee that it will remain that way.
Note in the list of stocks in IYW how many of the non-Tech sector stocks it holds were listed on the New York Stock Exchange and hence are not eligible to be held in QQQ.
IETC
The other investment suggested by a reader commenting in the March 2022 article was the iShares U.S. Tech Independence Focused ETF a relatively new active ETF that started trading in 2018. Its .17 expense ratio is higher expense ratio than VGT's (.10%) but lower than IYW (.39%), at .17%, which is to be expected of an actively managed fund. What is interesting about it is how refreshingly different the weighting of its holdings is from that of market cap weighted ETFs and Funds we have looked at previously.
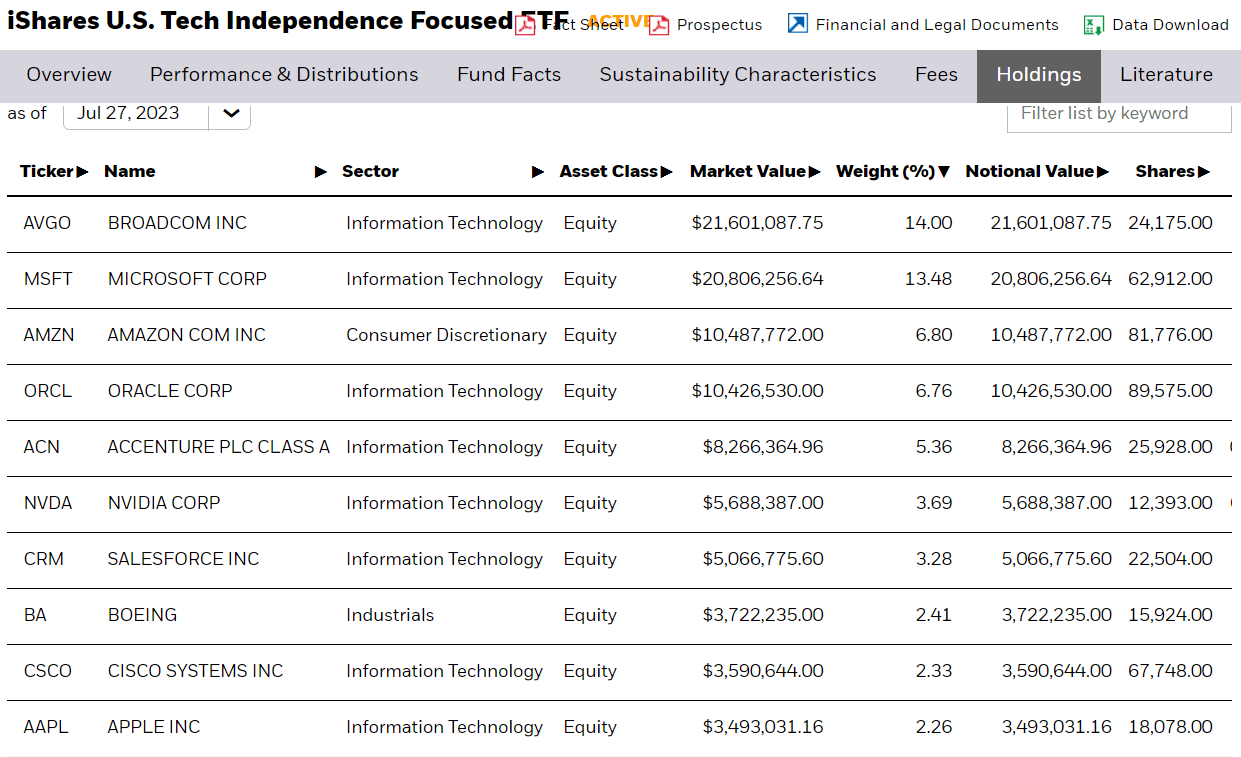
Here are its current top 10 holdings:
IETC Top 10 Holdings (iShares.com)
As you can see, unlike the other investments we have just reviewed, IETC does hold Amazon. It also holds small amounts of Visa and other data processing firms.
How Have These Tech Investments Performed Since April 2022?
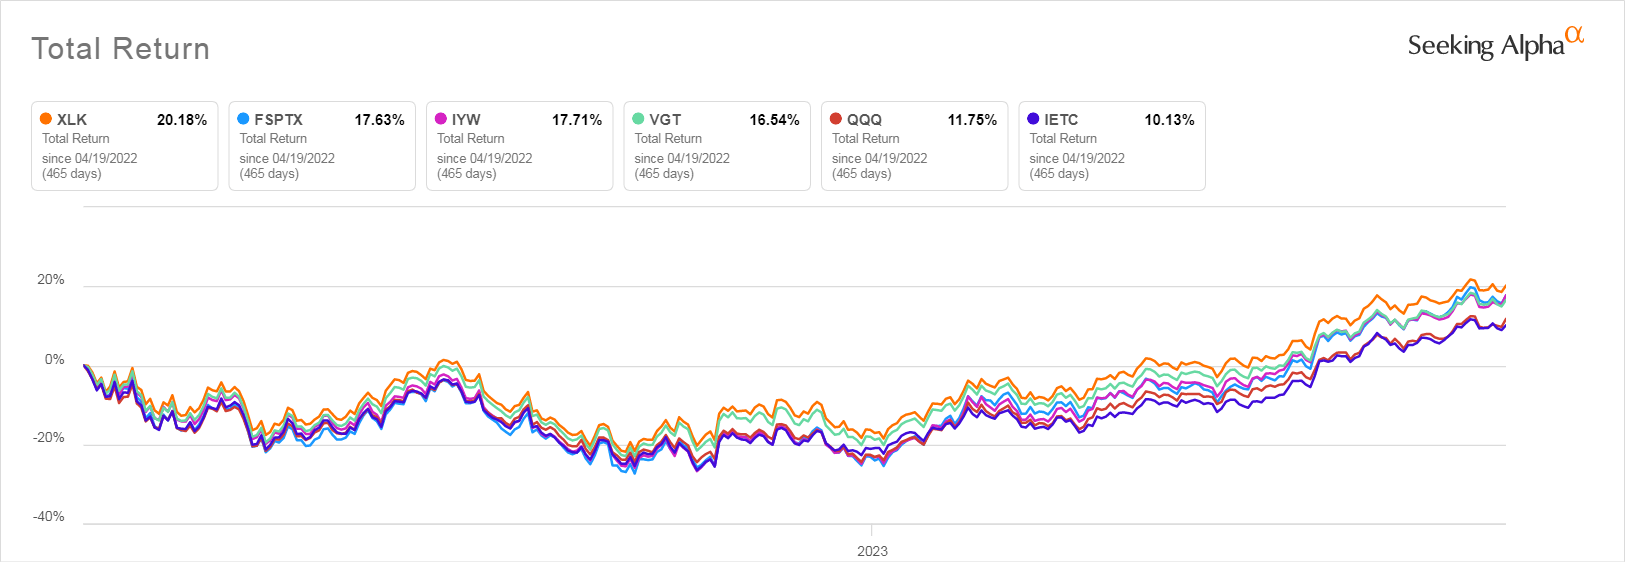
Below you see how these investments have performed since publication of my April 17, 2022 article. I have arranged the ETFs and Fund in order of their total return.
Tech ETFs & Fund Total Return 4/18/2022 - July 28, 2023
As is clear from this chart, all these investments rose and fell in a similar pattern, though their total return differs a lot from one to another.
VGT, tracking the entire GICS information technology sector with all its changes, has not been a terrible investment. It is noteworthy that it has outperformed QQQ over this period. But it also interesting to note that XLK which holds only the members of the GICS Information Technology Sector that are also members of the S&P 500 outperformed all the rest of the investments we are discussing here during this period.
The performance of the two active investments diverged greatly. The IETC ETF was by far the worst performing of these two investments, while the mutual fund FSPTX, despite its much higher expense ratio, performed almost identically to the passive IYW.
Performance During the Latest Tech Recovery
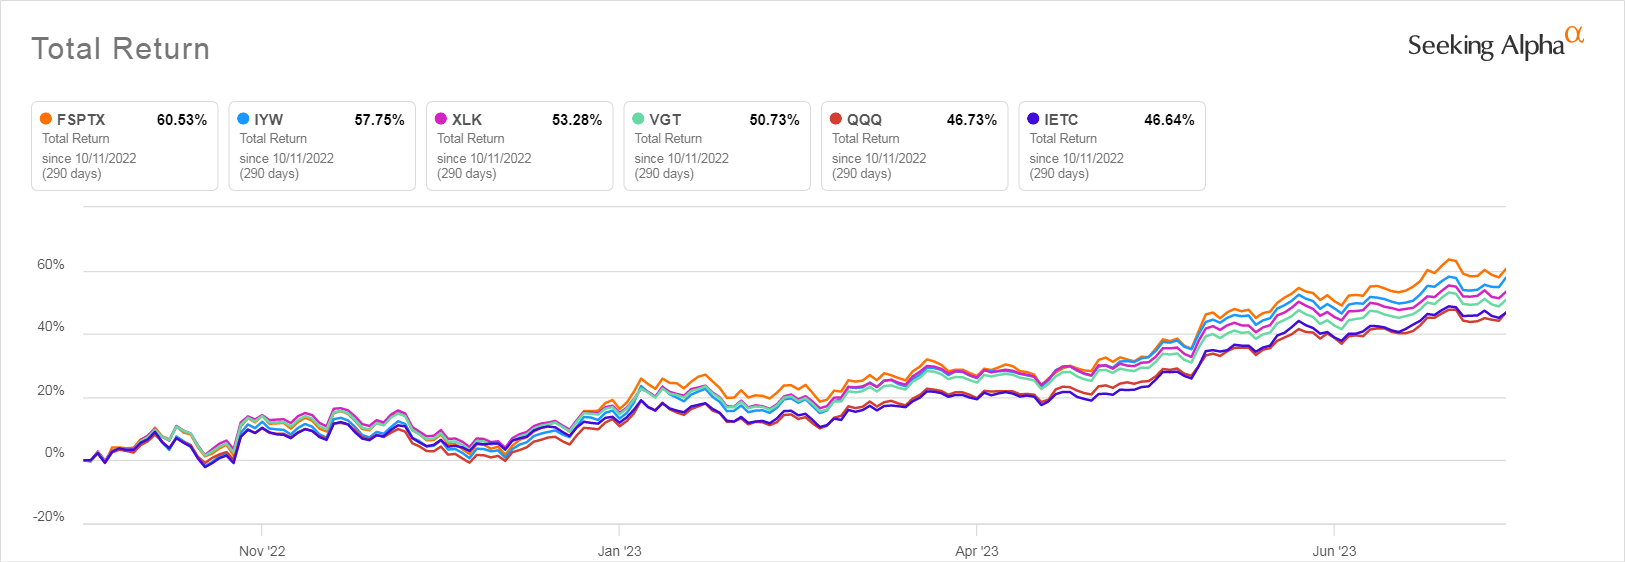
I am always wary of performance comparisons that only look at a single time frame. So I also had a look at how these Tech investments compared over the shorter period that covers the Tech resurgence that followed the 2022 bear market.
Tech ETFs and Fund Performance 10/11/2022 - 7/28/2023
The results here are different from what we just saw for the longer period. The largest difference is that the active Fidelity Select Technology Portfolio mutual fund significantly outperformed the other Tech investments. IYW still outperformed VGT. Interestingly, the actively managed IETC ETF performed only very slightly worse than QQQ. But VGT did considerably better than QQQ.
Unlike in the period when Tech was declining dramatically, during the period when it experienced its recent surge, the more selective XLK only slightly outperformed VGT, while under-performing IYW and greatly under-performing the actively managed Fidelity mutual fund FSPTX.
Did the Change in the GICS Technology Sector Decrease VGT's Relative Performance?
We have just looked at how these Technology investments performed in two different time ranges, both occurring after the change in the GICS definition of the Technology sector.
But we haven't fully answered the question of whether these change were damaging to investors who held VGT, the ETF that tracks the complete sector and to a lesser extent XLK which tracks the stocks in that sector that are also in the highly selective S&P 500.
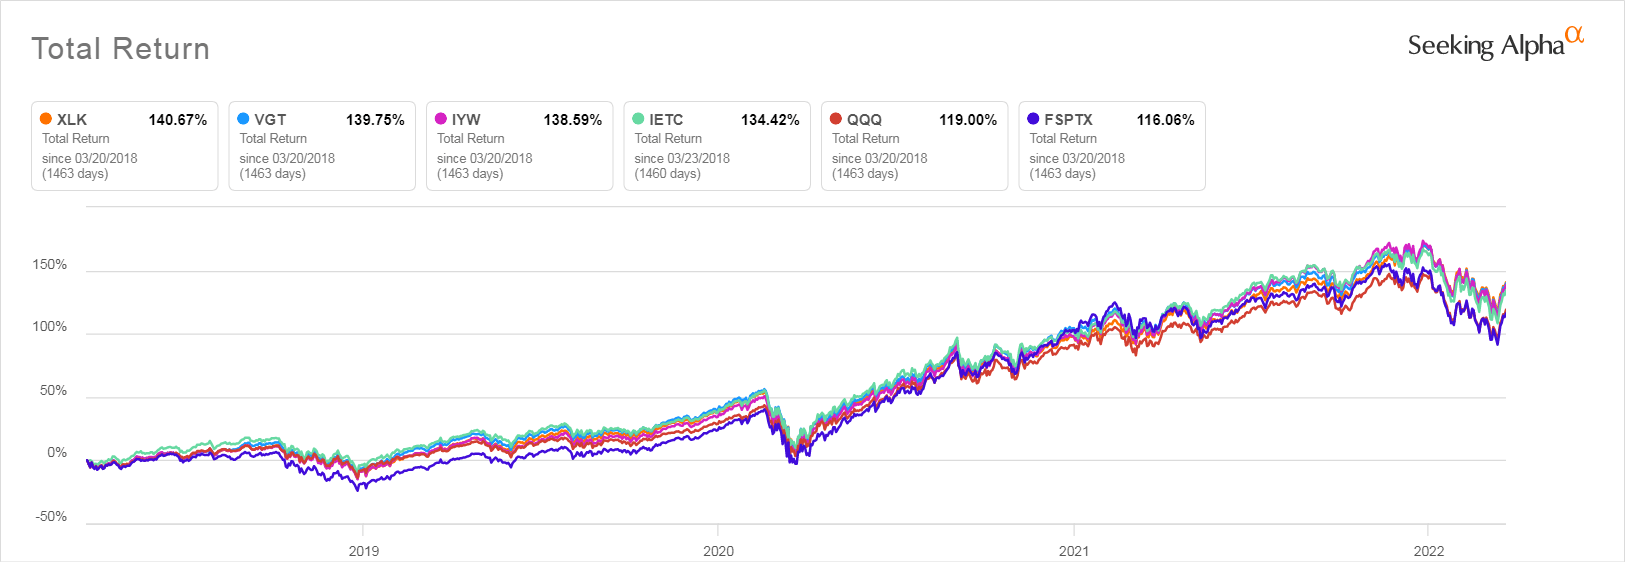
Below is the chart showing how these investments performed over the period after the March 2018 GICS deletion of Alphabet and Facebook but before the changes of March 2022 which removed the data processors and outsourcers.
Tech ETFs & Fund Performance 3/20/2018 - 3/22/2022
Here we see that in this earlier period both XLK and VGT outperformed the other Technology focused investments. The performance of those two ETFs did not differ significantly from each other. But their performance did not differ significantly from that of IYW, which tracks a different provider's sector definition, continued to hold Alphabet and Facebook, and did not hold the stocks that were eliminated from the GICS sector in 2022.
Interestingly, the relative performance of the active investments was the opposite of what we saw after March 22, with the IETC ETF performing far better than the Fidelity mutual fund.
From this a reader might conclude that since it saw almost 10% of its holdings removed in March of 2022, VGT has gone from the near-best to an also-ran. XLK, though it is often used by journalists as a proxy for the Tech sector has performed differently than VGT since the recent change, but its performance is complicated by the quality and size screen implicit in its only holding members of the S&P 500.
But hold that last thought. If quality made such a difference since March 2022, what else has made a big difference in performance? The answer should be immediately obvious and make you rethink attributing a change in performance to the removal of any stocks from VGT.
The Wild Card in This Analysis
The factor here that likely outweighs the impact of the changes to VGT's holdings is the sudden, dramatic rise in interest rates that began at the same time that the GICS sector experienced its massive change.
The complete GICS Tech sector as tracked by VGT holds many unprofitable stocks and many medium and small cap stocks, neither of which are held by XLK. Those stocks are more likely to rely on financing and thus have been hit more severely by the dramatic rise in interest rates that occurred since March of 2022 than were the mega-cap Tech stocks that dominate the market cap weighted ETFs and fund, Apple ( AAPL ), Microsoft ( MSFT ), etc.
Conclusion
All we can conclude definitively from this analysis is that QQQ has underperformed all but the worst Tech investments in each of the periods we have examined. It is not a good proxy for the Tech sector, whatever else might be driving its impressive gains (and at times, losses).
We can also conclude that the actively managed ETF and Fund see very variable performance. From interval to interval they can go from best to worst.
We can also conclude that since the market entered bull territory again, IYW has outperformed VGT by a full 7%, which is very significant, though it is likely that the outperformance is largely due more to its not holding the hundreds of very small semiconductor stocks that are very vulnerable to changes in lending rates which make up much of VGT's total holdings. Its holdings in Alphabet and Meta, eliminated in 2018, are more likely to contribute to its outperformance than the more recent elimination of the data processors.
That said, because IYW has been consistently among the leaders throughout the various periods we discussed here, even if not the top position, which changes continually I would suggest that IYW, though less well known than the other ETFs, is probably the safest way of investing in the Tech sector and a better choice than VGT.
As I also warned in my earlier articles, VGT will continue to be at the mercy of the GICS's tendency to strip out high performing stocks from its index and put them into lagging sectors, possibly to make the sector indexes it licenses to fund providers more enticing. Selling indexes is how GICS' parent MCSI, makes its living.
The only caveat here is that IYW is a smaller fund than VGT, holding $11.6 Billion in assets compared to VGT's $61.3 Billion (including the mutual fund share class.) But that said, it is large enough to be unlikely to close down and its performance speaks for itself.
For further details see:
VGT Has Become A Mediocre Tech Sector ETF; IYW Is Consistently Better