TSLA - Voss Capital Q3 2023 Letter To Partners
2023-11-08 05:40:00 ET
Summary
- Voss Capital is a long-short hedge fund focused on value oriented special situations.
- In Q3 2023, the Voss Value Fund and Voss Value Offshore Fund returned -8.3% and -8.9% respectively, compared to -5.1% for the Russell 2000 and -3.3% for the S&P 500.
- The Voss Value Master Fund's total gross exposure was 155.6% with a net long exposure of 82.9% as of September 30th, 2023.
- Voss Value Master Fund assets under management were approximately $233.4 million and Firm assets were approximately.
Dear Partners,
In Q3 2023, the Voss Value Fund, LP and the Voss Value Offshore Fund, Ltd., returned -8.3% and -8.9% to investors net of fees and expenses, respectively, compared to -5.1% total return for the Russell 2000, -3.0% total return for the Russell 2000 Value, and -3.3% total return for the S&P 500.
As of September 30 th , 2023, the Voss Value Master Fund’s total gross exposure stood at 155.6% and the net long exposure was 82.9%. The top 10 longs had a weight of 84.0%, and our top 10 shorts had a weight of 32.7%.
Voss Value Master Fund assets under management stood at approximately $233.4 million and Firm assets stood at approximately $725.3 million as of September 30 th , 2023.
Voss Value Master Fund Complex
NET MONTHLY PERFORMANCE | 2023 |
| PERIOD |
| Voss Value Fund, LP |
| Voss Value Offshore Fund, Ltd. |
| Russell 2000 TR |
| Russell 2000 Value Index |
| JANUARY |
| 9.2% |
| 9.2% |
| 9.7% |
| 9.5% |
| 6.3% |
| FEBRUARY |
| -1.7% |
| -1.7% |
| -1.7% |
| -2.3% |
| -2.4% |
| MARCH |
| -5.5% |
| -5.5% |
| -4.8% |
| -7.2% |
| 3.7% |
| 1st QUARTER |
| 1.5% |
| 1.5% |
| 2.7% |
| -0.7% |
| 7.5% |
| APRIL |
| -1.9% |
| -1.9% |
| -1.8% |
| -2.5% |
| 1.6% |
| MAY |
| 0.5% |
| 0.1% |
| -0.9% |
| -2.0% |
| 0.4% |
| JUNE |
| 8.8% |
| 8.8% |
| 8.1% |
| 7.9% |
| 6.6% |
| 2nd QUARTER |
| 7.2% |
| 6.8% |
| 5.2% |
| 3.2% |
| 8.7% |
| JULY |
| 0.2% |
| 0.2% |
| 6.1% |
| 7.5% |
| 3.2% |
| AUGUST |
| -2.1% |
| -2.4% |
| -5.0% |
| -4.8% |
| -1.6% |
| SEPTEMBER |
| -6.5% |
| -6.8% |
| -5.9% |
| -5.2% |
| -4.8% |
| 3rd QUARTER |
| -8.3% |
| -8.9% |
| -5.1% |
| -3.0% |
| -3.3% |
| OCTOBER |
| NOVEMBER |
| DECEMBER |
| 4th QUARTER |
| 0.0% |
| 0.0% |
| 0.0% |
| 0.0% |
| 0.0% |
| YEAR TO DATE |
| -0.2% |
| -1.2% |
| 2.5% |
| -0.5% |
| 13.1% |
The table below shows the Voss Value feeder fund returns compared to some of the relevant indices:
Net Return Comparison as of September 30th, 2023 |
| 1 Month |
| 3 Month |
| YTD |
| 1-Year |
| Compound Annual Growth Rate |
| 3-Year |
| 5-Year |
| 10-Year |
| ITD (1) |
| Voss Value Fund, LP |
| -6.5% |
| -8.3% |
| -0.2% |
| 16.9% |
| 19.2% |
| 14.0% |
| 15.6% |
| 16.8% |
| Voss Value Offshore Fund, Ltd. |
| -6.8% |
| -8.9% |
| -1.2% |
| 15.4% |
| 18.0% |
| - |
| - |
| 15.2% |
| S&P 500 |
| -4.8% |
| -3.3% |
| 13.1% |
| 21.6% |
| 10.1% |
| 9.9% |
| 11.9% |
| 13.9% |
| Russell 2000 |
| -5.9% |
| -5.1% |
| 2.5% |
| 8.9% |
| 7.2% |
| 2.4% |
| 6.6% |
| 10.4% |
| Russell 2000 Value |
| -5.2% |
| -3.0% |
| -0.5% |
| 7.8% |
| 8.8% |
| 0.1% |
| 4.9% |
| 8.7% |
| Russell 2000 Growth |
| -6.6% |
| -7.3% |
| 5.2% |
| 9.6% |
| -3.4% |
| -1.2% |
| 5.3% |
| 9.3% |
| HFRX Equity Hedge Index |
| -0.8% |
| 0.2% |
| 3.2% |
| 4.9% |
| 6.8% |
| 3.7% |
| 3.0% |
| 3.4% |
| (1) Inception to Date measures the time period from Voss Value Fund, LP's inception date of October 1st, 2011, and from Voss Value Offshore Fund, Ltd's inception date of January 1st, 2020. |
The low volume lull this summer metamorphosed back into an extension of the 2022 bear market, with small caps making new cycle lows. The small cap index remains ~33% off its peak from two years ago on November 8 th , 2021, and the pain under the covers cannot be understated as the current small-cap bear market is the 3rd worst by duration and 4th worst by magnitude over the last 40+ years. 1
While our optimism on broader economic resilience has proven accurate with real economic growth in the 90 th percentile in Q3 1 compared to the last 25 years, paradoxically, this has turned out to be terrible for our positioning due to interest rate myopia dominating talking points and price action. The narrowness of positive breadth hit a new record low in the last few weeks, and the spread between the performance of the IWM / QQQ hit a new all-time wide, eclipsing the extremes experienced at the height of the internet bubble.
Excluding the volatile Energy sector, the S&P 500 is expected to show 8% y/y earnings growth in Q3, a far cry from the utter collapse anticipated late last year and earlier this year, but our elevated exposure to "credit-sensitive" consumer and industrial stocks (almost all of which seem to be coalescing around ~6x earnings) has pummeled us on a relative basis despite their strong earnings performance. We believe investors may be shunning them, still afraid to come out of hiding from within "high-quality growth" – even as the economy continues to add jobs at a healthy clip. CapEx and loan growth in the US have already slowed materially, but it is TBD if the eventual downturn has been pre-priced, as it has been hotly anticipated for going on two years now.
We would point out that real interest rates (the 10-year US treasury minus Core CPI) ended Q3 at only +42 bps, which remains in the 19 th percentile historically and a full 1.77% below the 60-year median. 2 Historically, the correlation between rates and stocks’ valuation multiples is surprisingly very weak, but it is the pace of the recent rise that has ushered in a regime shift and begot extrapolations and fear.
The state of consumer balance sheets, and thus the resiliency of the economy, continues to be grossly underestimated as interest rate sensitivity has been overestimated in the aggregate. The estimates of "excess savings" were recently revised up by a cool ~$950B in one fell swoop. However, this is a nebulous concept that zeroes in on bank deposits and ignores the trillions that have flooded into money market funds. Leaving aside the potential economic rescue buoy that could be provided by the hundreds of billions raised in private credit funds that have not yet been deployed, bank lending has slowed markedly but held up much better than SLOOS data over the last 12 months would have compelled someone numerate to predict. Furthermore, it is worth noting that consumer’s total interest income is almost 4x larger than consumer interest expense (thanks to ~72% of consumer debt being low fixed rate mortgage debt), and BEA estimates so far show that the rise in rates has only had -$5B annualized net impact to consumer’s financial picture overall, an amount that is a literal rounding error relative to annual US consumer spending of ~$19 trillion. 3 However, those being hurt are more likely on the lower rungs of the socioeconomic ladder (or at least, are more dependent on high interest revolving credit) and those benefiting from higher returns on their savings might have a much lower propensity to consume with each incremental dollar of income. Despite this, we could argue that higher rates are likely more inflationary in the medium term given consumer rate sensitivity has been so low, and higher rates main impact so far has been to crimp new real estate development at a time when supply/demand are direly out of whack. This may continue to prop up home prices, 4 and recall that the shelter component of CPI comprises the largest weighting at ~40%. Said differently, lower rates would spur a quicker and much needed increase in the supply of real estate, helping to pressure prices and rents.
As has been widely covered by the media all year, the equity benchmarks have been driven by only a handful of stocks, with top 10 S&P 500 constituents’ contribution as proportion of total returns hitting a new record high YTD compared to any calendar year in history. Mega-cap tech stocks have had better earnings revisions than the average small-cap and have less leverage/floating rate debt and higher ROICs, so we believe outperformance has been warranted. However, there are obvious exceptions. One such exception is TSLA , as 2023 and 2024 EPS revisions are down >40% YTD and dropping, 5 yet the stock is still up almost 100% YTD. The largest stock in the world, AAPL is another experiencing tremendous multiple expansion, as the stock is up 38% YTD while its 2023 and 2024 earnings estimates have been revised 3% lower. This dynamic can be partly explained by the fact that retail investors have as much as 40% of their portfolios concentrated into just three stocks: AAPL, TSLA, and NVDA . 6 Retail investors control ~7x as much capital as hedge funds, thus it is feasible that the continued extreme retail crowding into the Tesla bubble is a major contributing factor causing this all-time-wide spread between large cap tech/small cap value.
Compare this mega cap multiple expansion for two companies with negative earnings growth to just one small cap example from our portfolio, CROX , which we believe is the single cheapest branded apparel/footwear stock in the entire US market despite industry-leading margins and returns on capital. The stock is down -31% since the end of Q2, bringing its P/E multiple down to its ~3 rd percentile relative to its entire trading history (only cheaper in the middle of 2009). Concerns persist around the sustainability of core Crocs brand popularity, which we believe are unwarranted, as the brand continues to grow at a double-digit rate with expanding margins. Near term concerns around HeyDude inventory issues are warranted but the company has been taking steps to correct them and any short-term weakness here is more than offset by the surprise strength of the core Crocs brand which accounts for over three-fourths of the company’s revenue and an even higher percentage of the company’s gross profit. With a growing FCF stream at a current 15% yield and a buyback authorization in place for ~20% of the shares outstanding at current market prices, combined with a ~10% short interest, we think CROX's forward return prospects are still asymmetrically skewed to the upside from the recent market price of $80.
As of October 31, the Russell 2000 is 6% below where it was in August 2018 (63 months ago). 7 Returns have been abysmal over the last 5+ years, which we think improves the return prospects for the next five, as we calculate that small cap stocks are higher 99% of the time historically over any rolling 6-year period in history. 8 Only in two months in modern history were small caps lower than they were six years prior using monthly closing prices: March 2020 and September 2011 (and Feb. 2003 flat). In both cases, two years later the returns were ~30% annualized.
Return of Goldilocks?
In early 1992 the real US growth rate and inflation rate were roughly the same as they are now. That is when the term “goldilocks economy” was first coined by a Salomon Brothers analyst to describe such an ideal economic backdrop. 9 Now, however, with a slightly higher real growth rate (as of Q3) and a similar inflation rate (putting the real 10-year treasury yield fully ~300 bps lower than 1H 1992), there is extreme fear and hand wringing. Small cap stocks rose >50% from mid-December 1991 to the start of January 1994, a 21.4% annualized rate. 10 The starting P/E ratio on small caps then was also ~50% higher than it is now, at ~18x vs ~12x for the indices if excluding negative earners (including non-earners takes the ratio up to ~21x in 1992 and 16x currently). 11 In an alternate universe, the market could interpret our current situation of high real growth plus clear disinflation as an optimal Goldilocks scenario for equities, just as it did for the 1990s—when in fact real interest rates were much higher for the entire decade than they are now. Like most things in life, it’s all a matter of one’s perspective.
US Residential Tailwinds
We remain optimistic about our exposure to new residential construction. It has become clearer as the months tick by that new homebuilders are still thriving in a higher rate environment. The mortgage lock-in effect has kept competing inventory from available existing homes for sale pinned near an all-time low, while the builders happily “buy-down” mortgage rates for their prospects. New single-family home starts still need to rise by >15% just to revert to the US average from 1985-2001 (leaving out the housing boom years) and we have only exceeded that 16year average in three quarters in the last 16 years, despite the US population being 100+ million greater now than in 1985. Of note, the average mortgage rate over that timeframe (‘85-‘01) was 8.8% versus the latest Freddie Mac rate of 7.75%, a rate that could drop by another ~1.25% should the mortgage rate spread over treasuries normalize.
The best solution to the country's housing woes remains painfully obvious: build, build, build.
ECN Capital ( ECNCF ) Update
ECN has been disappointing and frustrating lately, so we felt it warranted an update. The company recently announced a major strategic investment from Skyline Champion (SKY), the second largest manufactured housing player in North America, whereby the two companies have created a captive finance joint venture in addition to Skyline purchasing a 20% effective ownership stake in ECN. After several quarters in a row of lowering earnings guidance combined with confusion around the deal structure and dynamics going forward and, from what we can gather, aggressive price-insensitive tax-loss selling by Canadian mutual funds, the stock has become extremely out of favor and is 40% lower than the price of the Skyline deal. Although the fledging JV has limited visibility at the moment, we think the partnership has the potential to significantly drive earnings growth as Skyline pairs an inhouse financing option with the homes they manufacture and sell. The market is clearly less optimistic. At the same time, Texas manufactured housing retail unit sales have quietly flipped back to positive year-over-year growth in August (+6%), a promising sign for continued Triad loan origination growth, but there is still fear over rates and undoubtedly weak end markets across RV and Marine. If we back out ECN's purchase price of Source 1 & IFG, their RV and Marine origination platforms, and our estimate of their earnings contribution, we believe the core business of Triad is being valued at ~3.5x forward earnings - an extremely distressed level valuation for a business that has been a steady compounder and market share taker, is asset-light, and achieves >50% EBITDA margins. We can still envision a clear event path from here, where they sell the RV and Marine business once the end markets at least stabilize, rebrand the company to Triad and relist to the US from Canada, and then eventually sell out entirely to Skyline or a major funding partner for a price well above the previous deal price ($3.04/share) within the next 2-3 years.
New Long: CRH Plc
While the market has recently been focused on GPU chips and AI scripts, our attention has been on cement blocks and crushed rocks. We've enthusiastically made CRH one of our largest positions ever at cost due to its limited downside. CRH is among the largest aggregates and infrastructure companies in the United States and Europe and has recently relisted to the NYSE from the LSE, which we believe will be a catalyst for the stock to rerate upwards towards peer valuations as its undeniable value hiding in plain sight becomes more widely discussed.
In 1970, Cement Limited and Roadstone Limited, two Irish infrastructure-focused companies, combined to form Cement and Roadstone Holdings, or "CRH.” An investment of $1 million into CRH upon its founding since that fateful merger ~53 years ago would have turned into ~$1.5 billion by mid-year 2023, an annualized total return to investors of 15.0%, a high rate of compounding we think can continue.
Half a century of success at CRH has been driven by disciplined operations and capital allocation that we believe derives from a company culture built around appropriate financial incentives. CRH’s M&A playbook has proven to be successful as an acquisitive company like CRH can't compound at a rate of 15% over 50 years unless acquisitions and divestitures have been executed at attractive prices. Over the last five years, CRH has spent $10.3 billion on acquisitions while receiving $10.5 billion in proceeds from divestitures across dozens of transactions, with the average acquisition multiple ranging from 7x – 8x EBITDA depending on the year and the average exit multiple clocking in at 11x EBITDA.
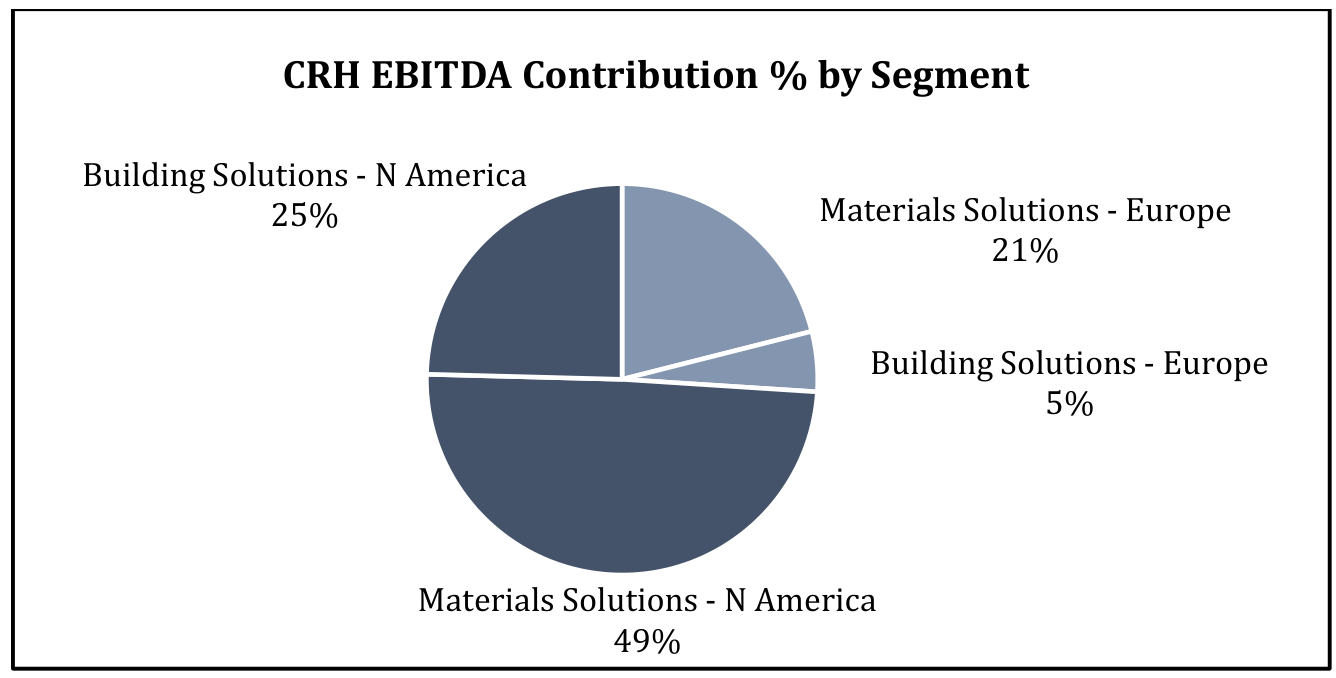
As currently constructed, the Company has four primary segments, with EBITDA contribution as follows:
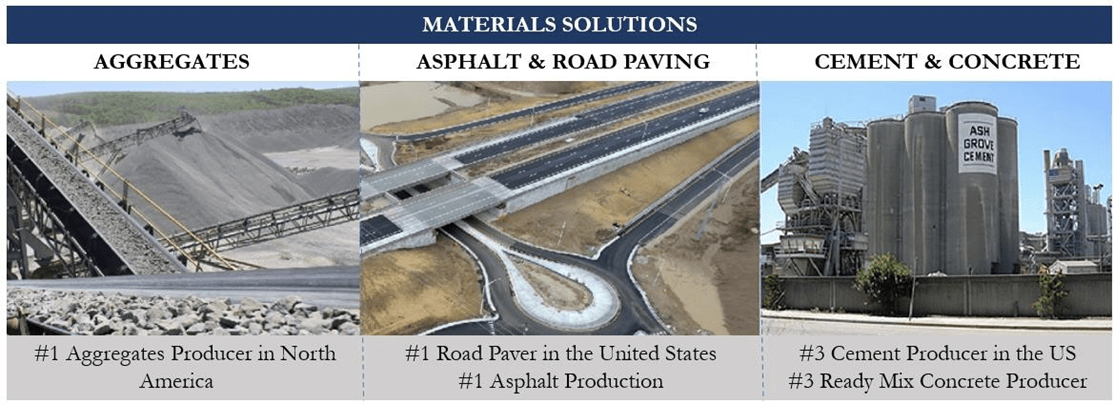
The Materials Solutions segments are vertically integrated across construction products and services – producing and supplying aggregates, cement, ready mix concrete, asphalt, and related services such as road paving. The aggregates business has terrific economics, as most operate as local oligopolies or monopolies. If you are a user of aggregates, you will almost certainly use the closest quarry to your project because the cost to transport aggregates is such a high percentage of the value of the actual product. It doesn't make sense to try and get a discount from the quarry 15 miles further away because all the savings will be more than eaten up by increased transportation costs. The industry has historically enjoyed stable annual pricing increases, and over the last 52 years, aggregates annual pricing has only dropped year-over-year in three of those years (and only by -1.5% on average). 13 CRH is sitting pretty with the largest aggregates mineral reserves in North America at 19B US tons – comfortably more than Martin Marietta (17B tons) and Vulcan Materials (16B tons).
On the cement side of the business, industry dynamics are like Greg Focker’s portfolio — strong to quite strong . It is very difficult to add cement capacity in the United States because of stringent environmental regulations, so the domestically produced supply is maxed out at around 100M metric tons per year. CRH has about ~11% market share across its 12 plants in North America. At the same time, even with depressed residential development as of late, US demand is running at ~120M metric tons per year. Excess demand is supplied by imports, which come at a significantly higher cost than domestically supplied cement. To state the obvious, this supply/demand dynamic has been very favorable for cement pricing, a trend we see continuing.
CRH is among the largest asphalt manufacturing and paving companies in the United States and has clear advantages of scale that help the Company produce best-in-class margins on this product. Bitumen is a key component in producing asphalt, and due to CRH's massive size, they have a "winter-fill" program that allows the Company to acquire bitumen cheaply in the winter months and store it for use during warmer construction months, which results in a cost advantage against smaller competitors that lack access to that kind of infrastructure.
A key differentiator for CRH is its vertical integration. Materials produced in the aggregates and cement business are supplied as components to downstream businesses like asphalt and ready-mix concrete. The integration between the Materials Solutions business and the Building Solutions business provides customers with end-to-end solutions whereby they only must deal with one vendor compared to a handful. We believe this improves logistics and helps projects get completed on time and on budget. CRH can construct components off-site and deliver them on an as-needed basis, reducing labor on-site and idle time from unorganized logistics scheduling between disparate third-party vendors.
The Building Solutions segments manufacture and supply outdoor products such as hardscapes, fencing, railing, masonry, packaged products, lawn and garden, pool finishes, and composite decking, in addition to concrete infrastructure, precast products, drainage systems, water management, and other construction components.
The first subsegment of Building Solutions is the Outdoor Living business. This business has one of the broadest offerings of products for public and private outdoor spaces - including Pebble Tech pool finishes, MoistureShield composite decking that competes with Trex, Barrette railing and fencing, and Belgard paver stones and outdoor kitchens. If you have recently remodeled your backyard, it is highly probable that you’ve installed at least one of their products.
The next subsegment of the Building Solutions segment is the Building & Infrastructure business. This business provides critical infrastructure for connecting, protecting, and transporting water, energy, and telecommunications infrastructure. This segment thrives on large complex projects and as mentioned, is fully integrated with the upstream Materials business. CRH is heavily involved early in a project's lifecycle, beginning with the design phase, and they develop customized solutions given their expertise and broad capabilities. Here is an example of a stormwater upgrade in Tampa, FL, that the Company completed in 2022. A main thoroughfare was repeatedly flooded during storms in the area, and CRH's team was able to eliminate flooding and reduce pollution runoff associated with these weather events by installing a comprehensive stormwater management system—Lord knows Houston could use some of these.
Currently, about 75% of CRH's EBITDA is earned in North America (~10% higher than the average S&P 500 company), and the remaining 25% is earned in Europe and the rest of the world, with the Company having expectations that 90%+ of earnings will come from North America in the coming years.
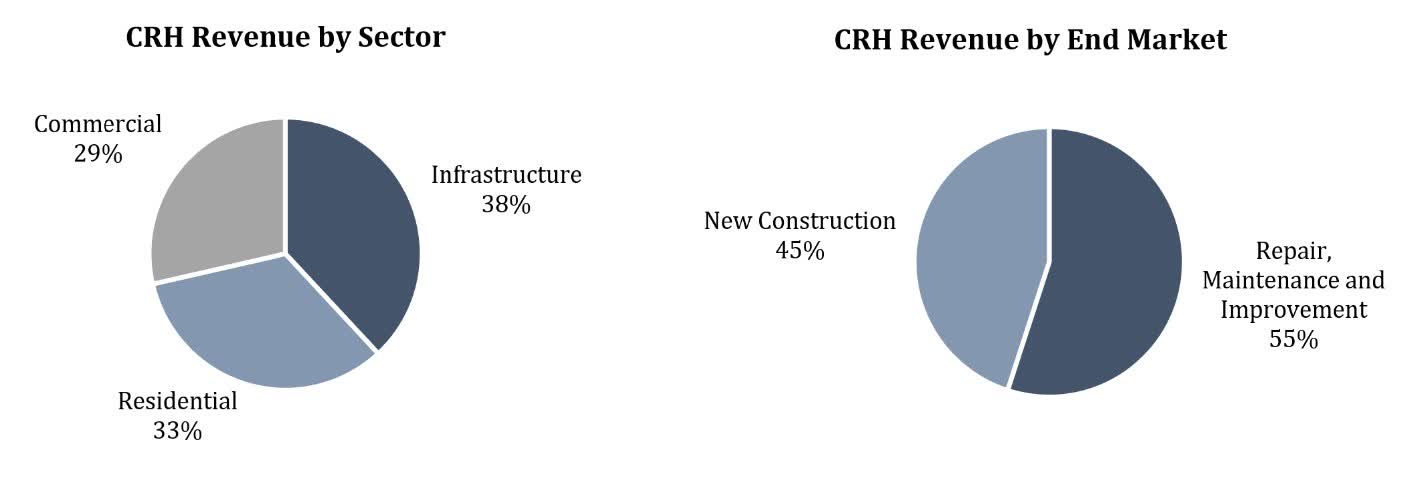
Across all CRH, 55% of revenue is derived from repair, maintenance & improvement, and 45% is derived from new construction. Revenue split by sector is ~40% infrastructure, ~30% residential, and ~30% non-residential.
US Infrastructure Tailwinds:
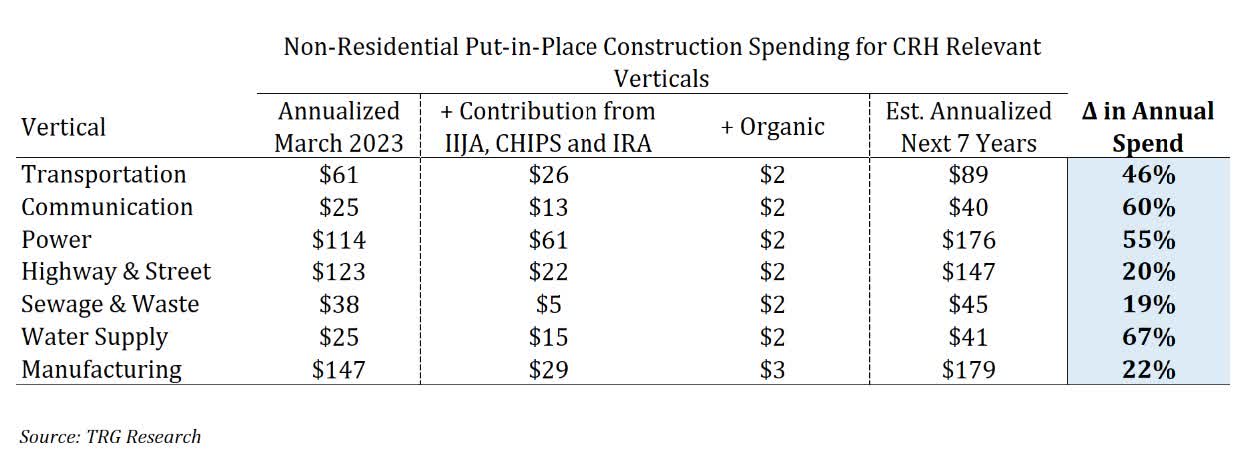
As one of the largest building materials businesses in North America, CRH may be the single largest beneficiary of the recent unprecedented government infrastructure spending programs, including the Infrastructure Investment and Jobs Act (IIJA), CHIPS and Science Act (CHIPS), and the Inflation Reduction Act (IRA). For instance, of the $1.2 trillion in IIJA funds, about $350B is allocated to Highway funding, and CRH is the #1 road paver. Throughout the 5year life of the spending bill, this would increase the federal spending on highways by abou t 50% above the baseline 2021 spend , from ~$47B p.a. to north of $70B per year. 14 The IIJA has been touted as the most transformative public investment program since the 1930's.
Perhaps equally as important as the IIJA spending is the onshoring of manufacturing that is occurring in the United States, with the support of the CHIPS and IRA. This has led to $200B+ of major commercial projects that have already been announced to bring critical manufacturing back to the US. These "mega projects" are squarely in the sweet spot for CRH, and they offer significant visibility for the infrastructure business through 2030. The Company has quantified the increase in annual manufacturing-related spending in the US as 2.5x higher than previous levels.
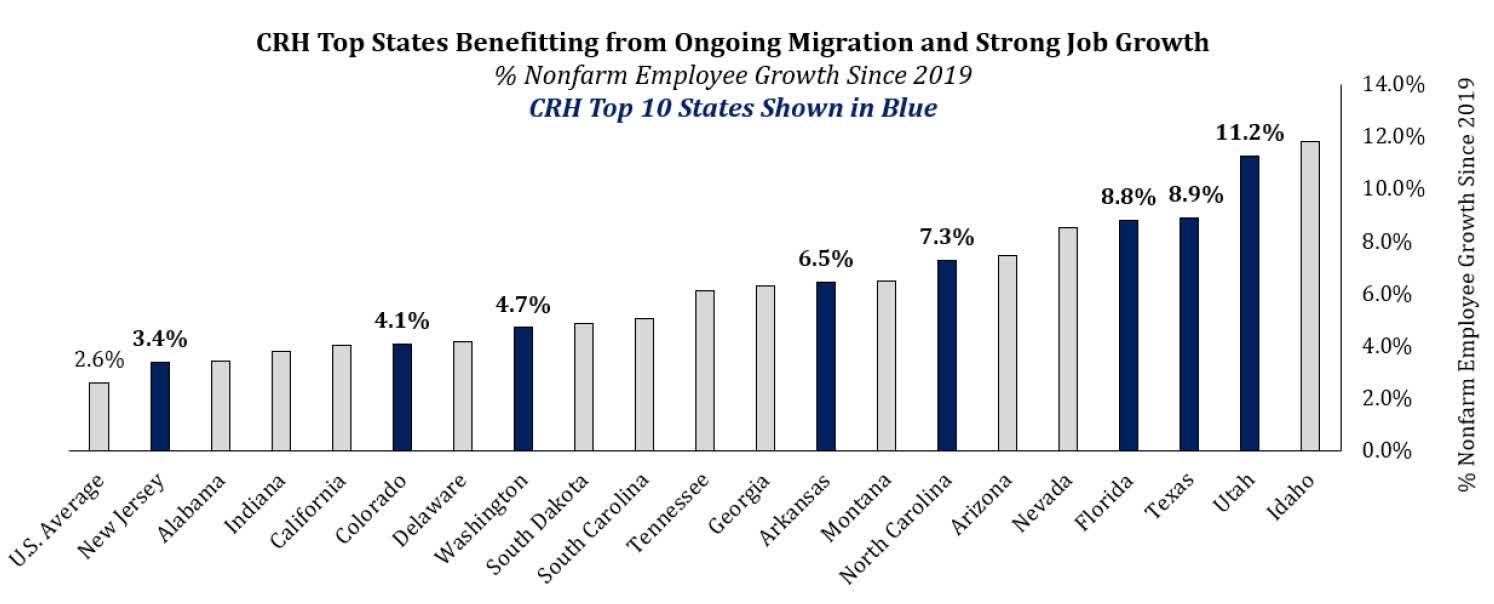
Many of CRH's top markets are benefiting from ongoing interstate migration and strong job growth, with three of CRH's top states ranking among the top four in terms of employment growth since 2019. Not only will strong local economies help to keep state budgets flush at their current record levels, but this growth necessitates increased infrastructure investment, and a significant piece of IIJA funding will go to these states. Note CRH still has exposure to other fast-growing states like AZ and NV that fall just out of its top 10 states.
Relisting:
As noted above, CRH completed a relisting to the US on September 25 th and now maintains a primary listing on the NYSE, with a secondary listing on the London Stock Exchange. This relisting will entice more investors over the coming year to rerate the stock much closer to US peer valuations rather than languishing at European peer valuations. Once the sell side and US-based investors grow familiar with the name, we believe the inexplicable valuation gap will be too hard to ignore and the market will do its job of appropriately valuing CRH as the best-of-breed operator within an advantageous industry.
In addition to increased investor awareness, the Company has cited increased business opportunities as CRH will appeal more to customers who favor dealing with US-based companies, not the least of which are state and local governments. It will also provide better opportunities on the M&A side through better visibility and a strong currency in US company stock for potential acquirees.
CRH has a keen focus on being well represented in US-based indices and once the Company files its 2023 10-K around March 2024, they will be eligible to be included in the S&P 500, which provides another major catalyst from passive flows and index-constrained active managers alike.
Valuation:
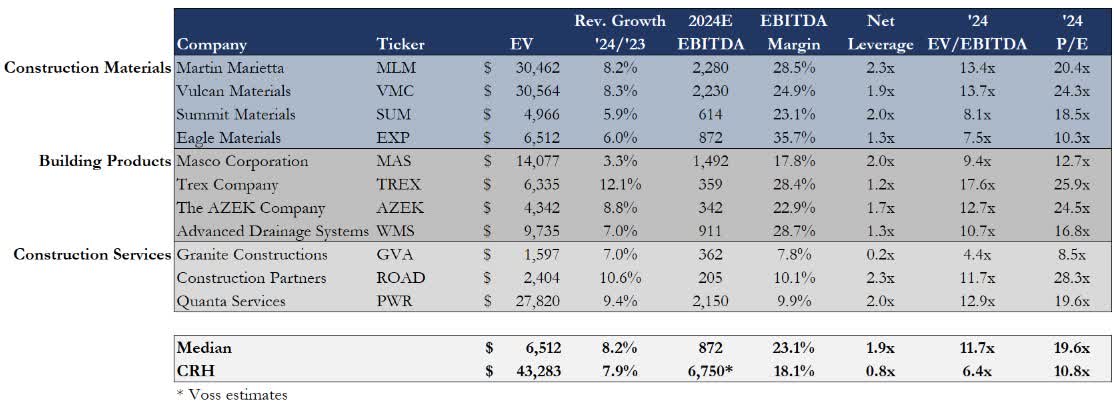
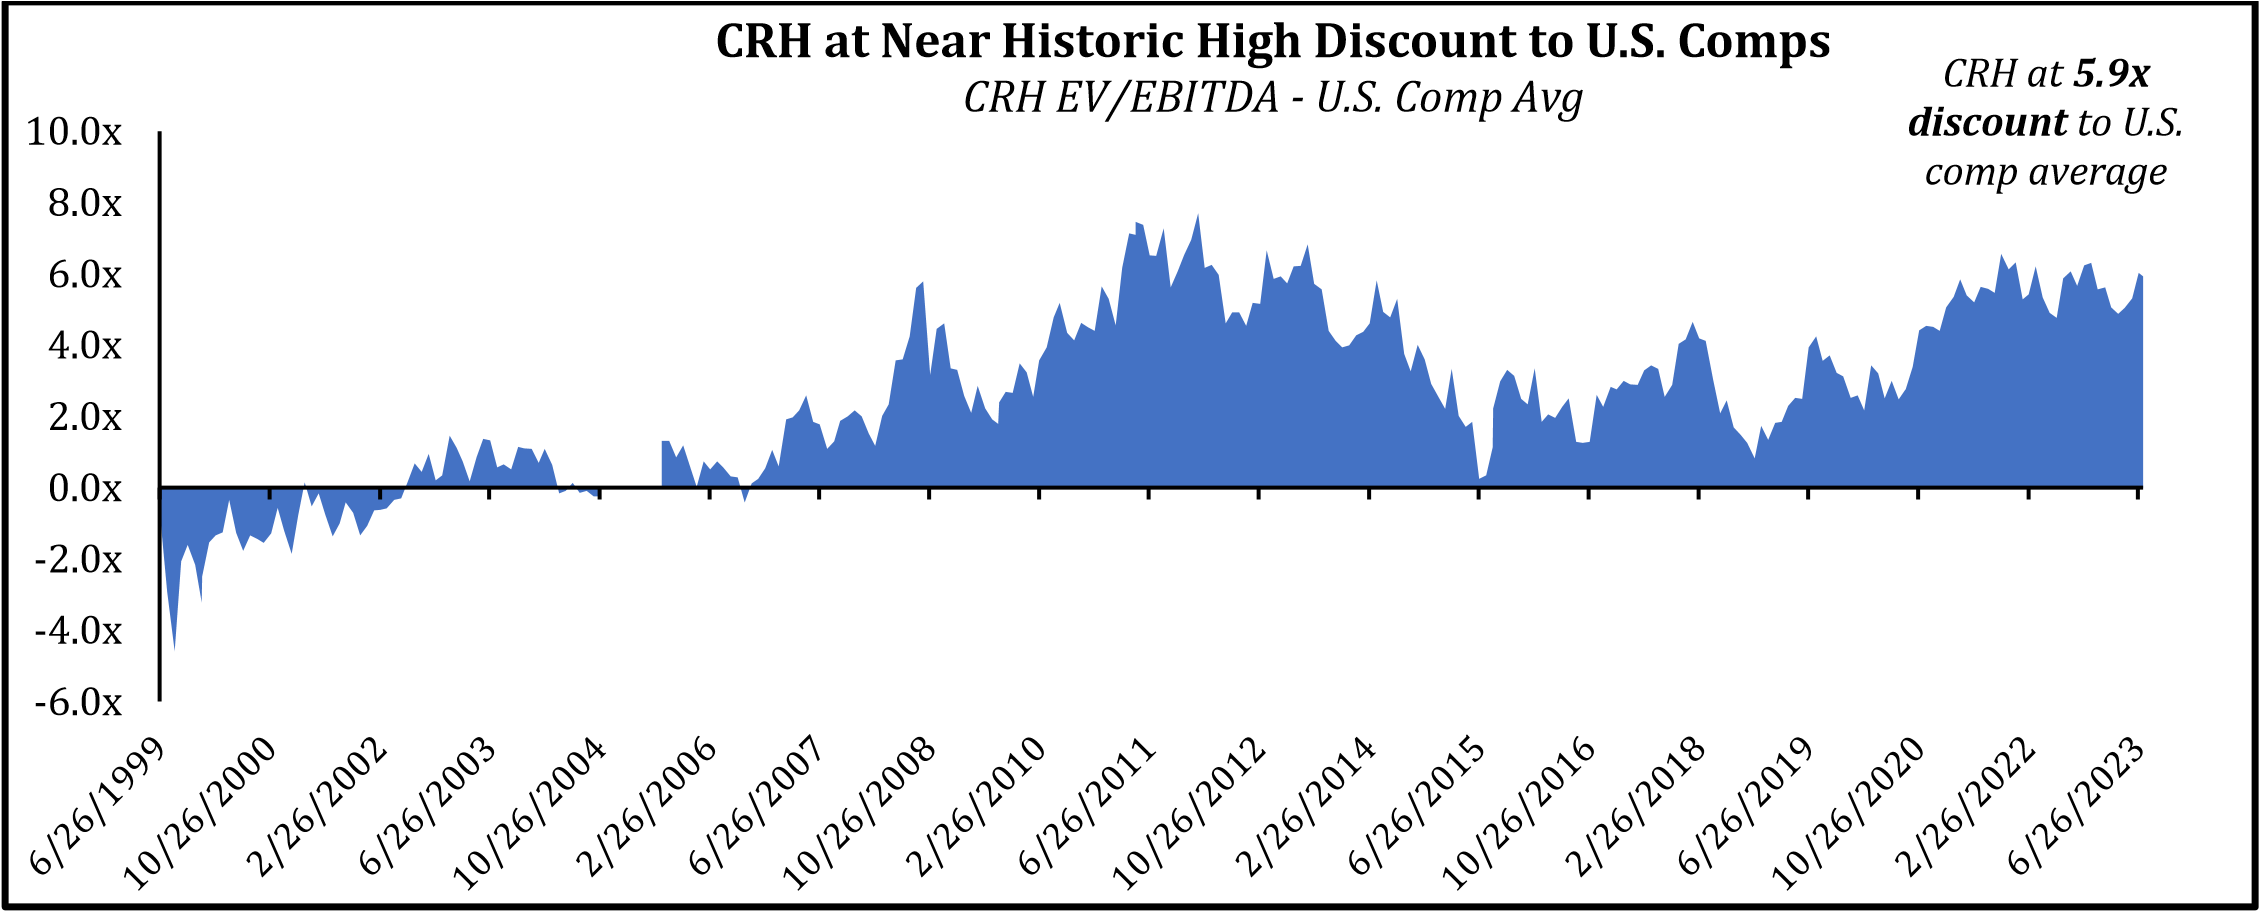
We believe the current valuation of CRH provides for limited downside and is significantly cheaper than peers, despite being a best-in-class operator across all the business segments the Company competes in. CRH trades at an 11.5x P/E based on the '24 consensus and 7.0x EV/EBITDA (6.4x our estimate). As shown below, the most relevant peers are trading around 10-15x 2024 EV/EBITDA and around 18-28x on an earnings basis, a significant premium to CRH despite it having much lower leverage and better cash flow conversion.
It is also worth highlighting the fact that the Company has provided guidance for $35B of cash generation over the next five years, an amount equal to >90% of the Company's current market cap. We estimate this is comprised of $25B of FCF generation and $10B from re-levering the balance sheet from 0.8x net debt/EBITDA to about ~2.0x.
Our price target, based on our 2025 estimates, uses a 10.3x EV/EBITDA multiple, which implies a ~20x P/E multiple. This equates to a ~$120 per share value (including dividends received), which is ~118% above the current price of $55. We would expect these estimates to be priced in about one year from now, by late 2024. These assumptions are conservative relative to historical comparable company valuations of around 20x – 30x NTM P/E.
Likewise, on an absolute valuation basis, we think US investors should soon recognize that a company with this level of stability in operations, an enviable capital allocation track record, and robust earnings growth visibility should not trade at just 11.0x earnings.
Conclusion
As we labor to fit its multifarious flow into quixotically logical grooves, hopping from one conviction to the next, The Great Humiliator has been busy wreaking havoc on our generalizations and breaking many long-standing records. Namely, the spread between large and small is at a record wide and bonds are amid their worst bear market ever. Small cap valuations and the duration of their drawdown are at levels rarely witnessed during modern history, but just as the seeds of spring are always buried within the dead of winter, changing market cycles are sown on precisely such contradictions and extremes. The duality of many things in markets and nature slyly imply their opposite and are insidiously transforming. Rest assured, what is in-favor now will inevitably become out-of-favor, and vice versa.
We regret not doing a better job of protecting the downside from a position of large gains early in the year—very few stocks were near our base case price targets, which made us more optimistic, and we were trying to avoid realizing taxable gains unnecessarily on longs. At any rate, the Voss Value Fund’s net outperformance over the Russell 2000 over the last three years remains 12% annualized as of September 30 th , a spread we believe could improve even further over the coming quarters based on the portfolio’s current valuation.
The weighted average forward free cash flow yield of our portfolio is about three times higher than the current risk free rate 15 , thus we would argue our portfolio has been sufficiently "pre-disastered," just like the home that a plane crashed into in The World According to Garp . 14
We are confident our portfolio is well positioned to rebound sharply as the underlying business fundamentals and investment theses remain in-tact, while the stocks in many cases are cheaper than ever. Sincerely,
Voss Team
Appendix
Common Terms:
Disclosures and Notices:Beginning January 1, 2020, all investment activity is conducted by the Voss Value Master Fund, LP (the “Master Fund”), which has two feeder funds, and therefore performance figures from January 1, 2020 onward are calculated based on the Master Fund. All limited partners invest in the Fund through one or more of the following feeder funds: Voss Value Offshore Fund, Ltd. (the “Offshore Fund”) and Voss Value Fund, LP (the “Predecessor Fund”), each a “Feeder Fund”. Performance figures for the Predecessor Fund are contributable to Travis Cocke as sole portfolio manager. Mr. Cocke maintains the same the position with the Fund and the Fund will employ a similar strategy as the Predecessor Fund. Actual returns are specific to each investor investing through a Feeder Fund. Each Feeder Fund was established at different times and has varying subsets of investors who may have had different fee structures than those currently being offered. As a result of differing fee structures, differing tax impact on onshore and offshore investors, the timing of subscriptions and redemptions, and other factors, the actual performance experienced by an investor may differ materially from the performance reported above. Portfolio statistics shown are inclusive of the Predecessor Fund and the Offshore Fund. Net results are presented after deduction of all operational expenses (including brokerage commissions), 1% per annum management fee, and 20% performance allocation. Prior to Q1 2023, 2022, and 2023 net results were presented at the Fund/feeder level but were subsequently updated to match the method of presentation used for the Fund’s 2022 Audited Financial Statements. A full chart is available upon request. This letter is provided by Voss Capital, LLC (“Voss”, “the Firm”, “the Voss Team”, and “our team”) for informational purposes only and does not constitute an offer or a solicitation to buy, hold, or sell an interest in the Voss Value Fund, LP (the “Fund”) or any other security. An investment in the Fund is speculative and involves substantial risks. Additional information regarding the Fund, including fees, expenses and risks of investment, is contained in the offering memorandum and related documents, and should be carefully reviewed. An offer or solicitation of an investment in the Fund will only be made pursuant to an offering memorandum. This communication is confidential and may not be reproduced or distributed without prior written permission from Voss. This confidential report is only intended for the recipient and may not be redistributed without the prior written consent of Voss. The information contained herein reflects the opinions and projections of Voss as of the date of publication, which are subject to change without notice at any time subsequent to the date of issue. All information provided is for informational purposes only and should not be deemed as investment advice or a recommendation to purchase or sell any specific security. Data included in this letter comes from company filings and presentations, analyst reports and Voss’ estimates. While the information presented herein is believed to be reliable, no representation or warranty is made concerning the accuracy of any data presented. Certain information contained in this letter constitutes “forward-looking statements” which can be identified by the use of forward-looking terminology such as “may,” will,” “should,” “expect,” “attempt,” “anticipate,” “project,” “estimate, or “seek” or the negatives thereof or other variations thereon or comparable terminology. Due to various risks and uncertainties, actual events or results in the actual performance of the Fund may differ materially from those reflected or contemplated in such forward-looking statements. There can be no guarantee that the Fund will achieve its investment objectives and Voss does not represent that any opinion or projection will be realized. The securities contained within the benchmark indices highlighted herein do not necessarily correspond to investments and exposures that will be held by the Fund and are therefore of limited use in predicting future performance of the fund. Indexes are unmanaged and have no fees or expenses. An investment cannot be made directly in an index. The Fund consists of securities which vary significantly from those in the benchmark indexes listed below. Accordingly, comparing results shown to those of such indexes may be of limited use. The S&P 500 Total Return Index is a market cap weighted index of 500 widely held stocks often used as a proxy for the overall U.S. equity market. The Russell 2000 index is an index measuring the performance approximately 2,000 small-cap companies in the Russell 3000 Index. The Russell 2000 serves as a benchmark for small-cap stocks in the United States. The Russell 2000 Growth Index measures the performance of those Russell 2000 companies with higher price/book ratios and higher predicted and historical growth rates. The Russell 2000 Value Index measures the performance of the small-cap value segment of the U.S. equity universe. It includes those Russell 2000 companies with lower price-to-book ratios and lower expected and historical growth values. HFRX Equity Hedge Index consist of Equity Hedge strategies which maintain positions both long and short in primarily equity and equity derivative securities. A wide variety of investment processes can be employed to arrive at an investment decision, including both quantitative and fundamental techniques; strategies can be broadly diversified or narrowly focused on specific sectors and can range broadly in terms of levels of net exposure, leverage employed, holding period, concentrations of market capitalizations and valuation ranges of typical portfolios. The strategy utilized by Voss has a high tolerance for uncertainty. Different types of investments involve varying degrees of risk. Therefore, it should not be assumed that future performance of any specific investment or investment strategy will be profitable. Asset allocation may be used in an effort to manage risk and enhance returns. It does not, however, guarantee a profit or protect against loss. Past performance does not guarantee future results. |
Editor's Note: The summary bullets for this article were chosen by Seeking Alpha editors.
For further details see:
Voss Capital Q3 2023 Letter To Partners