QQQJ - We Retested The S&P 500 200-Day Moving Average Twice Last Week
2023-10-10 00:30:00 ET
Summary
- Few investors know that the notional dollar value in daily futures trading exceeds that of the cash trading at NYSE.
- The declines in S&P 500 futures in September have had a high correlation with the direction of the moves of the 10-year Treasury futures.
- If what we saw on Friday was a climactic top in Treasury yields, then the chances that we hit a bottom in the stock market are very high.
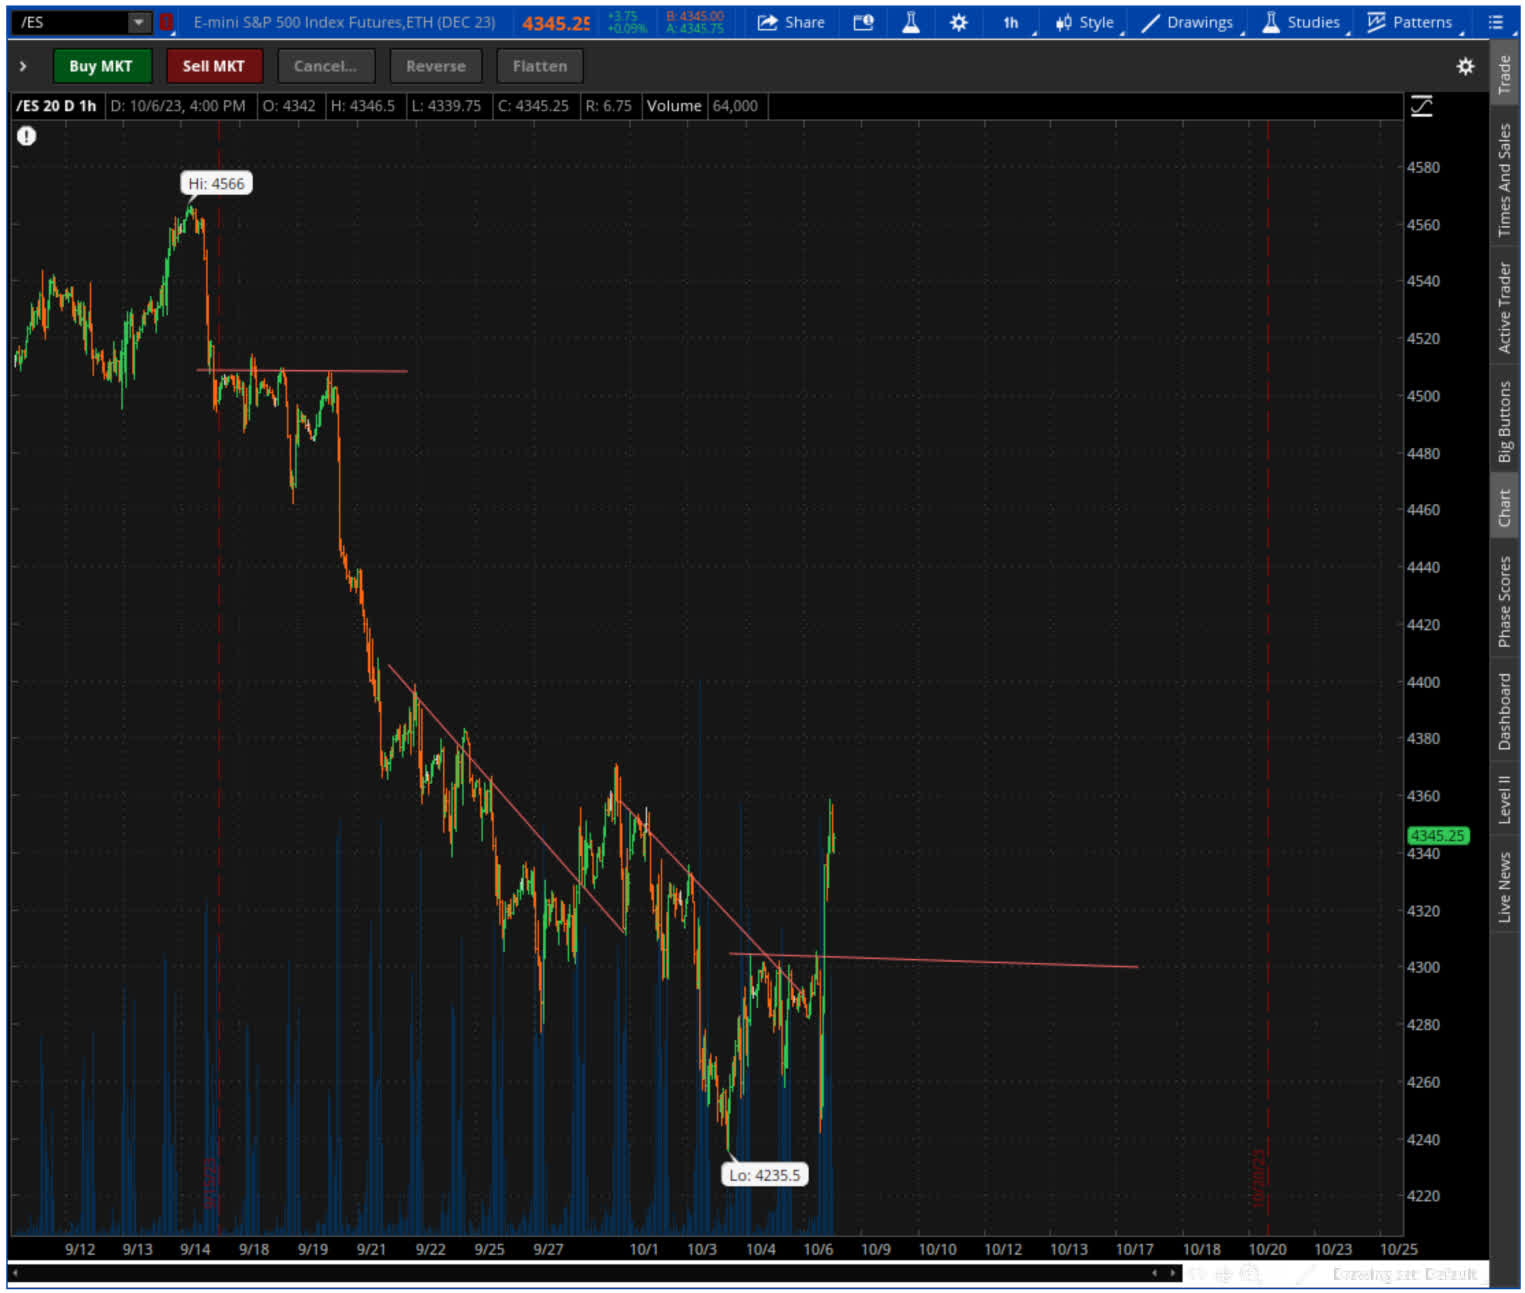
While you will not see the S&P 500 Index kissing its 200-day simple-moving average ((SMA)) on the daily chart, the overnight trading of S&P futures did kiss it (if you extrapolate their levels on the cash index), or came within a single point of the moving average everyone watches.
The first time it happened was right at the time of the German cash open at 3:00 am (Eastern time) on October 4th with S&P 500 December futures trading down to 4,235.50 (on light volume), and it happened again on Friday on the news of the better-than-expected jobs report with the futures trading down to 4,242.25 (on heavy volume).
Graphs are for illustrative and discussion purposes only. Please read important disclosures at the end of this commentary.
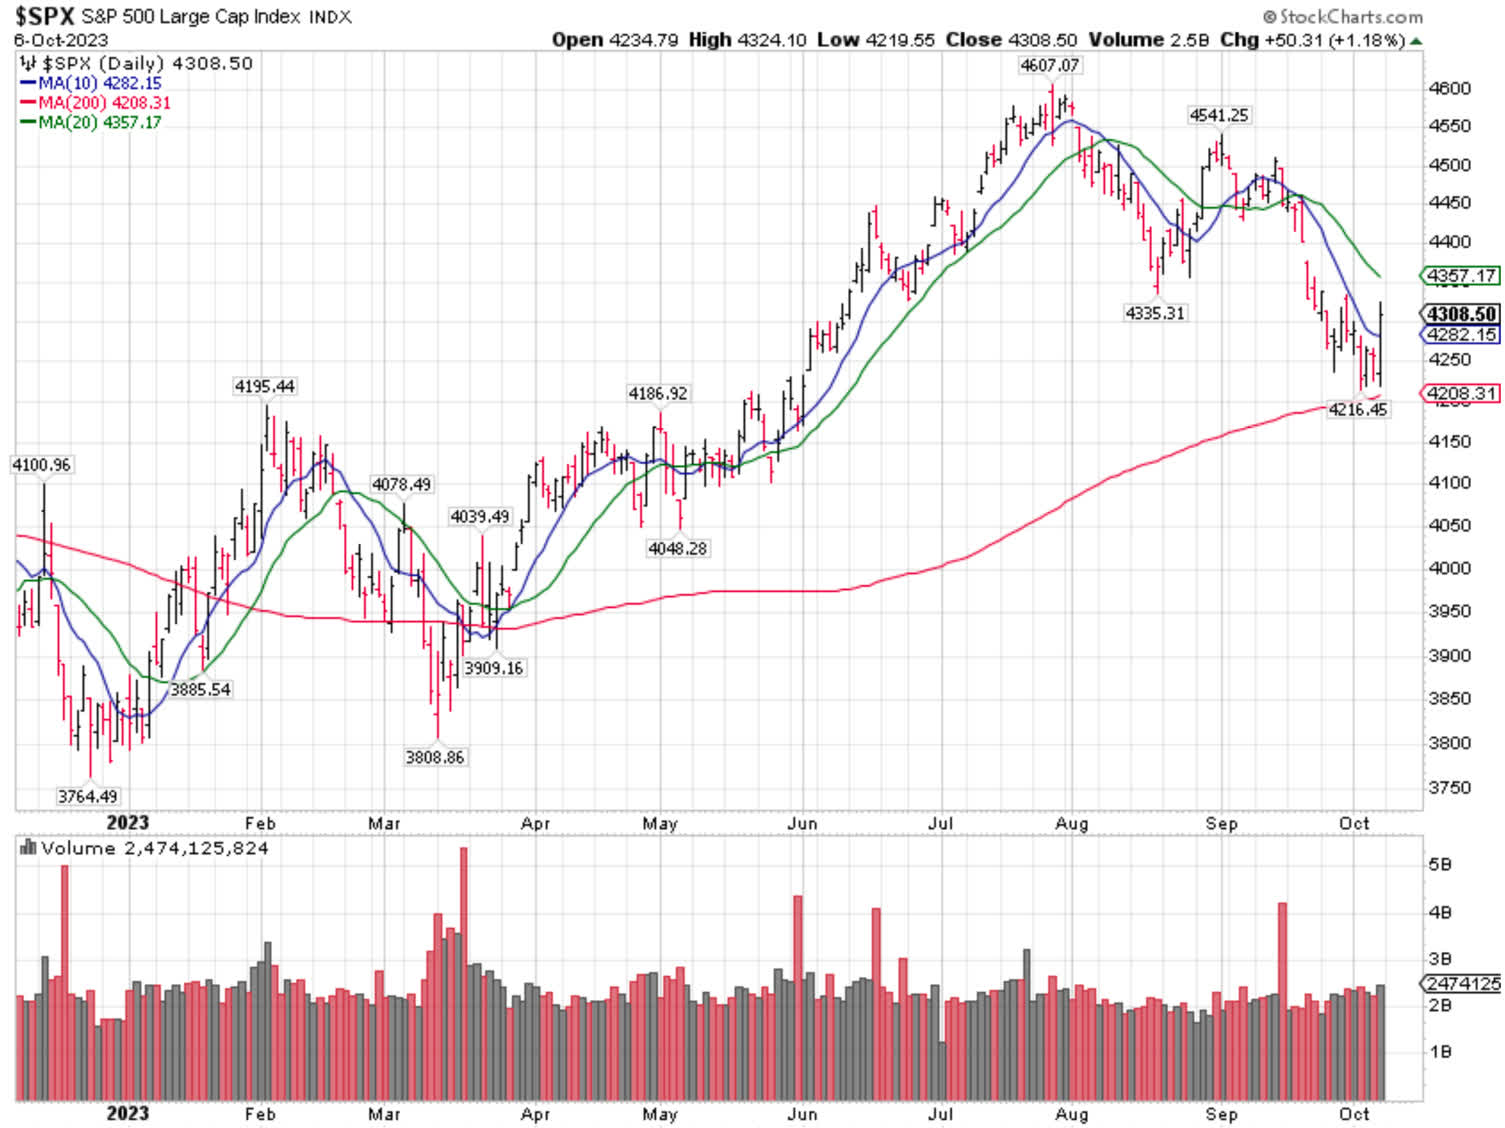
These futures levels correspond with the level of the 200-day cash index SMA (red line below). (Futures trade at a premium to the cash index, the way carry works due to interest rates).
Graphs are for illustrative and discussion purposes only. Please read important disclosures at the end of this commentary.
Why am I talking about futures? Few investors know that the notional dollar value in daily futures trading exceeds that of the cash trading at NYSE. Try shutting the futures market for a day and you will see how it affects NYSE trading — it will be very different.
Curiously, the declines in S&P 500 futures in September have had a high correlation with the direction of the moves of the 10-year Treasury futures. Because of that high correlation, I think the algorithmic traders that dominate both markets are basically connected, or the same firms run both the stock and bond ‘algorithms.’
If what we saw on Friday was a climactic top in Treasury yields, then the chances that we hit a bottom in the stock market are very high. No guarantees can be given here, but if we drift a mere 30 bps in 10-year Treasury yields lower, I think we will see a major rebound in the stock market.
Graphs are for illustrative and discussion purposes only. Please read important disclosures at the end of this commentary.
Speaking of pure bond fundamentals, I don’t think there is a need for such a yield spike. Yes, there is record issuance of Treasuries, but there is also rapidly falling inflation. A lot will be decided on Wednesday and Thursday, when the PPI and CPI indices, respectively, are released.
If Fed Chair Powell signals that we already have seen the last rate hike, as the bond market is doing the work for the Fed, bond prices will likely settle down.
But Powell is anything but a new Paul Volcker.
In his 2020 60 Minutes interview , Powell stated that there won’t be inflation, even though the Fed can print money digitally.
Here’s a transcript:
60 Minutes interviewer Scott Pelley : “You simply flooded the system with money?”
Fed Chairman Jerome Powell : “Yes, we did. That’s another way to think about it. We did.”
Pelle y : “Where does it come from? Do you just print it?”
Powell : “We print it digitally. As a central bank, we have the ability to create money digitally. And we do that by buying Treasury bills or bonds for other government guaranteed securities. And that actually increases the money supply. We also print actual currency and we distribute that through the Federal Reserve banks.”
Graphs are for illustrative and discussion purposes only. Please read important disclosures at the end of this commentary.
Different Kinds of QE Under Fed Chairs Bernanke and Powell
The key to understanding inflation is understanding the difference between the Bernanke type of quantitative easing and the Powell type – they are not the same.
Ben Bernanke as Fed Chairman flooded the system with money in a different way than Powell did. The Federal Reserve directly controls the monetary base, or M0 Money Supply. The Fed affects but does not completely control broader measures like M2.
M0 is currency in circulation and excess reserves produced by quantitative easing by paying for bonds with electronic credits at the Federal Reserve Bank of New York – that’s where they “print it digitally.” Excess reserves are the Fed’s secret weapon, as they typically are not part of broader money measures.
The Bernanke Fed oversaw a surge in M0 Money Supply that went primarily to financial institutions, where they deployed it first into fixed income securities and later into loans.
By supporting the prices of financial assets, Ben Bernanke helped the economy. Jerome Powell’s QE monetized trillions of dollars of transfer payments to businesses and consumers, directly giving them money to spend.
In Powell’s case, excess reserves directly flooded into broad measures of money supply like M2. That’s where the 26.9% surge in broad M2 money supply came from in February 2021.
Note that there is not such a surge in the broad M2 money supply under the Bernanke Fed, as his QE was for financial institutions only, while Powell’s was for everybody.
I am not saying Powell had a choice not to do what he did in 2020, as without it, we could have faced a new Great Depression, but I believe he is overdoing monetary tightening now.
All content above represents the opinion of Ivan Martchev of Navellier & Associates, Inc.
Disclosure: *Navellier may hold securities in one or more investment strategies offered to its clients.
Disclaimer: Please click here for important disclosures located in the "About" section of the Navellier & Associates profile that accompany this article.
Editor's Note: The summary bullets for this article were chosen by Seeking Alpha editors.
For further details see:
We Retested The S&P 500 200-Day Moving Average Twice Last Week