ACTV - Week On Wall Street: Q2 Begins With A Bifurcated Stock Market
2023-04-08 04:56:14 ET
Summary
- US "Manufacturing" remains in recession, while "Services" improve.
- April "Seasonality" suggests stocks will move higher, while the longer-term view suggests caution.
- Earnings season is the catalyst that can change the picture (good or bad) quickly. This implies investors have to be ready for anything.
In light of the Holiday weekend, today's article will be light on commentary and heavy on graphics.
"Lately it occurs to me, what a long, strange trip it's been." - "Truckin'", Grateful Dead
March is in the books and the tables below highlight the results for the Indices and sectors I track for the Month and Q1.
The Nasdaq Composite (+6.6%) with the associated Technology ETF ( XLK ), (+10.6%) and Semiconductor ETF ( SOXX ) (+8.5%) were the clear winners as Growth came back to life. Many if not all of the large-cap growth names are in the XLK and with those stocks rallying strong, it's no surprise that the ETF was a clear winner.
The move out of value was highlighted best in the small caps. The Small-cap value ETF lost 8%. While small-cap growth was only down 1%.
The Russell 2000 (-5%) was hit hard as it's made up of smaller regional banks and small energy companies. Both were out of favor in March.
March results (www.seekingalpha.com/mp/1232-the-savvy-investor/articles)
The Q1 and the year-to-date performance also show technology as the clear winner. In addition to Tech, Consumer Discretionary (+15.7%) also posted a double-digit gain. Note that every sector that has posted these big rallies in '23 was also the hardest hit last year. That does make me wonder if what we are witnessing is nothing more than a reversion to the mean for these groups.
YTD Results (www.seekingalpha.com/mp/1232-the-savvy-investor/articles)
The last entry of the YTD performance chart indicates that the S&P sits about 14% off the all-time high. All data as of March 31st.
Seasonality suggests upside momentum should continue.
Bespoke Investment Group;
The S&P has been up in April in all ten prior years where the index fell in the prior calendar year and then gained in Q1. April results are even more bullish when you look at the four prior times that the S&P fell more than 10% in the prior year and then gained in Q1. The same holds for the rest of the year as well.
Every time since WW2 that the S&P has fallen in the prior year and then gained in Q1, the index has posted further gains for the remainder of the year.
The Week On Wall Street
A shortened holiday trading week that was as expected - Dull. The recent rally "paused", and the S&P closed out the week drifting higher breaking a quick 2-day losing streak. The index closed at 4105 and finished the week down flat - losing 4 points in the 4-day trading week.
The Economy
Atlanta Fed's GDPNow index slid further to 1.5% for Q1 following this week's ISM-NMI and trade data. The index was at 1.71% on Monday, having dropped from 2.49% last Friday. I was skeptical of the initial 2.5%-3% forecasts and this forecast seems more in line with reality.
Friday's Nonfarm payrolls report came in as expected and from the look of the "futures," it appears to be considered a slight positive. Both the two and ten-year Treasuries moved higher.
Manufacturing in the US remains in recession.
US Manufacturing Purchasing Managers' Index posted 49.2 in March, up from 47.3 in February and broadly in line with the earlier released 'flash' estimate of 49.3.
US PMI (www.pmi.spglobal.com/Public/Release/PressReleases)
The index remains sub-50 and in contraction territory.
ISM manufacturing index dropped 1.4 points to 46.3 in March, below estimate, after edging 0.3 ticks to 47.7 in February. It is the lowest since May 2020 and has been in contractionary territory since last November.
ISM
The U.S. ISM-NMI services index fell to 51.2 in March from 55.1, leaving the measure back near the 3-year low of 49.2 in December.
ISM Services (www.ismworld.org/supply-management-news-and-reports/reports/ism-report-on-business/)
Construction spending dipped 0.1% in February following the 0.4% bounce in January. Residential construction spending remained weak, falling another 0.6% versus the 0.2% loss in January. This sector has been declining since June.
Factory orders declined 0.7% in February after falling 2.1% in January. Swings in transportation orders have been a major source of volatility and they were down 2.8% versus the 14.0% January drop. The report is weaker than expected and combined with the drop in the March ISM yesterday will add to views of a weakening economy that would limit Fed tightening. However, based on today's market reaction, the view may be changing to one where a weakening economy is not such a good sign. The crosscurrents in sentiment continue.
Factory orders (www.Tradingeconomics.com)
Three out of the last 4 months have been weaker supporting the view that manufacturing is in recession.
The Global Scene
Global Manufacturing PMIs
The recent bounce in global manufacturing was short-lived.
Euro PMI (www.pmi.spglobal.com/Public/Release/PressReleases)
Euro Countries (www.pmi.spglobal.com/Public/Release/PressReleases)
Eurozone Manufacturing PMI posted 47.3 in March, down from 48.5 in February to a four-month low.
UK PMI (www.pmi.spglobal.com/Public/Release/PressReleases)
UK Manufacturing Purchasing Managers' Index fell to 47.9 in March, down from February's seven-month high of 49.3 and the earlier flash estimate of 48.0. The PMI has stayed below the neutral 50.0 mark for eight successive months.
Canada PMI (www.pmi.spglobal.com/Public/Release/PressReleases)
The Canada Manufacturing Purchasing Managers' Index registered 48.6, down noticeably from 52.4 in February. It was the lowest reading recorded by the index since June 2020 and represented a modest deterioration in operating conditions.
China PMI (www.pmi.spglobal.com/Public/Release/PressReleases)
The Caixin China Purchasing Managers' Index posted at the neutral level of 50.0 in March. This was down from an eight-month high of 51.6 in February to signal stable business conditions at the end of the first quarter.
India PMI (www.pmi.spglobal.com/Public/Release/PressReleases)
India's Manufacturing Purchasing Managers' Index rose from 55.3 in February to 56.4 in March, signaling the strongest improvement in operating conditions in 2023 so far.
The headline au Jibun Bank Japan Manufacturing Purchasing Managers' Index rose from 47.7 in February to 49.2 in March to signal a softer deterioration in the overall health of the Japanese manufacturing sector. The negative reading was only mild, and the softest in the current five-month sequence.
Japan PMI (www.pmi.spglobal.com/Public/Release/PressReleases)
The ASEAN Manufacturing Purchasing Managers' Index printed 51.0 in March, down from 51.5 in February. The latest reading extended the current run of improving business conditions to 18 consecutive months but pointed to a weaker rate of growth compared to February which was only marginal.
Asean PMI (www.pmi.spglobal.com/Public/Release/PressReleases)
Global Services PMIs were also released this week all remain in positive territory
The headline Caixin China Services Activity Index rose further above the neutral 50.0 level in March, from 55.0 in February to 57.8, to signal a sharp and accelerated increase in service sector activity. The upturn extended the current sequence of growth to three months, with the rate of expansion the best recorded since November 2020.
UK Services PMI registered 52.9 in March, down from 53.5 in February. It was above 50 for the 2nd consecutive month.
Eurozone Composite PMI Output Index rose to its highest level since May 2022 at the end of the first quarter. At 53.7, this was up from 52.0 in February and a third successive month above the critical 50 levels.
Posting 57.8 in March, the India Services PMI was in growth territory (above 50.0) for the twentieth successive month. Despite falling from 59.4 in February
The au Jibun Bank Japan Services Index posted at 55.0 in March, up from 54.0 in February. The reading signaled a seventh successive improvement in output across the Japanese service sector that was the second-strongest in the history of the survey.
The Technical View
Today we'll take a look at the Monthly charts of the Major indices.
S&P 500 ( SPY )
S&P MONTHLY (www.FreeStockCharts.com)
NASDAQ ( QQQ )
NASDAQ Monthly (www.FreeStockCharts.com)
DJIA
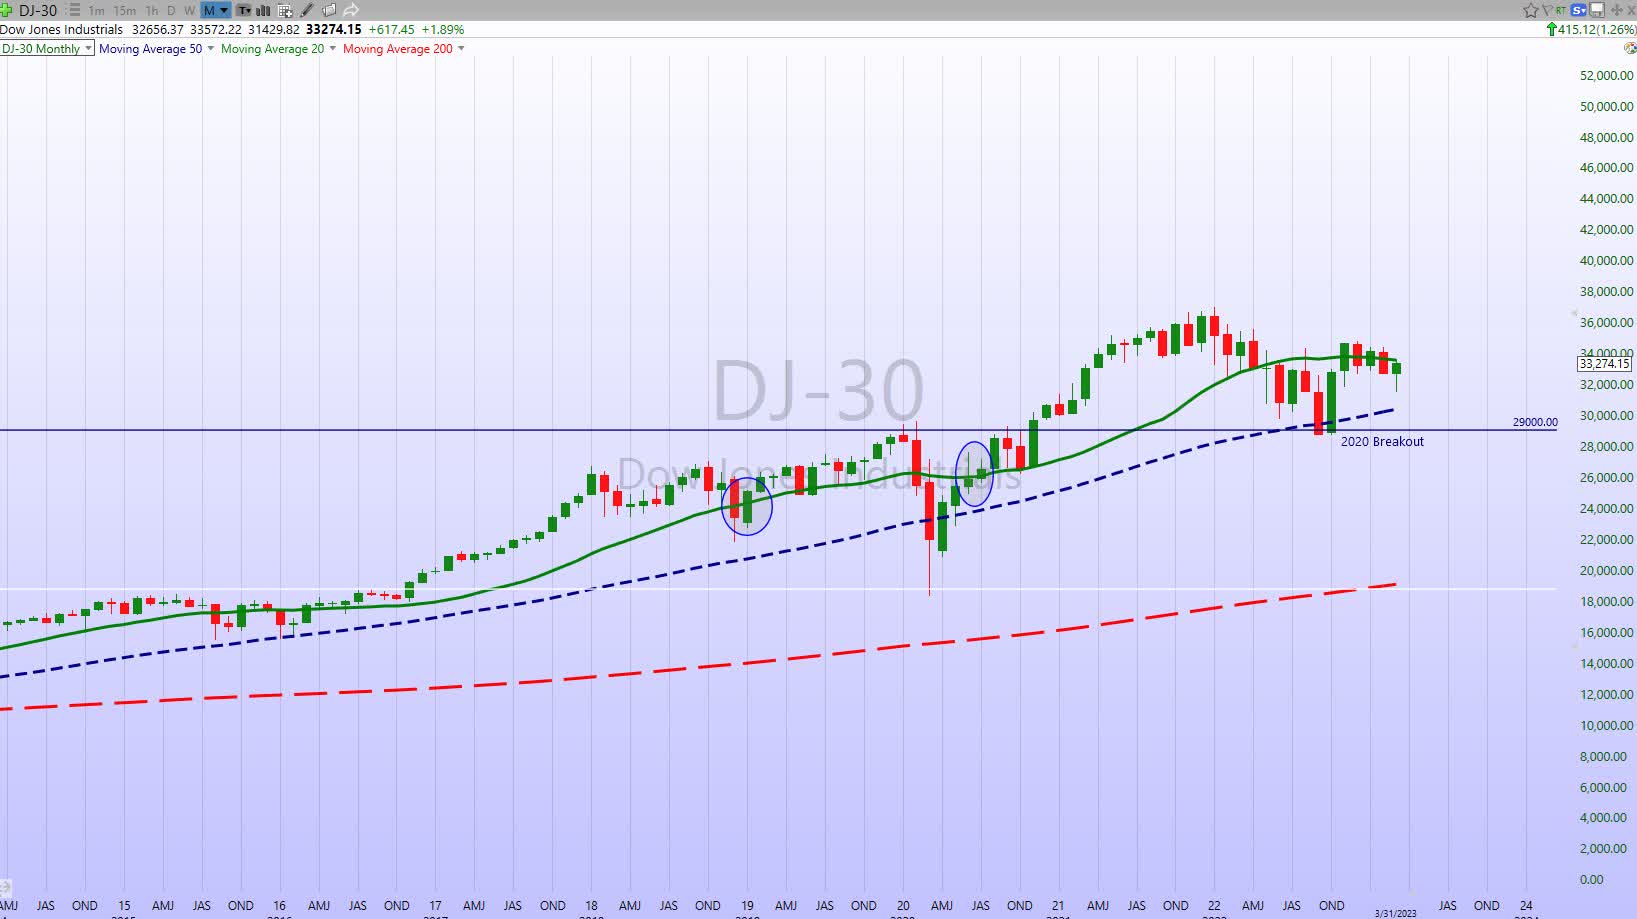
DJIA Monthly (www.FreeStcockCharts.com)
Russell 2000 ( IWM )
Russell 2000 Monthly (www.FreeStockCharts.com)
The charts all have the same thing in common. They are All below their respective 20-month moving averages (green line), a Bear market trend. That trendline is now rolling over. The technicians out there will remember this is the same "look" the indices had in 2000 and 2008. That doesn't imply we have to see the same result. But it does mean there is a decent probability that the markets could be in for turmoil in the months/year ahead.
Here is the chart of the Only sector in a Bull market trend.
Energy ( XLE )
Energy (www.FreeStockCharts.com)
For those that remember, I declared Energy in a new Bull market when the ETF crossed Above that important Monthly trendline in February 2021 (documented here). That trend has not been disturbed and remains in place today.
Final Thoughts
- This isn't a Bull market.
- Corporate Earnings will help determine the direction of the market in the next couple of quarters.
- The Fed cuts rates this year only if the economy falls off a cliff.
- Energy prices remain resilient.
Thanks to all of the readers that contribute to this forum to make these articles a better experience for everyone.
Best of Luck to Everyone!
For further details see:
Week On Wall Street: Q2 Begins With A Bifurcated Stock Market