CME - Why CME Group Is A Dividend Stock To Watch Right Now
2023-04-29 06:16:37 ET
Summary
- Chicago-based CME Group is my largest financial investment, thanks to its excellent business model, which comes with low capital requirements and a very high and sustainable dividend yield.
- The company is off to a good start this year thanks to strong volumes, higher margins, and elevated volatility.
- I believe that CME is significantly undervalued and poised to outperform its peers on a long-term basis. I'm adding to my position on stock price weakness.
Introduction
Financial stocks aren't doing so well this year. Carnage in the banking sector and elevated risks have caused significant underperformance. One stock that has done relatively well is CME Group ( CME ) , which has been a core holding of my portfolio since 2022.
Unlike regional or investment banks, this company owns exchanges, which allows it to make money on every transaction. As market turmoil often comes with elevated volatility, CME is in a terrific spot to make money and generate tremendous value for its shareholders.
In this article, I will reiterate my bullish view on CME stock, as the current dip offers a new buying opportunity for dividend investors. To support my case, I will be using the just-released quarterly earnings.
So, let's dive in!
CME's Dividends & Outperformance
CME is a financial stock. It's one of the two financial stocks in my portfolio. The other is the regional bank Huntington Bancshares ( HBAN ). The reason why I wanted CME is because of its business model.
CME Group is a global derivatives marketplace that offers a wide range of futures, options products, and other risk management and investment tools. Headquartered in Chicago, the company was formed in 2007 through the merger of the Chicago Mercantile Exchange (where its name comes from) and the Chicago Board of Trade ("CBOT"). It has since grown through additional mergers and acquisitions, including the acquisition of the New York Mercantile Exchange ("NYMEX") in 2008 and the acquisition of the Kansas City Board of Trade in 2012.
As a result, the company has a huge footprint in a wide number of futures and related options, including interest rates, equities (like the S&P 500 E-mini), agriculture (like wheat, corn, and soybeans), and energy (NYMEX WTI and Henry Hub futures).
What makes CME powerful is that it has a business model that can easily be scaled. After all, it has the infrastructure in place to offer a wide variety of financial instruments. This means that it does not need to boost capital spending in order to grow.
Also, during times of distress, elevated volatility tends to be a significant tailwind for CME, as it makes money on transactions.
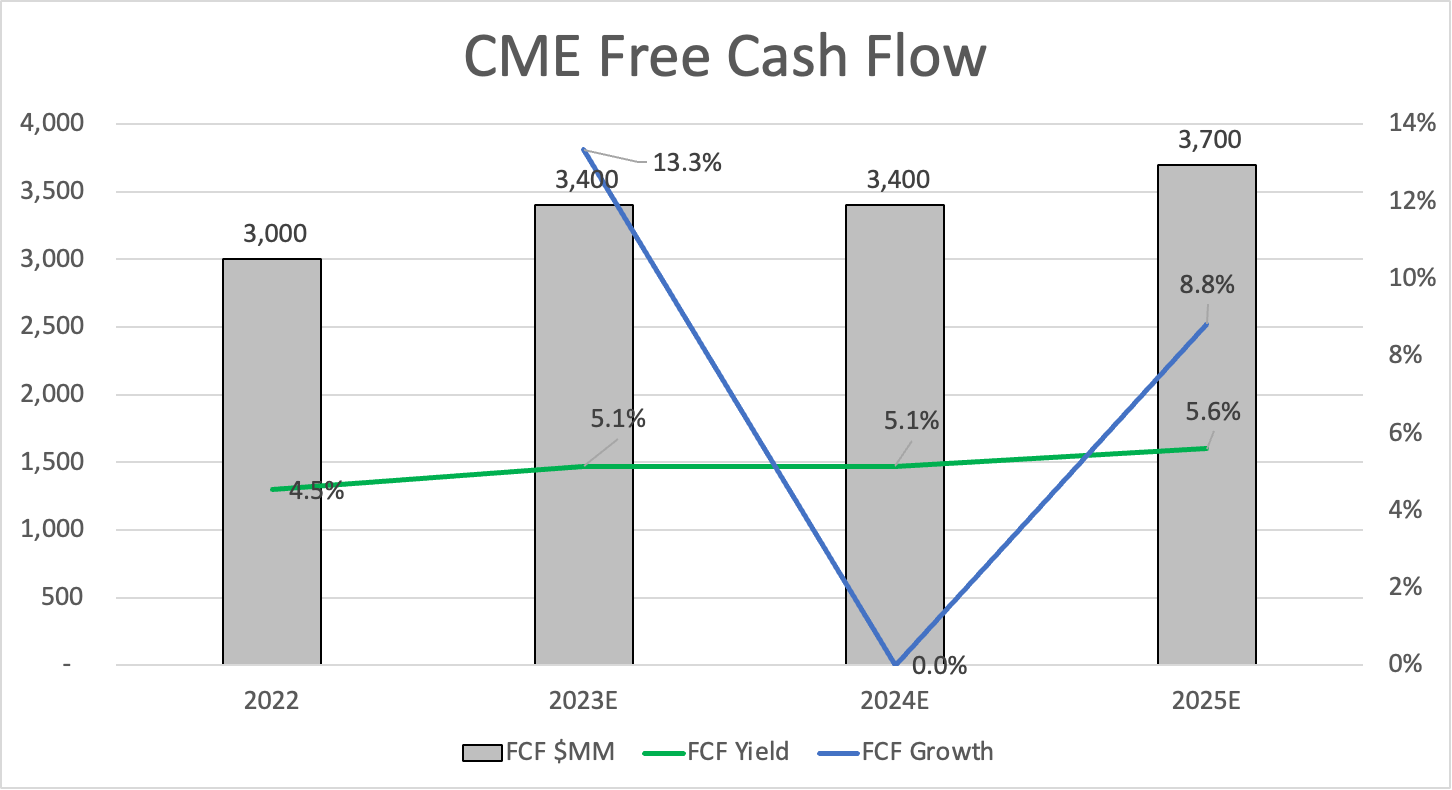
As the chart below shows, the company hasn't seen growth in capital expenditures in more than two decades. Hence, every increase in operating cash flow translates to higher free cash flow, which the company can distribute to its shareholders.
While CME has seen some major M&A in the past, it is now rather passive. According to the company :
So, we don't feel a pressure to act unless we see something where we really can create that value. So, I would say that nothing has changed in that regard. It's something that is part of our tool chest that we are happy to use when we see the right opportunity come up.
Furthermore, the company has a net leverage ratio of just 0.2x 2023E EBITDA and a credit rating of AA-. There is no need for the company to keep hoarding cash.
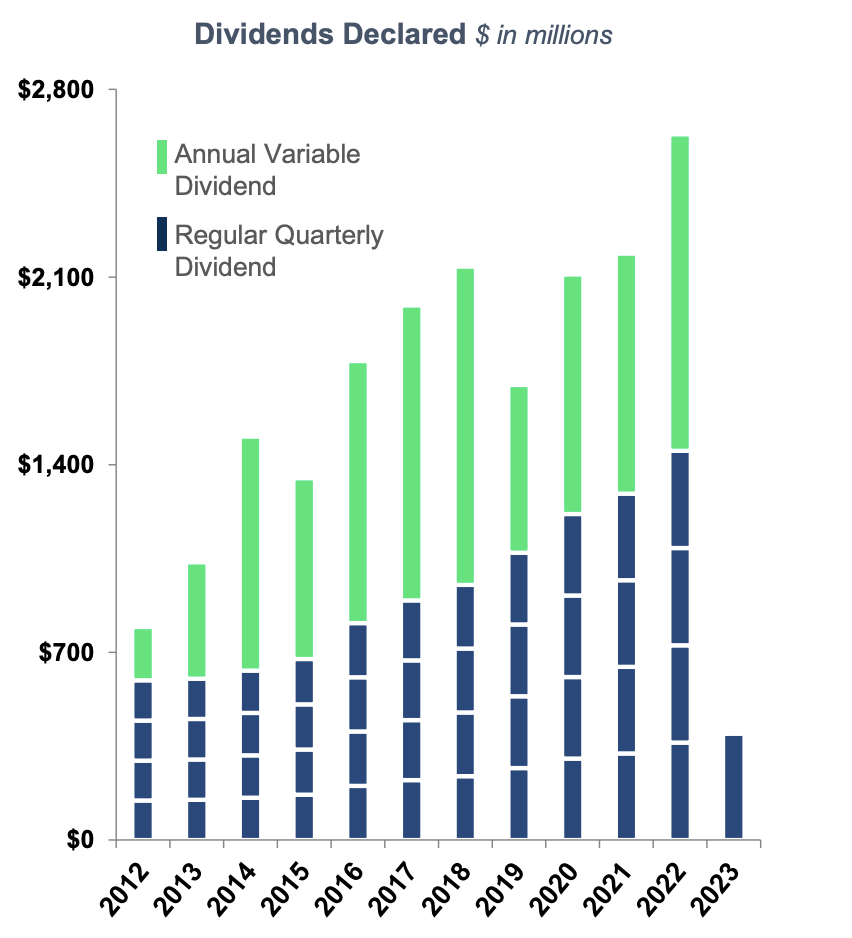
Hence, almost every penny of free cash flow ends up in investors' pockets through its regular quarterly dividend and consistent special dividends.
The graph below shows what that looks like.
Here is another chart showing the consistency of the special dividend and overall long-term dividend growth.
On a full-year basis, the company distributed $8.50 in dividends last year, which is up from $6.85 in 2021. This translates to a yield of 4.6%.
The base dividend is $1.10 per share per quarter. Going into this year, that number was hiked by 10%.
In general, I often ignore the company's regular dividend growth rate, as it isn't relevant. After all, the company distributes almost all of its free cash flow. Monitoring the free cash flow yield and free cash flow growth is way more important for assessing the quality and attractiveness of the dividend.
Please note that a decline in free cash flow does not necessarily indicate that something is going wrong. As the third chart in this article showed, free cash flow often weakens a bit after a spike in volatility. The same is happening now. This year, free cash flow is expected to grow by 13.% to $3.4 billion, which implies a 5.1% free cash flow yield. Next year, growth is expected to be (close to) zero. In 2025, an upswing of 8.8% to $3.7 billion is expected.
Needless to say, these numbers are subject to countless factors. What this shows is what we can expect in terms of organic growth under normal circumstances.
This also indicates that CME shares are attractively valued. The company is trading at 16x LTM EBITDA. That is not cheap. However, because of its characteristics, the company is valued based on free cash flow, which warrants what might seem like an elevated EV/EBITDA multiple. Using 2023 numbers, the stock is trading below 20x expected free cash flow, which is one of the cheapest valuations in over a decade.
Furthermore, the company's just-released earnings confirm that it is making great progress when it comes to new products, rates per contract, and more.
What 1Q23 Numbers Tell Us
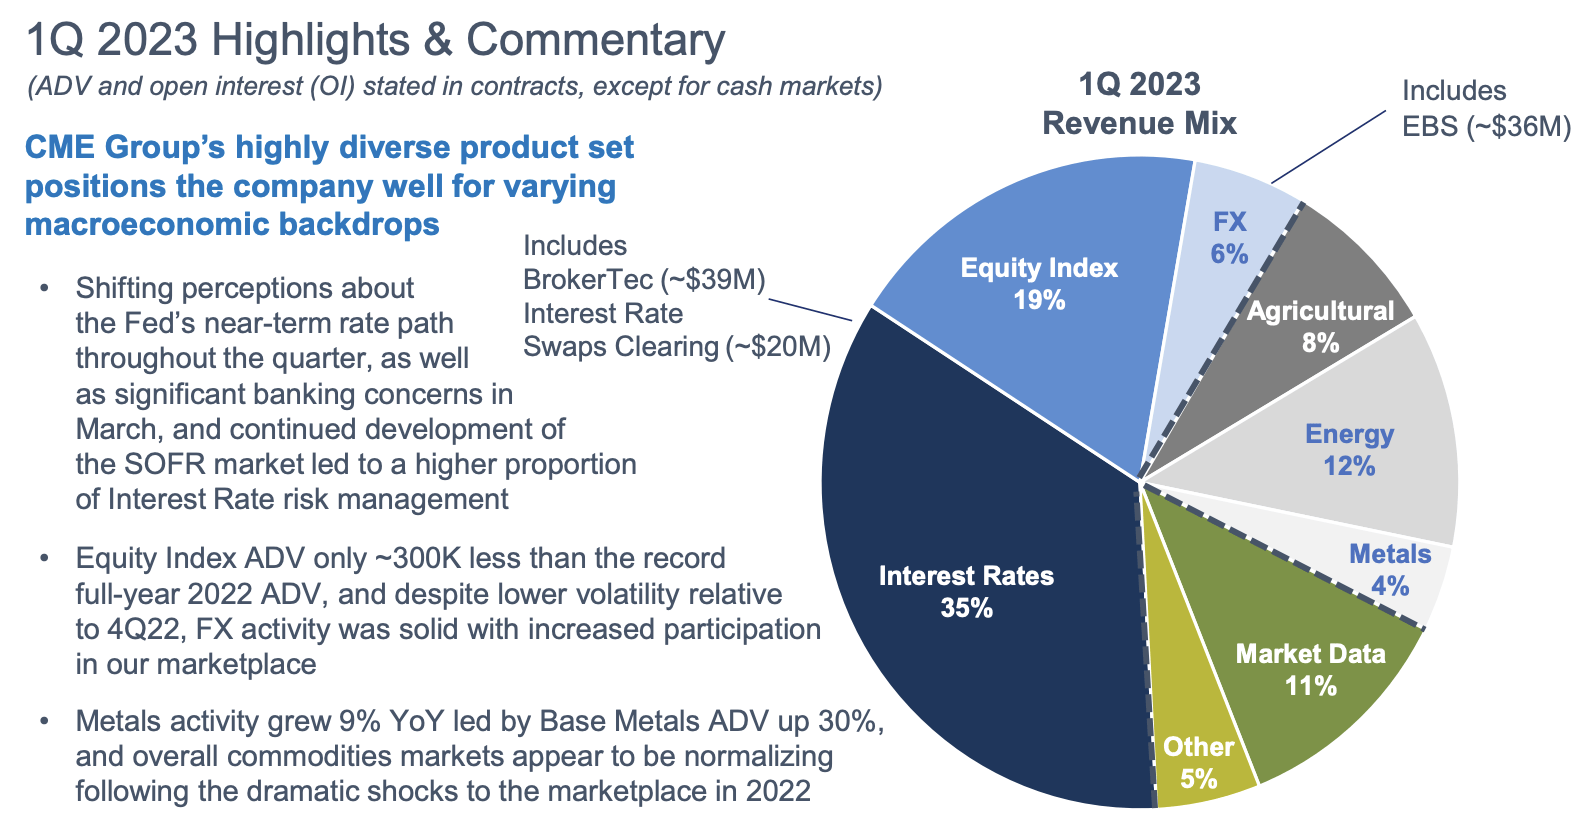
1Q23 was a stellar quarter. The company generated $1.4 billion in revenue, which was in line with estimates and 10.8% higher compared to the prior-year quarter.
This allowed the company to report adjusted EPS of $2.42, which beat estimates by $0.04.
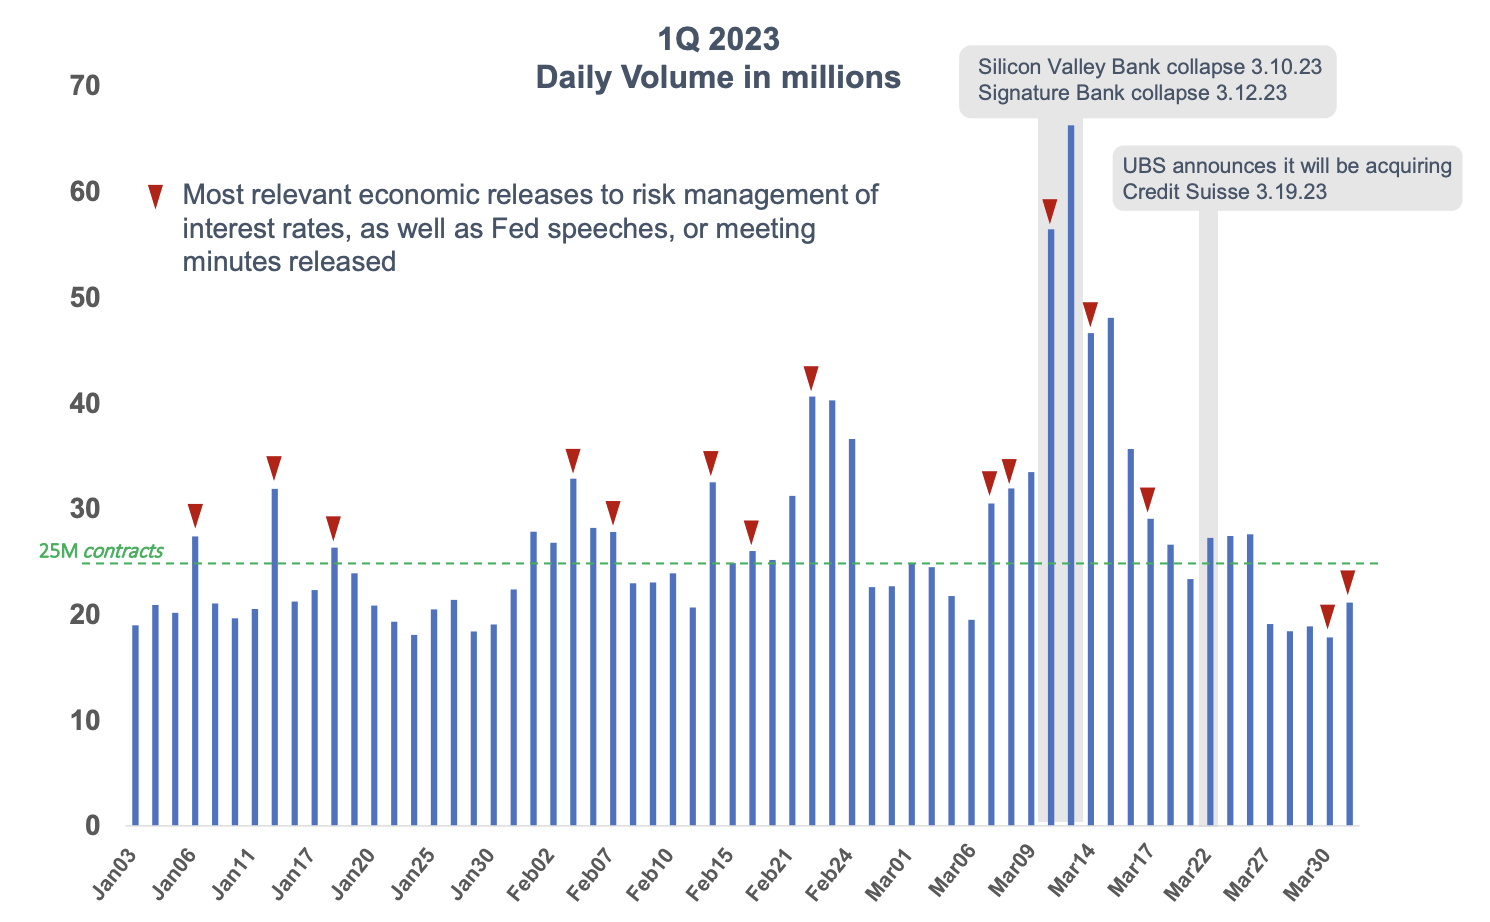
The company reported an average daily volume ("ADV") increase of 4% to 26.9 million contracts from an already strong first quarter in 2022, barely missing its all-time record of 27 million contracts. The quarter included CME's highest single-day volume on March 13th of 66.3 million contracts. Record March SOFR future's ADV of 5.2 million contracts exceeded the previous record set in Eurodollar futures. CME migrated its Eurodollar open interest to SOFR without issue on April 15th. The need for interest rate risk management provided a 16% growth rate in CME's interest rate ADV to a record 14.5 million contracts.
On a side note, the chart below shows daily volume in the first quarter, which reinforces my statement that CME thrives when markets become nervous.
Furthermore, there's news regarding investments in growth.
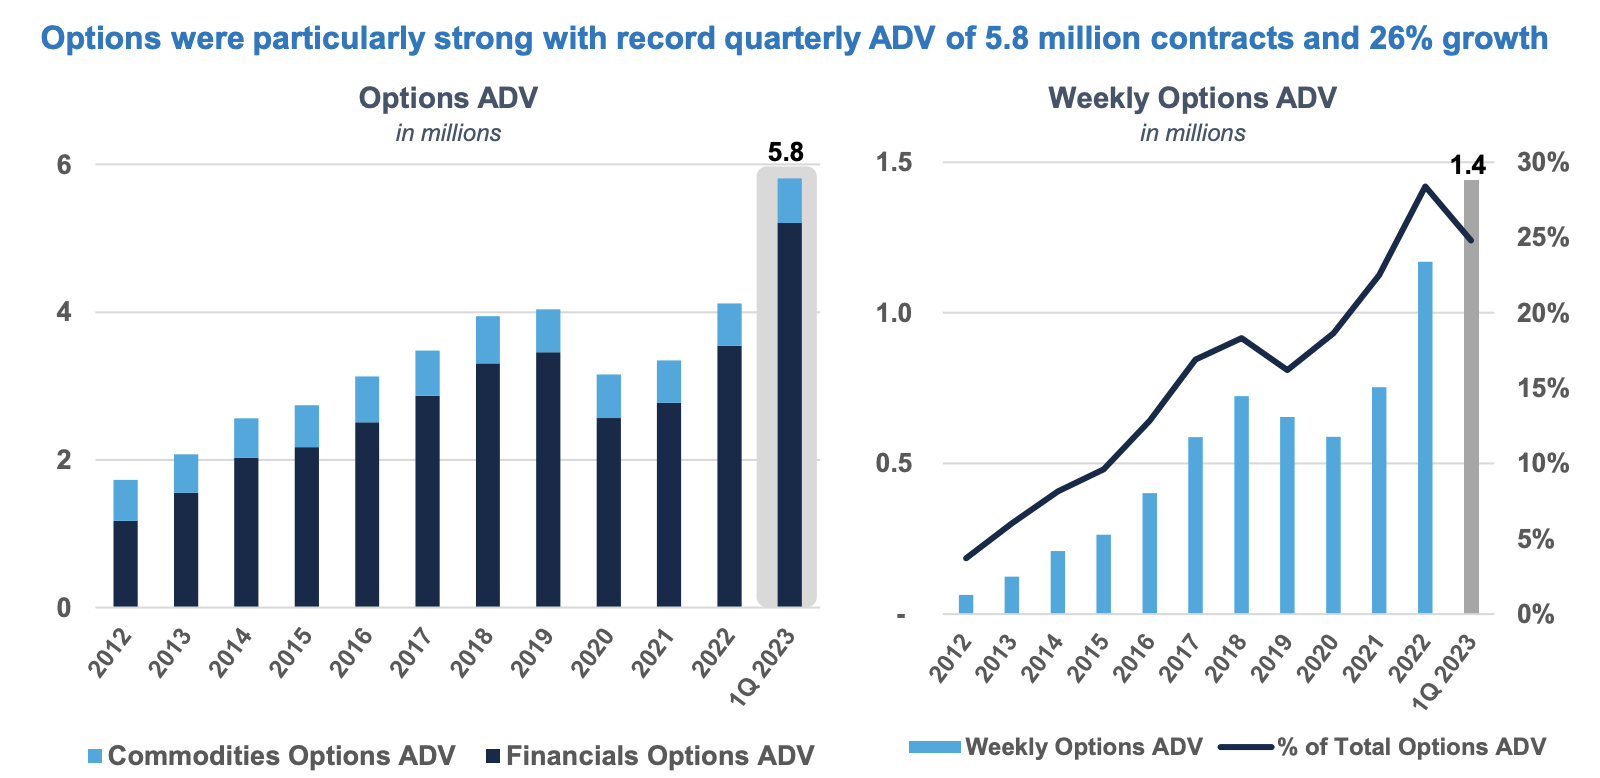
CME Group's investment in building out its options franchises paid off, with first-quarter options ADV growing 26% year-over-year to a record 5.8 million contracts. First-quarter options revenue grew 12% to a record $218 million, including double-digit growth across interest rates, equities, and metals and 30% growth in non-US trading activity. CME Group's revenue grew 7% YoY to over $1.4 billion, with market data revenue up 9% YoY to $166 million.
Adding to that, the company reported strong margins on its contracts.
Overall 1Q23 futures and options RPC (revenue per contract) was 66.4 cents, up from 65.1 cents in 4Q22, in part due to a lower member mix across several asset classes (energy, equity index, and FX) and reflected two months of impact from the pricing changes put in place this year.
However, in its massive rates segment, RPC was down 1% compared to 4Q22. This could have been a huge red flag, which is why it was addressed by analysts during the earnings call. The company explained that the 1% quarter-on-quarter decline in rates RPC was due to the huge growth in short-term interest rate futures (STIRs), which have a lower RPC of about $0.10 below the Eurodollar complex. This increase in STIRs was driven by the silver futures and options, which led to lower RPC despite the hike. However, the RPC for SOFR futures and options post the February 1st increase are now matching the historic levels of Eurodollar futures and options. So, the drop in RPC relative to the much stronger growth in STIRs is not surprising and was expected.
In general, I would say that RPCs need to be taken with a grain of salt, as CME is bringing a lot of new products online and sometimes using lower rates to gain market share.
That said, current developments are very promising.
Expected Outperformance
In light of ongoing banking woes and the risks related to overtightening from the Fed, I expect that CME will continue to outperform its peers.
I also expect CME to outperform the Broker-Dealers & Securities Exchanges ETF ( IAI ). In this ETF, Morgan Stanley ( MS ) and Goldman Sachs ( GS ) have a combined weighting of roughly 40%.
Over the past ten years, CME has outperformed this ETF by more than 60 points.
CME has outperformed the market by an even wider margin during this period, mainly because the broker-dealer and exchanges industry is home to some fantastic stocks that offer tremendous long-term value.
While there is no guarantee that CME won't fall during sell-offs, it has a business that protects its investors against mayhem. I feel very good knowing I have money in CME, and I am using the current stock price weakness to add to my position.
This decision is based on the current decline and the fact that I have recently added to other investments, which has made CME one of my smaller holdings. So, it's time to boost my stake.
Takeaway
In this article, we discussed CME Group, my largest financial holding. The company is off to a good start this year, as it continues to benefit from strong volumes, improving margins, and an outlook of strong free cash flow used to pay a dividend yield that could come close to 5%. Thanks to very low capital expenditures, an extremely healthy balance sheet, and no imminent M&A plans, CME is able to distribute almost all of its free cash flow to shareholders.
Especially in current times, I believe in the power of owning a company that benefits from elevated volatility.
This is also why I expect CME stock to outperform the market and its peers in 2023 and on a long-term basis.
I will likely increase my position in the next few weeks, as I believe that CME is trading at an extremely attractive valuation.
For further details see:
Why CME Group Is A Dividend Stock To Watch Right Now