WSM - Williams-Sonoma: Cash Flow Weaker Than It Seems
2023-11-14 02:47:26 ET
Summary
- Williams-Sonoma expects single-digit revenue growth and 15%+ operating margin in the long term.
- The company's revenue and growth rates have been declining, including net earnings and operating cash flow.
- The B2B segment of Williams-Sonoma's business is relatively small and may not be enough to offset the slowdown in the "trade" segment.
Investment Thesis
Preview
We initiated our overage on Williams-Sonoma (WSM) in " Williams-Sonoma: Priced To Perfection " with a "hold" rating in January this year. The stock has been lower for the next eight months and only climbed up recently. It is currently about 17% above where it was in January. Our thesis was built on the fact that the company has large imbalances between its account receivables and account payables, combined with the prospect of weaker consumer sentiment, a longer cash conversion cycle could emerge for the company in the near term.
Updates
Williams-Sonoma is expecting a long-term growth trajectory in the single digits in revenue and 15% or higher in operating margin, according to its Q2 presentation.
wsm (wsm)
To stack this up against its past performance, it seems that the company anticipates its topline growth will at least revert back to the levels before 2020 while the operating margin will stay elevated, since its latest quarterly YoY revenue growth has become negative in the teens.
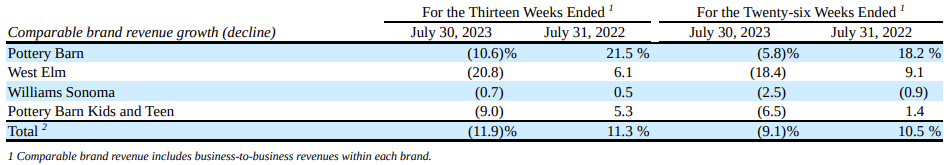
Each brand's growth rate has been in decline for the latest quarter. According to its 10Q , the lower-end price point brand "West Elm" had the largest decline by 20.8% for the quarter YoY, while "Williams Sonoma", the namesake brand aiming at the middle to higher-end price point had stayed mostly flat. "Pottery Barn" together with "Pottery Barn Kids and Teen", which are part of the higher price point brand, had around a 10% decline after rising by around 20% in the same quarter last year. Look through its news release for this year, besides the dividend/earnings announcement and collaboration with specific designers, the rest was mostly related to kids, babies, or teens.
WSM: Quarterly Revenue Growth by Brand (Company FY2023 Q2 10Q)
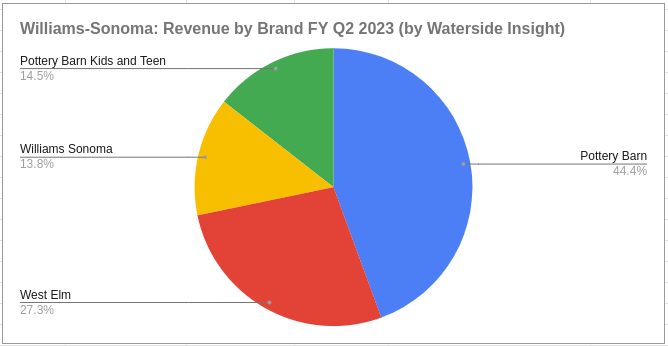
The higher price point brands together accounted for 72.7% of its total net revenue. With their decline to be about half of the lower price point brand, which makes up the rest of the revenue, the company was able to lessen the negative effect brought on by the slowdown of the housing market.
WSM: Revenue Composition by Brand (Calculated and Charted by Waterside Insight)
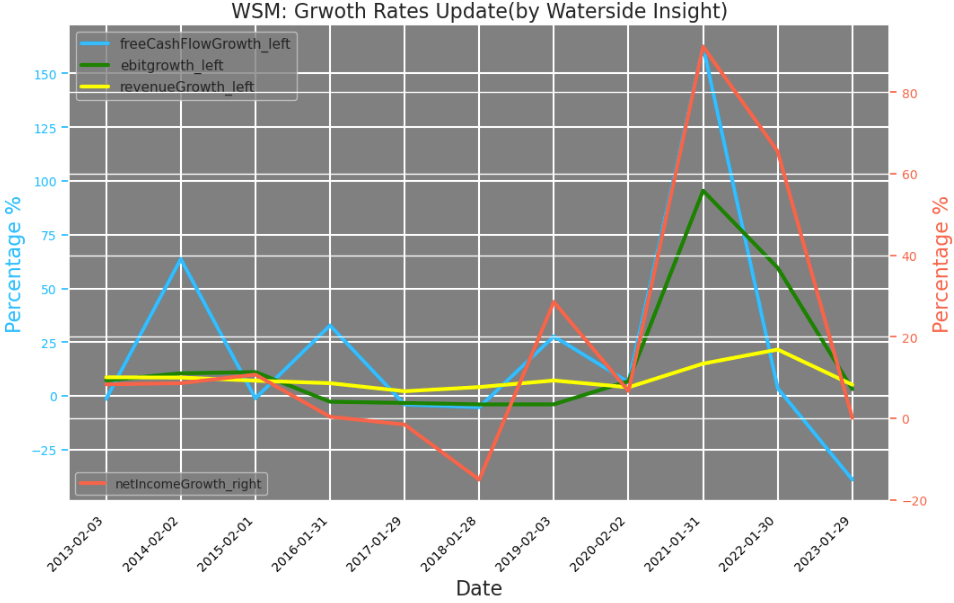
The declining growth of its revenue is not unique. There has been an overall decline in growth rates across free cash flow, EBITDA, and net income. Although this is declining from the heights during the pandemic, the momentum is not turning stable yet, especially for the free cash flow growth, logging more than a 25% decline.
WSM: Growth Rates (Calculated and Charted by Waterside Insight)
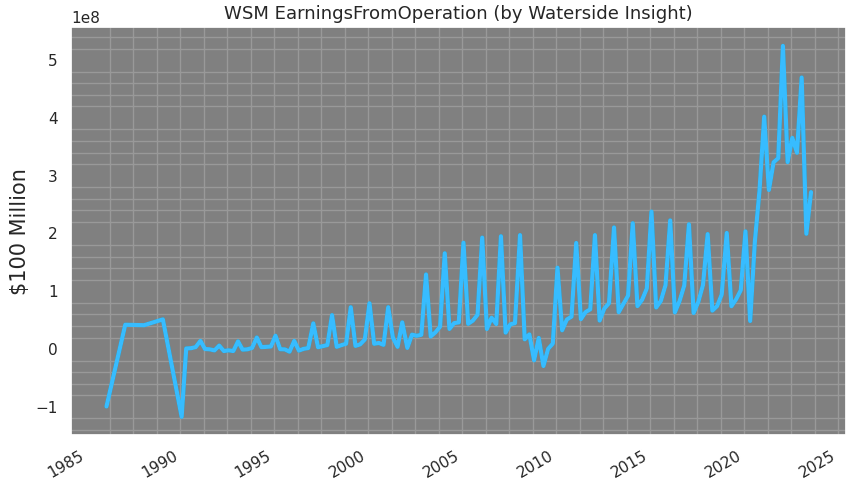
On an absolute value basis, its earnings from operation have erased a large part of the pandemic gains, although it is still higher by about 30-40%.
WSM: Earnings from Operations (Calculated and Charted by Waterside Insight)
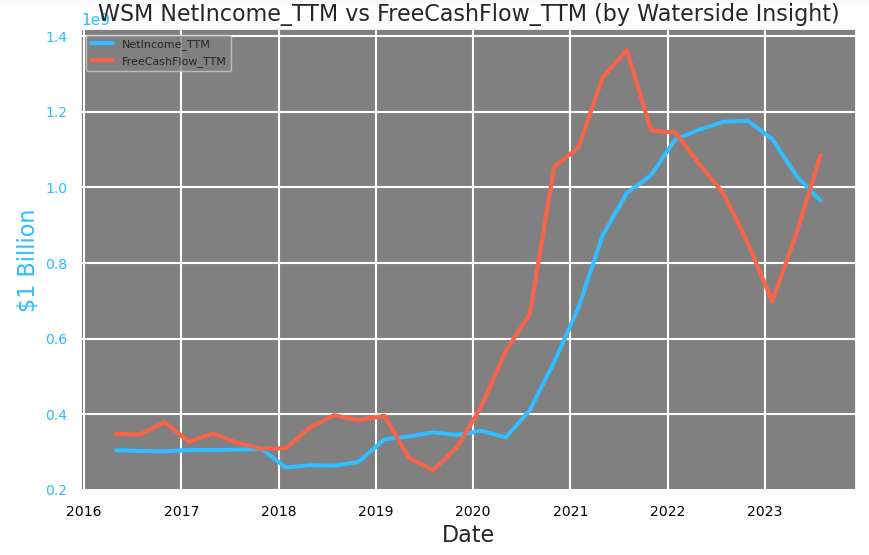
Although Williams-Sonoma's net earnings or net income on a TTM basis has been falling since early this year, its TTM free cash flow, on the contrary, has been rising during the same time.
WSM: Net Income vs Free Cash Flow TTM (Calculated and Charted by Waterside Insight)
The support of its free cash flow came from higher operating cash flow, but given the YoY decline of net income, what was the provision to its higher operating cash flow? It turned out to be its inventory and account payables. In FY Q2, its merchandise inventory was 21.64% of its operational cash flow, and its accounts payables were 12.29%. Together they accounted for 34% of the total operational cash flow and increased by $478 million or about double YoY. On the other hand, its net income, which accounted for about 50% of operations cash flow, declined by 31% YoY. These two items, inventory and accounts payables, more than made up for the decline, and its operational cash flow ended the quarter with an 86% increase YoY.
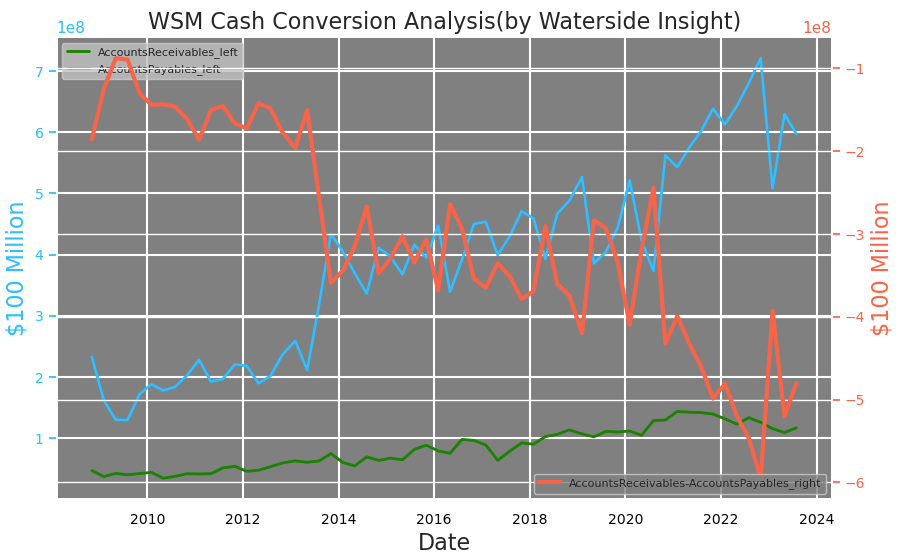
Furthermore, the gap between Williams-Sonoma's account receivables and account payables is still at its widest negative value in the past twenty years. Along with its rising inventory, they are leading to a longer working capital conversion cycle.
WSM: Cash Conversion Analysis (Calculated and Charted by Waterside Insight)
Its annual inventory has risen to a level double where it was in 2021, at a historic high.
Its account receivables, which are the payments made by customers with any format of credit, such as credit cards, have had a slight decline since 2022. The company made an effort at the start of the year to cut down the payables, which were supposed to be paid down within the calendar year, resulting in a one-time reduction in Q1 FY2023 but followed by a rise later. This increase in itself indicates it is buying more goods with credit than cash, which coincides with its current ratio of 1.2x, one of the lowest levels in the company's history. Its cash conversion cycle was about 66 days at the end of last quarter, similar to where it was at the same season last year. But its average cash conversion cycle this year has gone up to 62 days, compared with 52 days last year. Given the holiday season would typically see a slightly longer cycle, the average of FY 2023 is expected to be longer and putting more pressure on its cash flow, as we expected in the previous article .
Williams-Sonoma has stressed that "it is no longer a home furnishing business", and it has also extended into the business-to-business market. But when we look at its 10Q , the B2B revenue numbers were all embedded in each brand's reporting and there is no specific number of what that part of business looks like. In other words, they could be too small to be separately reported. However, there was some vague indication of what this part of business looks like during the company's FY Q2 earnings release. Its CFO said the company's B2B business was down 5% sequentially QoQ, while contract business was up by 23% QoQ. He went on to explain that there are two folds to its topline, "trade" and "contract". "Trade" is about volume while "contract" is more stable over time. He went on to explain that "trade" was more impacted by the slowdown of the housing market and overall sentiment of spending, and "contract" was thriving in growth. So if we assume the "trade" part of the business growth is similar to the overall revenue growth, which was down 11% QoQ, as we quoted from its 10Q earlier, then we can back out its "contract" part of the business was about one-sixth or 17% of the total B2B business while the "trade" is about 83% of the total B2B business. Although this is our estimate based on assumptions, we think the actual portion is not far from it. B2B is already too small to be quoted independently from the segment revenue, then although one-sixth of B2B is solid in growth, it is not enough to hang the hat on to counter the slowdown of "trade", in our opinion.
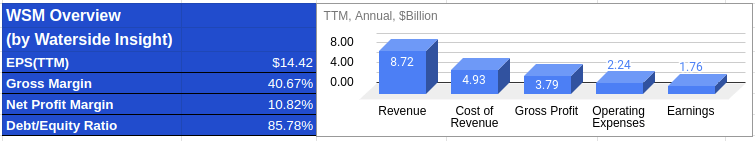
Financial Overview & Valuation
WSM: Financial Overview (Calculated and Charted by Waterside Insight)
Based on the analysis above, we use our proprietary models to assess the fair value of Williams-Sonoma with a ten-year forward projection. We have become more bearish than our previous estimate on its near-term cash flow as the company is showing signs of struggling to generate sufficient cash flow to pay for its supplies. Although it is not an immediate threat to its bottom line, it will eventually need to be reckoned with. We assume a cost of capital of 8.06% and a WACC of 10.55%. In the base case, compared with our previous assumption , the company has indeed brought down its short-term liabilities by about 10% since then, but the cash flow has become worse than expected, we revised the fair value in this case down to $99.26. In the bullish case, our previous estimate assumed that the company would be able to generate better cash flow and refloat its liquidity ratios. So far, we haven't seen that happening. It can still make improvements in the next 12-18 months, but with its inventory and account payables staying high, it is hard to make that transition. The bullish estimate has been revised down to $148.36. In the bearish case, our previous estimate assumed a flat cash flow, which will be unlikely given the scope of the decline of net income; it was also revised down to $83.36. The current stock price is above our bullish valuation, indicating a rich premium is priced in.
WSM: Fair Valuation (Calculated and Charted by Waterside Insight)
Conclusion
After a strong surge during the pandemic, Williams-Sonoma strived for steady long-term growth at a higher level than pre-pandemic. The company's recent decline in revenue and earnings, albeit coming down from a higher level, is putting pressure on its cash flow. The cash flow constraints, as we pointed out in our previous article in January, however, have been in place pre-dated the current slowdown. Given its lower current ratio and longer cash conversion cycle as we expected, the constraints from the slowdown will become more apparent in the next two quarters. The holiday season usually sees a stronger performance for the company, but we expect YoY comparison to still be lower. Overall, we revised down our fair valuation based on a number of differences between our expectations and how it has played out this year. We will sell into the current rise of its stock price.
For further details see:
Williams-Sonoma: Cash Flow Weaker Than It Seems