XAR - XAR: A Solid ETF To Capture Record High Defense Spending In 2024
2023-12-17 07:15:20 ET
Summary
- SPDR S&P Aerospace & Defense ETF is a buy due to its solid performance, low expense ratio, and expected growth in the aerospace and defense industry.
- XAR has the heaviest weights on undervalued Spirit AeroSystems and Huntington Ingalls Industries giving the fund a competitive advantage over PPA and ITA.
- Aerospace and defense ETFs are likely to do well in 2024 given record high defense spending.
Investment Thesis
SPDR S&P Aerospace & Defense ETF ( XAR ) is a buy due to its solid performance, low expense ratio compared to peers, and expected growth of the aerospace and defense industry. A key downside to XAR and compared peer ETFs is their relatively low dividend yields. While Invesco’s Aerospace & Defense ETF ( PPA ) has shown slightly better historical long-term performance, XAR has a holding mix that can position the fund to take the lead looking forward.
Fund Overview and Compared ETFs
XAR is an ETF that seeks to track the Aerospace and Defense Select Industry Index. With its inception in 2011, the ETF has 32 holdings and almost $2B in AUM. Not surprisingly, the ETF has 100% weight on the aerospace and defense sector. Peer competitor ETFs used for comparison purposes in this article are iShares U.S. Aerospace & Defense ETF ( ITA ) and PPA. PPA follows the SPADE Defense Index while ITA tracks U.S. equities in the aerospace and defense sector. Due to these different objectives, the funds have distinct holdings differences I will cover later.
Performance, Expense Ratio, and Dividend Yield
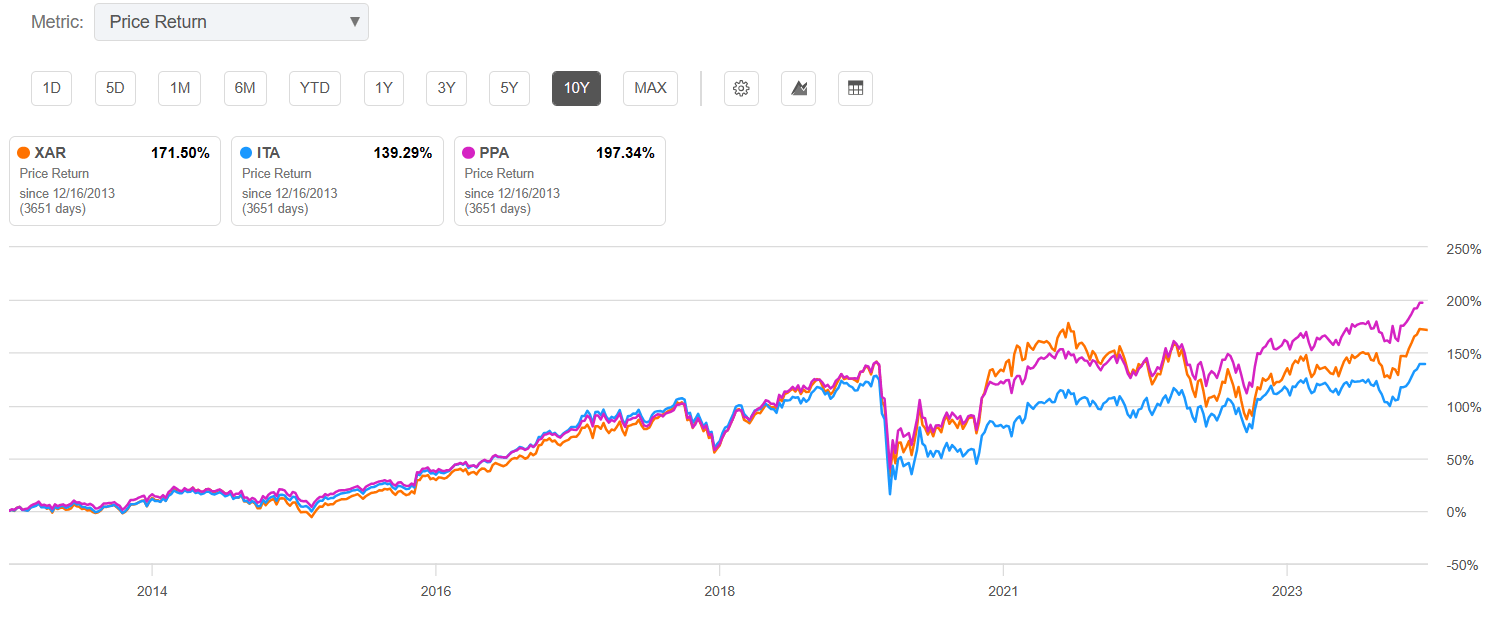
XAR has a 10-year CAGR of 11.35%. This is notably ahead of ITA’s 9.91% 10-year CAGR, but below PPA’s at 12.41%. While XAR lags PPA, it has the lowest expense ratio of 0.35%, compared to ITA (0.40%) and PPA (0.58%).
10-Year Price Return: XAR and Peer Competitors (Seeking Alpha)
Defense sector ETF investors are likely to be disappointed with the dividend yields for any of these three funds. XAR, for instance, has a mere 0.37% yield. Additionally, its 3-year dividend CAGR is -12.74%. This is roughly on par with ITA and PPA which both have negative dividend growth but slightly higher yields.
Expense Ratio, AUM, and Dividend Yield Comparison
| XAR |
| ITA |
| PPA |
| Expense Ratio |
| 0.35% |
| 0.40% |
| 0.58% |
| AUM |
| $1.94B |
| $5.96B |
| $2.54B |
| Dividend Yield TTM |
| 0.37% |
| 0.79% |
| 0.47% |
| Dividend Growth 3 YR CAGR |
| -12.74% |
| -9.78% |
| -12.76% |
Source: Seeking Alpha, 16 Dec 23
XAR’s Holdings and Its Competitive Advantage
XAR has 32 holdings with a composition that is significantly different from ITA and PPA. First, XAR’s top holding is Spirit AeroSystems Holdings, Inc. ( SPR ), while ITA and PPA have less than 1% weight on SPR. The second key difference is XAR’s notably lower weight on The Boeing Company ( BA ). Finally, XAR has a significantly higher weight on Huntington Ingalls Industries, Inc. ( HII ).
Top 10 Holdings for XAR and Competitor ETFs (Key Differences Bolded)
| XAR – 32 holdings |
| ITA – 33 holdings |
| PPA – 54 holdings |
| Spirit AeroSystems – 5.38% |
| Boeing – 20.08% |
| Boeing – 7.52% |
| L3Harris Technologies – 4.41% |
| RTX – 16.47% |
| RTX – 6.29% |
| Huntington Ingalls – 4.35% |
| Lockheed Martin – 7.23% |
| Lockheed Martin – 6.02% |
| Boeing – 4.35% |
| L3Harris Technologies – 4.95% |
| Northrop Grumman – 6.00% |
| Axon Enterprise – 4.23% |
| Axon Enterprise – 4.83% |
| General Electric – 5.35% |
| General Dynamics – 4.13% |
| General Dynamics – 4.70% |
| General Dynamics – 4.82% |
| TransDigm Group – 4.06% |
| TransDigm Group – 4.56% |
| L3Harris Technologies – 4.78% |
| Virgin Galactic – 4.01% |
| Northrop Grumman – 4.46% |
| Honeywell International – 4.24% |
| Heico Corp. – 3.99% |
| Howmet Aerospace – 4.44% |
| TransDigm Group – 4.15% |
| Howmet Aerospace – 3.97% |
| Textron Inc. – 4.27% |
| Axon Enterprise – 3.95% |
Source: Multiple, compiled by author on 16 Dec 23
Any ETF investor knows that a fund’s overall performance is directly tied to the strength of its individual holdings. XAR represents distinct qualities in its holdings that prime it for growth, potentially ahead of both ITA and PPA. I will cover three of them below.
XAR’s Top Holding of Spirit AeroSystems
The first strength of XAR is its top holding of SPR. On the surface, Spirit AeroSystems may seem like a risky bet to have as a top holding. SPR has a TTM gross profit margin of -2.43% and net income margin of -16.83%. Additionally, its return on total capital, return on total assets, and FCF margins are all in the red. However, it is currently quite undervalued with a forward price/sales ratio 58% below its industry average and forward EV/sales 34% below its industry average. This undervaluation is due to multiple factors including a 24.78% forward revenue growth. Additionally, the company has a new CEO, Patrick Shanahan , who is respected as the previous Deputy Secretary for Defense and long-time Boeing veteran. Therefore, SPR represents the first secret weapon for XAR pulling the lead looking forward.
Lower Weight on Boeing Co.
The second potential upside for XAR is a slightly lower weight on Boeing. While Boeing has recovered nicely from 737 MAX crashes in 2018 and 2019 along with multiple high-profile airplane orders, it appears significantly overvalued at the moment. BA has demonstrated a one-year price return of almost 44%. Its forward EV/EBITDA is 173 compared to an industry average of 11.5. Additionally, its Q3 2023 net income was negative $1.63B, the lowest in the past four quarters. Therefore, XAR might be well positioned to lead defense and aerospace ETFs by maintaining a lower weight on BA.
Heaviest Weight on Huntington Ingalls
The final potential ingredient to XAR’s future success is its weight on HII. HII has seen a 10-year total return of almost 200% and indicates several strong growth factors. The company saw 14.9% YoY gross profit growth last quarter and $1B in operations cash flow over the trailing twelve months. HII is also attractively valued with a forward P/E GAAP almost 20% below its industry average and forward price/sales 34% below its industry average. A final positive point for HII is its 2.05% dividend yield along with 10.7% 5-year growth rate. Therefore, I believe HII is the third component to propel XAR moving forward.
Valuation and Risks to Investors
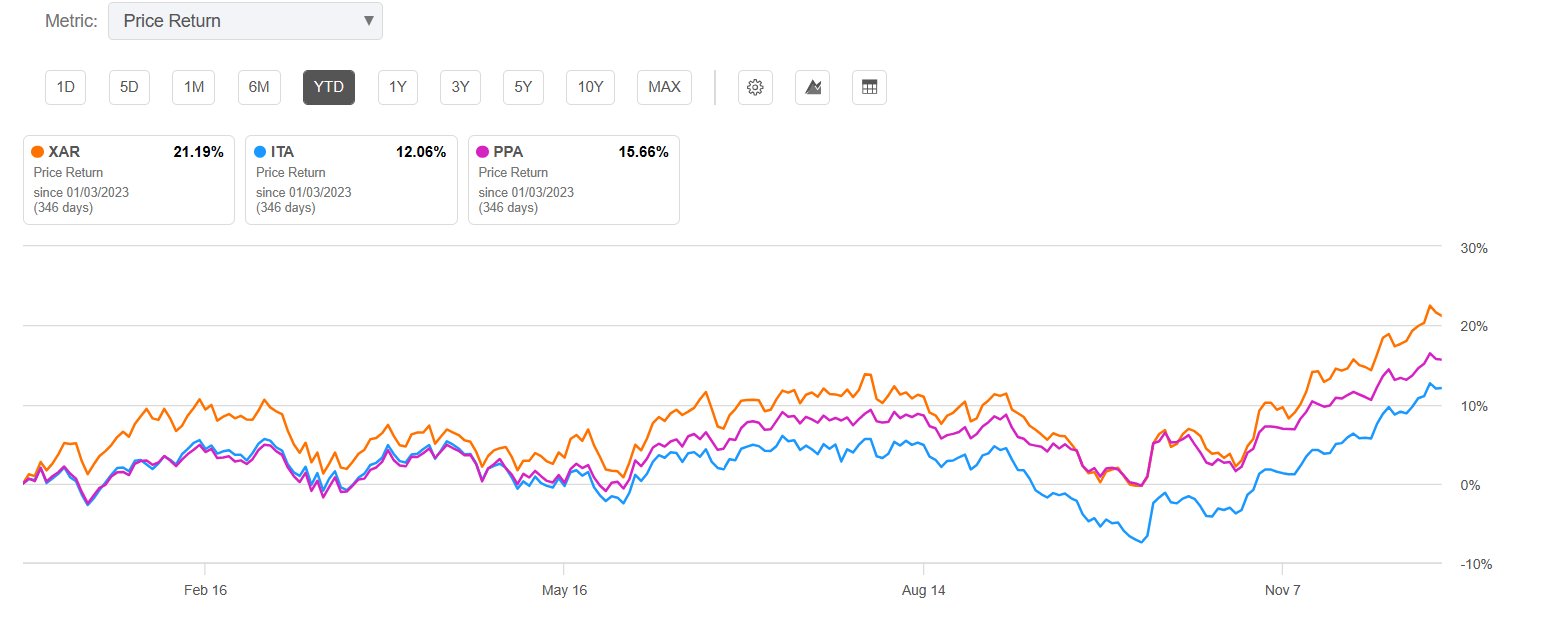
XAR is currently trading at $133.21 at the time of this article. This puts the fund near the upper limit of its 52-week range ($106.68 to $135.77) and below its $136.44 all-time high in July 2021. XAR has seen a 21% price return YTD, notably ahead of its peers, ITA and PPA.
YTD Price Return for XAR, ITA, and PPA (Seeking Alpha)
Despite strong a strong YTD return, XAR still appears to be valued attractively compared to ITA and PPA. With a P/E ratio of 24.36, the fund is notably lower than ITA. Additionally, XAR has a P/B ratio below both compared funds. Finally, XAR has an estimated 3-5 year EPS growth of 6.37%.
Valuation Metrics for XAR and Peer Competitors
| XAR |
| ITA |
| PPA |
| P/E ratio |
| 24.36 |
| 26.98 |
| 23.87 |
| P/B ratio |
| 3.09 |
| 3.11 |
| 3.75 |
Source: Compiled by Author from Multiple Sources, 16 Dec 23
Whether XAR will outperform is dependent on the future performance of its holdings. The fund has multiple potential advantages compared to ITA and PPA, including its different holding weights on SPR, BA, and HII. Based on these holding differences, I expect XAR to blow through its all-time high and exceed returns for ITA and PPA going into 2024.
Investment in XAR or any aerospace and defense ETF is not without risks. The most immediate risk is defense spending cuts. However, this risk appears minimal for the time being given congressional passage of the National Defense Authorization Act which calls for $886 billion for the Defense Department next year. While the legislation still requires presidential approval, all indicators point towards record spending for the Department of Defense. Additionally, given strategic competition with China and numerous international threats, I would be surprised to see any significant decline in U.S. defense spending.
Concluding Summary
XAR warrants a buy due to strong expected defense spending heading into 2024 and beyond. While competitor fund PPA has demonstrated strong performance historically, XAR has a mix of holdings that will posture it for strong growth, potentially surpassing PPA heading into next year. Specifically, XAR has the heaviest weights on Spirit AeroSystems and Huntington Ingalls while holding the lowest weight on Boeing Company. Additionally, XAR has the lowest expense ratio of funds compared. While XAR has the lowest dividend yield compared to ITA and PPA, none of the aerospace and defense funds examined have significant dividend yields. Given the expected funding for the Defense Department heading into 2024, and likely beyond, any investment into aerospace and defense ETFs will provide solid returns. However, I believe that XAR has the right ingredients to propel the fund ahead of its peers.
For further details see:
XAR: A Solid ETF To Capture Record High Defense Spending In 2024