TLT - 2 Charts That Every Investor Needs To See Today
2023-07-31 06:30:00 ET
Summary
- We love the power of charts.
- Here are two charts that are important for investors today.
- We examine U.S. Federal tax receipts and interest payments.
"A picture is worth a thousand words, but a chart is worth a thousand pictures."
This is our motto. As visual learners, we value the power that charts wield for data analysis and interpretation. There is not a single investment decision that we make without the use of charts.
Today, we're sharing two important charts that matter today and provide a little context about why they are so important.
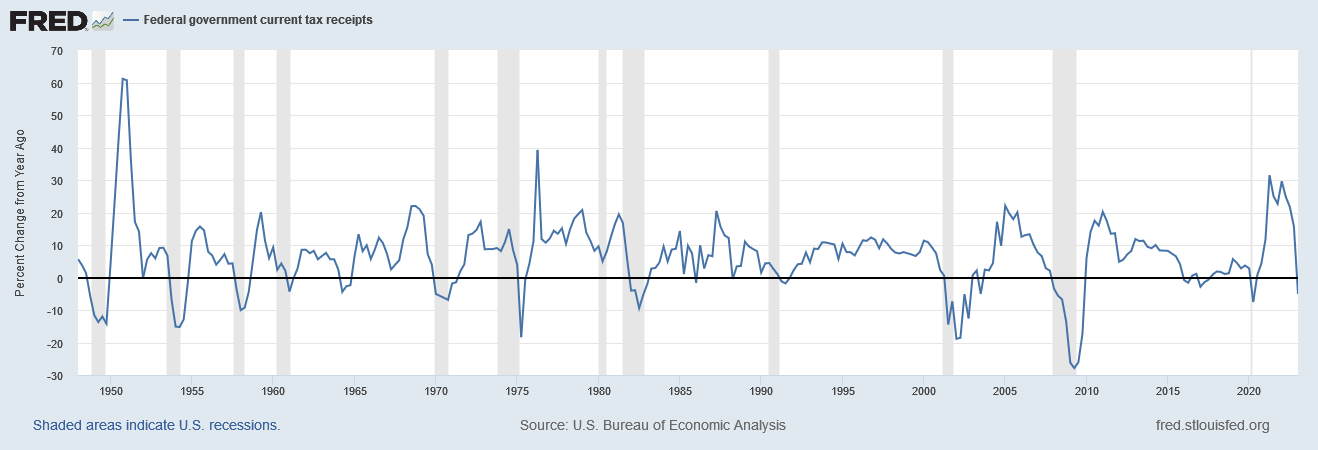
Chart #1
U.S. Federal Government Current Tax Receipts Year-over-year
Federal Reserve Economic Data | FRED | St. Louis Fed
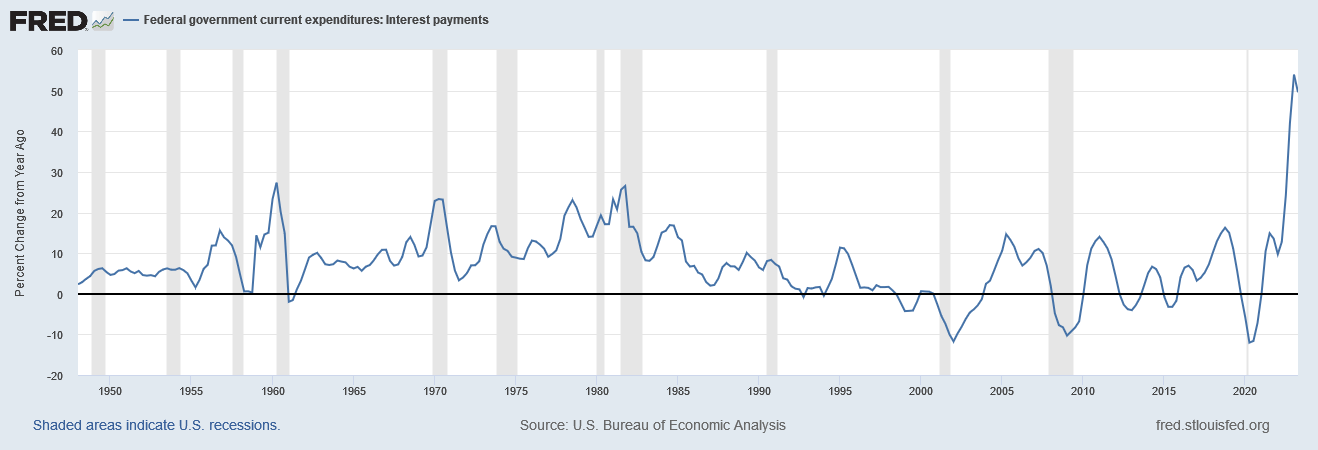
Chart #2
Federal Government Current Expenditures: Interest Payments Year-over-year
Federal Reserve Economic Data | FRED | St. Louis Fed
Commentary
Our first chart demonstrates that U.S. Federal Government current tax receipts have been on the decline over the last year. In Q1 2023, Federal tax receipts were down -5.07%. This is an indication that income in the nation is likely in decline. This is supported by the fact that GDI has declined for the previous two quarters. This is in stark contrast to strong employment data, including an unemployment rate of 3.6%, and continuing positive real GDP numbers which include the most recent 2.4% annualized increase for Q2 2023.
Typically, a yearly decline in U.S. tax receipts since 1950 has been associated with a recession. This is because economic contractions lead to reduced economic activity and thus income. It is possible that this decline is simply due to a reversion to mean following elevated tax revenues following the economic boom produced by stimulus during the pandemic. Certainly, there were abundant taxable capital gains in 2020-21 in the wake of strong equity performance. In 2022, capital gains shrank as equity markets declined. Given the superior performance in 2023, it is reasonable to expect that contributions to tax receipts from capital gains will be on the rise again.
Still, it should be recognized that history suggests a pattern. The business cycle, often exaggerated by fiscal and monetary policy, tends to occur with the same sequence of events. Before an economic contraction, tax receipts rise as the credit cycle peaks and economic growth is most strong. Tax receipts decline as the business cycle enters into the contraction stage. It would be novel for today's circumstance to avoid recession.
Our second chart shows that the Federal interest expense has ballooned greatly over the last year as the Fed has raised interest rates. It should be noted that this surge higher has occurred while the average rate on Federal debt has risen from 1.57% in February 2022 to 2.76% in June 2023. This debt includes 30% that has or will come due in 2023, 12% due in 2024, and 9% in 2025 according to the Federal Reserve Bank of St. Louis . This means that if interest rates were to remain at their current levels, or higher, the average interest rate on Federal debt will climb significantly higher with each quarter and with it the total amount of Federal interest payments.
This increasing expense has restrained the Federal budget deep in deficit territory with a deficit as percent of GDP of -5.4% in 2022, up from -14.8% in the middle of the pandemic in 2020. Net interest paid by the U.S. government has now reached $615 billion TTM. This deficit caused by interest payments results in two important things:
- Holders of U.S. debt, including commercial banks and the private sector, are earning substantial returns on their capital invested. This acts as a type of "stimulus" so-to-speak as it increases household and corporate income statements and spending. However, this income is mostly earned by upper income individuals who have sufficient assets to invest and largely omits benefit for lower income individuals who are already suffering the effects of inflation on their cost of living.
- The deficit is inflationary because it is being covered by increased borrowing.
Both of these factors are prolonging the causes of price inflation in the U.S. and should be expected to do so until interest expenses decline or the deficit is ameliorated without new bond issuance. These charts demonstrate that the potential for serious stagflationary effects to develop is substantial. While tax receipts decline, indicating a slowing economy and worsening the Federal deficit, increased interest rates will continue to stimulate financial markets and deficit spending will contribute to prolonged inflation. It is a challenging economic environment, one which compels us to favor the flexibility and risk adjusted returns of floating rate and short duration fixed income.
For further details see:
2 Charts That Every Investor Needs To See Today