GRWG - 2022 Portfolio Review: +5.3% Total Return
Summary
- In 2022, the blended total return of my two managed accounts was +5.3%.
- In baseball parlance, in 2022, I hit exactly 'zero' extra base hits and had to manufacture runs - meaning hitting a lot of singles, stealing bases, and hitting sacrifice flies.
- 2022 was one of the most difficult years ever if you're a 60% (stocks) / 40% (bonds) investor. Macro headwinds and one of the most aggressive rate hike campaigns dominated.
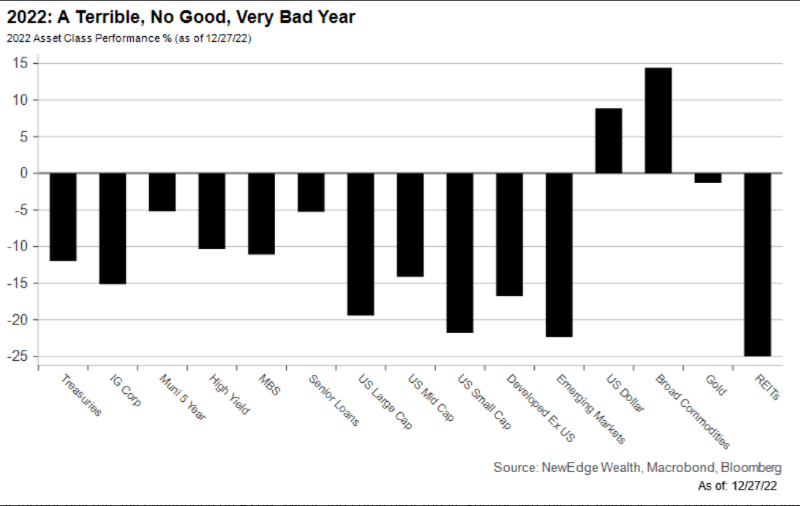
If you are a long only investor, 2022 was an exceptionally difficult year. Here are a few charts reflecting just how challenging it was for both fixed income and equity investors. In 2022, as you can see below, all fixed income strategies lost money, on a total return basis. This is what happens when the yield on the 10YR U.S. Treasury moves from 1.51%, on January 1, 2022, and finishes the year at 3.88%. Although the high water-mark was struck in late October 2022, at 4.33%, this was a dramatic move and was far and away the biggest headwind and negative driver of both bond and equity returns. Speaking of bonds, if you happened to make the mistake of getting and staying long duration, get this, the iShares 20+ Year Treasury Bond ETF ( TLT ) was down a breathtaking 29.4%, in 2022.
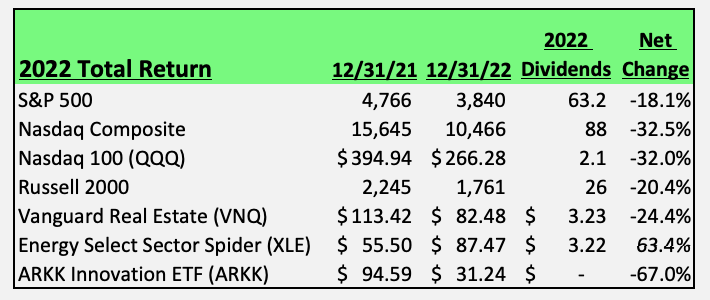
If you are mostly a U.S. centric equity investor, enclosed below is a good snapshot of broad 2022 total performance captured by the indices. As you can see, including dividends, the S&P 500 ( SPY ) was down 18.1%, the Nasdaq ( QQQ ) was down 32.5%, the Russell 2000 ( IWM ) down 20.4%, and the highly popular Vanguard Real Estate Index Fund ( VNQ ) down 24.4%. In 2022, Cathie Wood's ARK Innovation ETF ( ARKK ) lost 67%. Bucking the trend, though, was the Energy Select Sector SPDR ETF ( XLE ), which was up a 63.4%. Energy, and most upstream and downstream equities as well as a few select pockets of commodities were among the few ports in a very stormy 2022.
As a quick aside, I wrote an average of just under one free site article per week. And speaking of commodities, one of my best free site articles, in 2022, was Commodity Supercycles And The Role Of Luck , which was published April 25, 2022. On May 16, 2022, Jeffrey Currie, the long-time commodity analyst, at Goldman Sachs, was on CNBC suggesting $150 oil was a 'high probability event', and the subtext was $175 to $200 was possible. Now you could say extended Covid lockdowns, in China, or a global recession turned out to be big oil demand destruction drivers or perhaps that President Biden's release of the Strategic Petroleum Reserves was a policy error, and this only put off that move to $150, for another day. That said, oil entered 2022, at roughly $75 per barrel ((WTI)). It spiked into the high $120s and briefly traded up around $130 ((USO)), on the front month, around and soon after the Russian invasion of Ukraine. It quickly pulled back from the $120s to back down into the mid $90s. Then, ahead of the 2022 summer driving season, oil attempted to re-test its March 2022 highs, and failed, before hitting a wall of resistance at $118 per barrel. Lo and behold, oil closed 2022, at roughly $80 per oil, or up less than 10%! As I've said on so many occasions, oil is one of the most complex commodities forecast given how fragmented it is from a supply standpoint. Throw in the geopolitics, the ebbs and flows of the ESG movement, and elasticity of demand, and I would argue it is a fool's errand for people to actually think they can accurately predict something that is inherently unpredictable.
2022 Total Return Performance: +5.3%
As for your dear author, 2022 was a grind. It was two steps forward and 1.5 steps back. There were a few impressive bear market rallies, where a lot of money was made, on the tactical/ trading side. However, if you maintained a long only and mostly fully invested stance, it was easy to give back some or all of those lucrative tactical trading gains. I felt like I was on my back foot, almost the entire year.
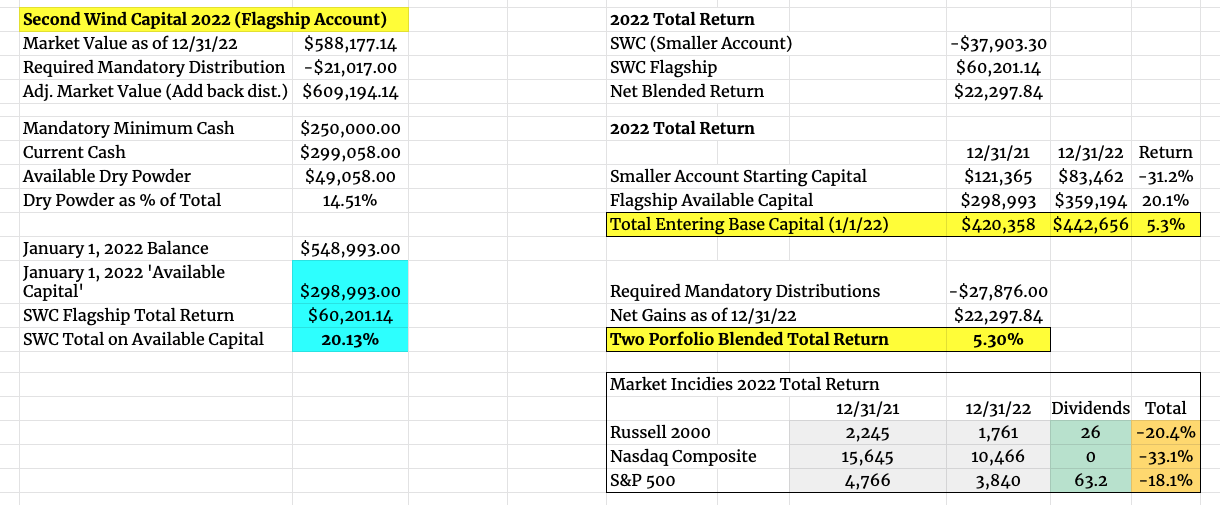
However, despite playing 'B-' baseball, most of the year, I'm actually fairly happy to report a +5.3% blended 2022 total return. The saving grace was hitting a number of singles, which was enough to offset a few big strikeouts.
Enclosed below, please see this snapshot containing the details.
From a stock selection perspective, in case you're wondering, enclosed below is the cumulative realized returns, in the larger Second Wind Capital Flagship account. As this account is very active portfolio, the criteria or threshold for making the list was established at $2,500 (otherwise the list would be too long).
And in case you are wondering, in the context of the available risk capital, a home run would be considered a $50K win, a triple would be at least $35K, and a double would be at least $20K. Anything $2,500 to $10,000 is more of a single. As you can clearly see, I had exactly 'zero' extra base hits, in 2022. Also, for additional context, and as a general rule, my maximum sizing tends to be 15%, for a specific stock. Yet, on balance, most of my top positions are only sized in the 7% to 10% range. Also, I tend to have on many 2% to 5% sized bets. So if you're following the math closely, hitting a home run would require a positioned sized at close to 10% that returns more than 100%, during the holding period. There were a few stocks that I wrote up, in 2022, that more than doubled, at least for a period of time, but it was really hard to get both the sizing and timing quite right.
Hitting A Lot of Singles (SWC Flagship Account)
- Kirkland's, Inc. ( KIRK ): $10,248
- Regis Corp. ( RGS ):$9,798
- Orion Group Holdings ( ORN ): $8,255
- Kohl's Corp. ( KSS ): $5,211
- Summit Midstream Partners, LP ( SMLP ): $5,199
- Shopify Inc. ( SHOP ): $5,008
- Express, Inc. ( EXPR ): $4,747
- Ramaco Resources, Inc. ( METC ): $4,209
- SpartanNash Company ( SPTN ): $3,944
- RCM Technologies, Inc. ( RCMT ): $3,942
- Xcel Brands, Inc. ( XELB ): $3,905
- TravelCenters of America ( TA ): $3,588
- Citi Trends, Inc. ( CTRN ): $3,884
- Peloton Interactive ( PTON ): $3,611
- Red Robin Gourmet Burgers ( RRGB ): $3,495
- Yellow Corp. ( YELL ): $3,488
- Vacasa, Inc. ( VCSA ): $3,452
- Revlon Inc. (REVRQ): $3,402
- Sypris Solutions ( SYPR ): $3,361
- GrowGeneration Corp. ( GRWG ): $3,223
- Westrock Coffee Company ( WEST ): $3,198
- Ollie's Bargain Outlet (OLLI): $3,107
- CVR Partners, LP ( UAN ): $2,950
- Bed Bath & Beyond ( BBBY ): $2,940 (long puts)
- Chicken Soup for the Soul Entertainment ( CSSE ): $2,887
- Nautilus, Inc. ( NLS ): $2,806
- Alto Ingredients, Inc. ( ALTO ): $2,802
- Hibbett, Inc. ( HIBB ): $2,767
- Build-A-Bear Workshop, Inc. ( BBW ): $2,626
- Yellow Corp.: $2,591
- B&G Foods, Inc. ( BGS ): $2,511 (long puts)
- Daktronics, Inc. ( DAKT ): $2,501
Strikeouts (SWC Flagship Account)
- Lottery.com Inc. ( LTRY ): -$36,998
- Microbot Medical Inc. ( MBOT ): -$5,645
- Nikola Corp. ( NKLA ): -$5,135
- Crocs, Inc. ( CROX ): -$5,202
- Array Technologies ( ARRY ): -$4,547
- Meta Platforms ( META ): -$3,820
- WiSA Technologies, Inc. ( WISA ): -$3,220
Across the two accounts, enclosed below is the final P/L snapshot of my 2022 Net Realized Gains/ Losses. Again, this is a good indication that if you have a high batting average, but low slugging percentage, at least in 2022, the singles do add up.
Fidelity Closed Portfolio Positions (2022)
Mistakes
In terms of mistakes, gosh, there are almost too many to mention. Incidentally, on November 19, 2022 ( Value Investing With Courage & Conviction Investing ), there was an article published by the SA Pro team, where I did a written interview with SA's John Leonard. As I spent a lot of time and effort on that piece, I don't want to reinvent the wheel here. That said, no question, entering the year, I underestimated the hawkishness of the Fed and underappreciated how dramatically Chairman Powell would raise the Fed Funds rates. And although I don't really mess around with whiz bang technology stocks, given the valuations, so I was fortunate to have avoided the carnage throughout most of the technology sector, the big move in 10YR U.S. Treasury yields meant borrowing costs for variable debt rose dramatically and there was a lot of multiple compression, across the board. Therefore, as I mentioned earlier in this piece, I was on my back foot, most of the year, and I had to resort to hitting a lot of singles, stealing bases, and hitting sacrifice flies to put runs on the board. My sincere hope is that 2023 is more of a return to normalcy and a year where stock picking once again matters.
43.7% 3 Year Compound Annual Returns (SWC Flagship Account)
Also, in prior years, as I've been fortunate to have posted super strong returns, in both 2020 and 2021. In the comments section, I've frequently been asked for my three year track record. In anticipation of this question, and in case any readers are wondering, enclosed below is the actual performance of the larger SWC Flagship account, from January 1, 2020 - December 31, 2022.
Author's Chart
Putting It All Together
2022 was an exceptionally difficult year for long only investors. Perhaps, similar to the vast majority of SA readers, I don't mess around with leverage, only sparingly use options, don't trade on margin, and I certainly don't trade S&P 500 futures or other highly leveraged instruments that require almost perfect market timing. Alas, I'm just an old school, mostly small cap, value and special situation investor / tactical trader. The goal is to seek out some margin of safety, which takes two forms. Form number one is buying really high quality businesses, at fair valuations. The second is buying mediocre businesses at really attractive valuations. In this highly dynamic market environment, with incredible macro headwinds, a hawkish Fed, and the end of the new investor gold rush (the gold rush was formerly driven by Covid, highly generous government payments during Covid, zero trade commissions, the gamification of Robinhood ( HOOD ), and the rise and fall of crypto) as most of these folks left the market, as 2022 proved exceptionally difficult. My long winded point is that this game is much more of an art than a science. Sometimes you have to simply survive and fight for a draw.
In the short term, I would argue that we're setup for what could be a spectacular January Effect 2023. Incidentally, my former UMass Amherst professor, Ben Branch, was a pioneer on this topic . In 1990, he and a colleague, Kyungchun Chang, wrote an academic paper that shared the requisite empirical data to articulate the January Effect (in low priced stocks).
Given the exceptional number of stocks that were taken to the woodshed, in 2022, with far too many stock experiencing 60% to 90% declines, and with all of the tax losses selling behind us, the current enterprise values of many of these companies is now only a shadow of their former selves. Therefore, I would argue the first two to three weeks of January 2023 could offer a great setup for tactical trading bets and an alpha rich environment.
Outside of the January Effect, I don't have a high enough IQ to pretend I can predict where the S&P 500, Russell 2000, or Nasdaq will end the year. Moreover, I definitely am not smart enough to pretend I can predict the price of oil and/or other commodities. In commodities, it is better to try and work out where you are in the cycle. Again, my sincere hope is that 2023 is a year of stock picking, and less dominated by the macro and Fed fears. And candidly, I'm so sick of being told don't fight the Fed.
In closing, Happy New Year! Wishing everyone a healthy and happy new year ahead. Good luck out there, in 2023!
Appendix
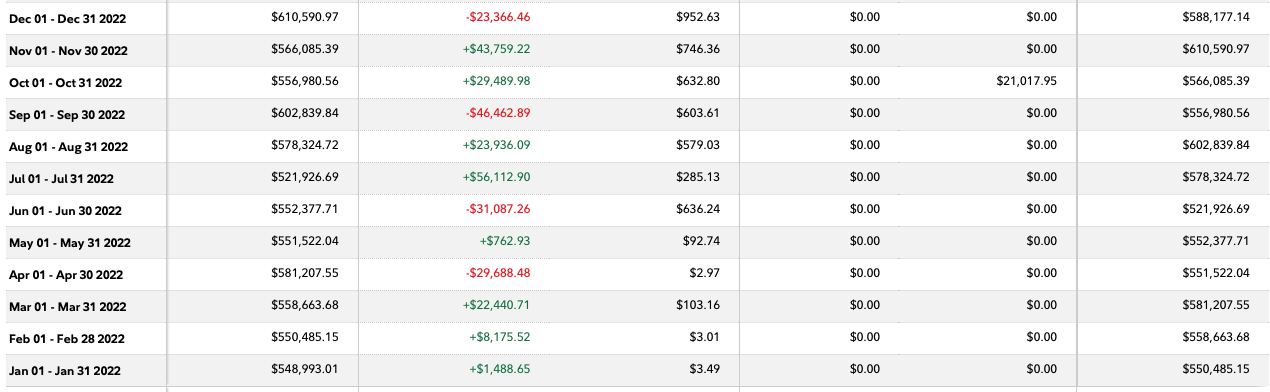
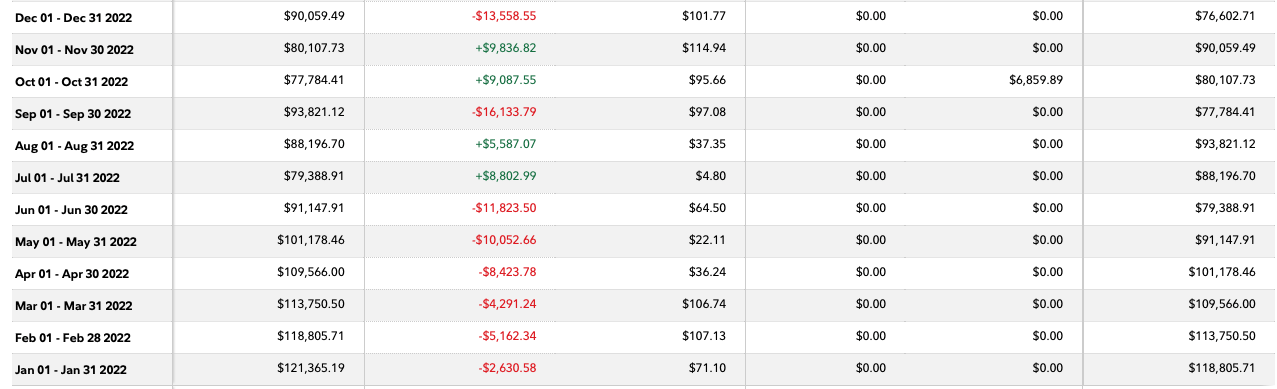
Enclosed below is the Fidelity Performance Snapshot of the two accounts, so readers can verify the authenticity of my returns. Excel spreadsheets are fun, but real performance snapshots are better.
SWC Flagship Account - Fidelity Performance Tab
SWC Small Account - Fidelity Performance Tab
For further details see:
2022 Portfolio Review: +5.3% Total Return