TLT - 3 Strategies To Invest $100000 Today
2023-10-14 09:00:00 ET
Summary
- Markets are at a critical juncture, with uncertainty about the market's future direction.
- Knowing your risk tolerance and investing with a definite strategy is important.
- I present three different investment strategies, including a growth-focused strategy, a sleep-well-at-night strategy, and the Near-Perfect Portfolio (or NPP) strategy.
Markets are at a critical juncture. We had an incredible run during July and August this year. However, markets have been declining since then. Even though the Fed kept the interest rates steady in their September meeting, Fed Chairman Jerome Powell indicated that the Fed was open to increasing rates further and rates would stay higher for longer. Markets are now expecting the rates to stay high at least until mid-2025 or even longer. With rates as high as they are (or even higher in the future), many companies in the S&P 500 (SP500) will not only find it difficult to refinance their debts that are due prior to 2026, but their cost of financing will increase significantly. The risk is being repriced in the wake of higher rates for longer.
The open question remains about how low the market would go from here and if we are heading towards a bear market again. If you have fresh capital to invest, whatever the amount may be, it certainly seems daunting to decide if it is a good time to invest.
However, we believe it is always appropriate to invest with a clear strategy. Staying in cash for an extended period of time does not pay in the long run. Cash loses its value every day of the year due to inflation.
In this article, we will discuss three different strategies for a wide audience with a different set of goals. It is not important how much amount you are investing, whether it is $100,000 or any other amount, big or small. However, we will take $100,000 as an example to demonstrate how our flagship Near-Perfect Portfolio Strategy, or NPP, can help us overcome some of the conundrums that we face in today's market environment. Whether you are a 30-year-old or well into your 70s, you can find one of the strategies presented below that would meet your specific goals and personal situation.
Importance of Knowing Your Risk Tolerance:
Before you invest in a new portfolio (or make new investments), you should make a genuine assessment of your risk tolerance. In other words, how much of a drawdown in your portfolio would be tolerable to you without causing impulsive and emotional reactions or, worse, panic selling?
For the sake of an example, we will consider a hypothetical scenario. Let's assume we have two investors, Steve and Mark, aged 60 and 45 years, respectively. In the year 2020, prior to the pandemic, both were fully invested in the stock market and had reasonable levels of diversification but were limited to stocks with a bit of an overdose of high-growth tech stocks.
At the start of the pandemic and during March and April, the stock market lost nearly 35% from top to bottom, but many individual stocks lost even more, some 50 to 60%. Since Steve was much closer to retirement and was fully invested in stocks, he could no longer tolerate a drawdown of 45% in his portfolios and, in a moment of panic, sold everything to get into cash. The thinking was that he would buy back once the market hit rock bottom. On the other hand, Mark, being much younger, was calm and confident that panic was temporary and, eventually, the markets would come back even. He was also comforted by the fact that he had more than 20 years of working life ahead, and it would be plenty of time to recover and prosper. So, Mark stayed put.
Due to the various actions of the Fed and $2.2 trillion of stimulus money on the way from the government, markets started recovering rather quickly even before the initial wave of the pandemic was over. Many people believed at the time that the recovery was temporary and was going to be short-lived. Like so many others, Steve thought it was best to stay in cash, which, with hindsight, we can say proved to be a major mistake. The moral of the story is that it is very difficult to be right, not one time, but twice.
So, it is important to accurately know your risk tolerance and invest accordingly. Though we admit it, it is easier said than done, as most people can only judge it during a severe correction or recession.
So, if your risk tolerance is low or you are simply a conservative investor, what options do you have? Keeping a large portion of your portfolio in cash is not a very attractive proposition, as cash cannot even earn enough to counter the rate of inflation. But there are strategies that could protect you from the extreme downside during periods of panic or corrections and help you stay calm and invested. One such strategy is our NPP strategy, discussed later.
To address a wider audience, we will present three very different strategies, including the NPP strategy:
Strategy 1: Sleep Well At Night Strategy
Strategy 2: Growth-Oriented Strategy
Strategy 3: The NPP (Near-Perfect Portfolio) Strategy.
Strategy 1: Sleep Well At Night [SWAN] Strategy
Here, we want to cover a strategy where you invest and forget it for the most part. One key element in this portfolio is simplicity and diversification. Essentially, you would invest once (at one time or over a period of time in multiple lots using dollar-cost-averaging), but then you could just leave it alone for the most part. You could rebalance it on a yearly basis if the allocation has become lopsided. It will also be a good idea to analyze your portfolio on a yearly basis and see if anything has changed that no longer meets your goals.
Here, we outline a simple portfolio consisting of only five components, each with an equal allocation of 20%. This portfolio may not beat the S&P500 at all times but will grow consistently with lower drawdowns and half the stress. Further, it is highly diversified, with 80% stocks and 20% bonds allocation, and requires no active management. However, please keep in mind that this portfolio has no downward protection, so in a crisis like 2008-2009, such a portfolio will go down along with the market, but maybe to a lesser extent. Also, it will be among the first to come out of it.
Three of the five components are highly popular dividend ETFs (exchange-traded funds). These ETFs will have some overlap but are still at an acceptable level. One of the ETFs is growth-oriented and should provide some decent appreciation in good times. These ETFs are low-cost and have very favorable performance records and decent yields of around 3%. We also include one large-cap company, which is largely a proxy for the US economy but pays no dividends. That company is Berkshire Hathaway (BRK.A, BRK.B). The long-term record of BRK is outstanding, and it seems we can't go wrong with it. That said, there is some element of uncertainty about how the company would fare post its founder and legendary investor, Warren Buffett.
The fifth component falls under the high-yield Bond category and is a Fidelity mutual fund, Fidelity® Capital & Income Fund No Load (FAGIX). It has a decent record. For income seekers, it does provide yields of roughly 5%.
The average yield of this portfolio is roughly 3%, and the average fee is 0.18%.
Table 1: SWAN (Sleep Well At Night) Portfolio:
| Ticker |
| Allocation |
| Name of the Security |
| Yield % |
| Type of Security |
| Fees |
| SCHD |
| 20% |
| Schwab U.S. Dividend Equity ETF |
| 3.76% |
| Stocks ETF |
| 0.06% |
| VYM |
| 20% |
| Vanguard High Dividend Fund ETF Shares |
| 3.31% |
| Stocks ETF |
| 0.06% |
| VIG |
| 20% |
| Vanguard Dividend Appreciation Fund ETF |
| 2.04% |
| Stocks ETF |
| 0.06% |
| BRK.B |
| 20% |
| Berkshire Hathaway Inc. |
| 0% |
| Individual Stock (Conglomerate) |
| n/a |
| FAGIX |
| 20% |
| Fidelity Capital & Income Fund |
| 5.47% |
| Bond Mutual fund |
| 0.72% |
| AVERAGE |
| 2.92% |
| 0.18% |
Strategy 2: Growth-Oriented Strategy
This strategy is mostly for younger folks. If you are in your 30s or even early 40s, you need to realize that the money invested now will go a long way, and if invested appropriately, compounding would do wonders for this capital. Time is your friend at this stage, and you should use it to your advantage. A growth-oriented strategy is appropriate at this stage because you do not need income from your capital. What you need is high growth but without taking excessive risk. High-growth stocks should not be translated into speculative stocks. Depending upon the stage in life, you could allocate a portion of your capital to a high-growth bucket.
It is good to be aware that a high-growth strategy usually has higher volatility, and by no means will the ride be smooth. But it is best to ignore the volatility if you are relatively young and retirement is still 20 or 30 years away.
Folks who are already in their 40s should have a second bucket of dividend-paying blue-chip stocks. Please see our sample DGI portfolio included in the NPP strategy later in this article.
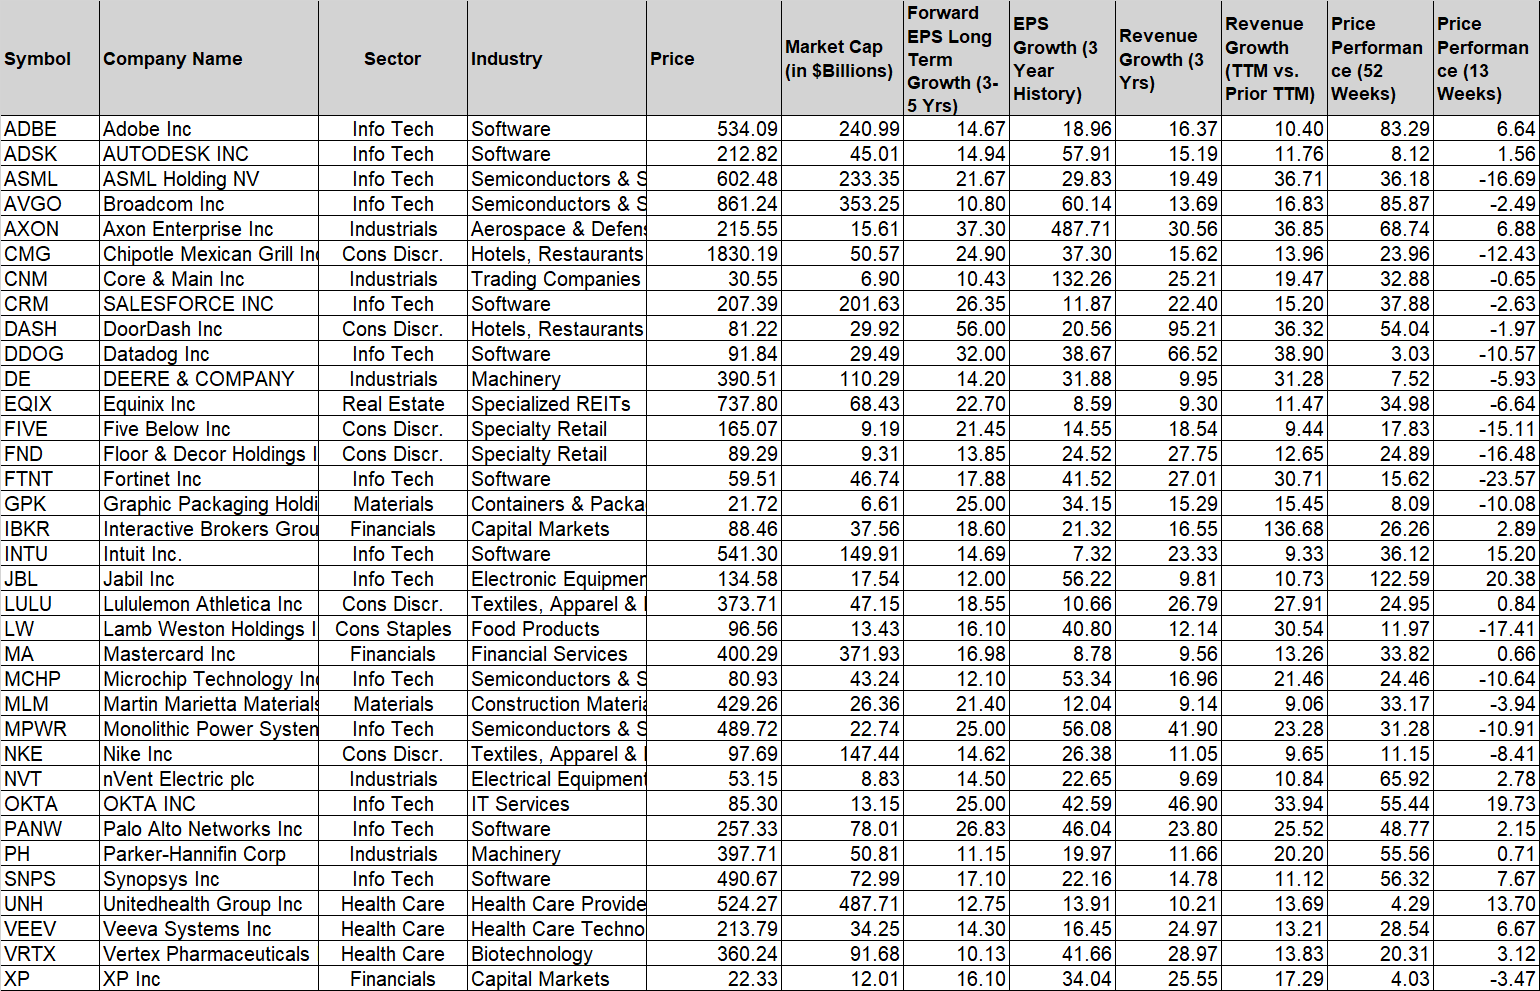
We will present one method/strategy here as to how to go about selecting stocks for the growth-oriented portfolio. We will use a filtering/screening process and select the top 10 stocks. This process can be used periodically (maybe every six months or a year). We will see that a lot of stocks that will overcrowd this list will come from sectors like Software, IT, and Semiconductors. However, we should be careful to select stocks from many sectors or industry segments of the economy. Also, we should select at least 75% to 80% of the stocks that are of large or mid-cap companies, as small and micro-cap stocks tend to have much higher risk profiles. Also, please note that such a high-growth stock may not be a high-growth stock after 3 years, so the selection of stocks needs to be updated at least once a year.
Screening process:
We will select 15 companies that meet several high-growth criteria.
- Market capitalization> $5 Billion
- Forward EPS (3-5 years) Growth Estimates > 10%
- EPS Growth (3-year history) > 7%
- Revenue Growth (last three years) > 9%
- Revenue growth in the current year vs. the previous year > 9%.
- Price-performance (52 weeks).
- Price performance (13 weeks).
We will use the price performance just for visual comparison (no minimum is set).
If we apply the above criteria today, we will shortlist 35 companies. We will need to do additional research and due diligence to select 15 names. These 35 stocks are presented below alphabetically.
Table for Large and Mid caps: (Data as of 10/10/2023)
Table 2:
Strategy 3: The NPP (Near-Perfect Portfolio) Strategy
We include our NPP strategy here as a replacement for the SWAN strategy discussed before. As stated earlier, one drawback of the SWAN strategy is that it provides no protection from the portfolio drawdown in case of a big correction or recession. One of the main features of the NPP strategy is that it aims to provide lower volatility and limited drawdowns but still provides excellent long-term growth and decent income. The downside of the NPP strategy (compared to the SWAN portfolio above) is that it needs active management on the part of the portfolio, at least on a monthly basis. In the long run, we believe the NPP strategy will not disappoint in meeting its stated goals. Sure, it needs discipline and commitment.
Note: The NPP strategy is also part of our Marketplace service, "High-Income DIY Portfolios."
So, What is the Near-Perfect Portfolio Strategy?
If you have not read any of our previous articles on Near-Perfect Portfolio strategy (or NPP in short), the natural question would be: what is the NPP strategy? The NPP strategy basically invests in three or four distinct buckets that invest in divergent strategies.
There are three main goals or objectives of our Near-Perfect Portfolio:
• Preserve capital and limit drawdowns during recessions or big corrections.
• Provide sustainable income of roughly 5% to those who need to withdraw income.
• Grow capital at a total annualized rate of 10% or better (including the dividends).
NPP: A Combination of The Divergent Strategies:
This strategy differs from the earlier strategies in a few significant ways.
-
- This strategy is made up of three baskets (or sub-portfolios)
- This has a built-in mechanism to provide a hedge against severe corrections and limit the drawdowns.
- It is more of an active strategy in the sense that one of its buckets needs monthly maintenance.
- This strategy is highly diversified in terms of not only the number of stocks but also the asset classes.
- It also aims to provide a 5% income and market-beating total returns over a long-term basis.
Here are three sub-strategies (buckets) that form the NPP.
- DGI (Dividend Growth Investing) bucket is the most important bucket that plays the foundational role. The goal is to provide sustainable income with low volatility and decent growth.
- Another main bucket employs the Risk-adjusted Rotation strategy. This strategy uses an in-built hedging mechanism that provides lower drawdowns without compromising long-term growth.
- A small sub-portfolio invested in high-income securities to help boost the overall yield of the total portfolio. It also helps to add some new asset classes in the mix, which otherwise would not be available.
Three Buckets of NPP
Bucket 1: DGI Bucket (Allocation – 35% to 45% of the assets)
Bucket 2: CEF High-Income Bucket (Allocation - 15% to 25% of the assets).
Bucket 3: Rotational Bucket (Allocation - 35% to 45% of the asset).
Bucket-1: DGI-Core
The goals of the DGI Bucket are:
• Dividend income in the range of 3%
• Total returns in line with the broader market in the long term
• Volatility and Drawdowns to be about two-thirds of the broader market.
DGI portfolio:
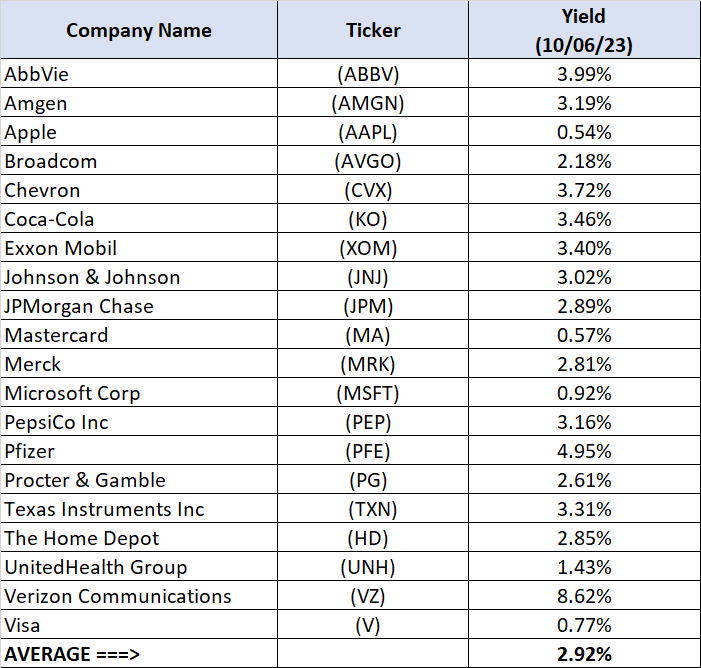
We will construct a portfolio of 20 stocks that are large-cap, blue-chip dividend-paying companies and have raised their dividend payouts for at least ten years (preferably more). We should pay attention to diversifying our holdings spread among many sectors and industry segments.
Obviously, there are many ways to select stocks to construct this portfolio. One simple method is to select the top 10 stocks from the three or four most popular dividend ETFs out there. Once we have this group, we need to eliminate duplicates. We will take the top 10 stocks from the following 3 ETFs:
After removing the duplicates, we are left with 20 names, which are presented below:
List of 20 Stocks:
AbbVie ( ABBV ), Amgen ( AMGN ), Apple (AAPL), Broadcom (AVGO), Chevron ( CVX ), Coca-Cola (KO), Exxon Mobil ( XOM ), Johnson & Johnson ( JNJ ), JPMorgan Chase ( JPM ), Mastercard ( MA ), Merck ( MRK ), Microsoft Corp ( MSFT ), PepsiCo, Inc. ( PEP ), Pfizer ( PFE ), Procter & Gamble ( PG ), Texas Instruments (TXN), The Home Depot ( HD ), UnitedHealth Group ( UNH ), Verizon Communications ( VZ ), Visa ( V ).
Table-3:
As you notice, the dividend yield is a bit low from the above portfolio. If you need a higher level of income from your DGI portfolio, we may suggest adding a few higher-paying dividend stocks.
Bucket-2: CEF High Income Bucket
Allocation to this bucket is relatively small (roughly 20-25%) compared to the other two buckets. The only purpose of this bucket is to provide high levels of income. This will help in elevating the overall yield of the broader portfolio. The side benefit of this portfolio is that it adds certain new asset classes that may not be present in our DGI bucket.
Goals:
-
- 8% or higher income.
- 10% total return on a long-term basis.
This bucket will invest in the following types of securities:
- CEFs (Closed-end funds),
- REITs (Real Estate Investment Trusts),
- mREITs (Mortgage REITs),
- BDCs (Business Development Companies), and
- MLPs (Master Limited Partnerships).
Please note that many of these instruments involve leverage, and leverage can lead to higher risk and volatility. That’s the reason we limit our exposure to a maximum of 25%.
Our sample portfolio will include 11 high-income securities, mostly CEFs.
The funds/securities are: ( CHY ), ( UTF ), (UTG), ( PDI ), ( BBN ), ( FFC ), ( BST ), ( THW ), ( EPD ), ( USA ), ( RQI ).
Table-4:
Author
Author
Note: EPD is a mid-stream partnership that provides a K-1 tax form instead of a 1099-DIV (for corporations).
Bucket-3: Rotational Bucket
The main purpose of this bucket is two-fold. First, to provide a hedging mechanism against deep corrections, and the second is to provide comparable growth to the broader market. Most hedging mechanisms are expensive and have an ongoing cost that must come out of your portfolio growth; however, not with the Rotational portfolio.
The goals of this bucket are:
- Limited drawdowns and preserving capital
- Decent to high growth.
Note: It is important to know that the rotational strategies work best inside a tax-deferred account due to frequent trading.
Note: An important word of caution for new investors. We recommend that any new strategy (including Rotational ones) should be adopted gradually over time in smaller steps as one gains confidence in the strategy. Also, depending on the amount of capital, one could deploy more than one such strategy to further diversify.
Rotation Strategy:
In a Rotational strategy, we would normally have multiple divergent securities in our pool, but we only invest in one or two of them for a fixed period (usually a month) based on certain criteria. So, the rotation is on a monthly basis. Our pool of securities would consist of securities with distinct attributes and will usually (though not always) behave differently in different economic situations. The securities for monthly investment are selected based on a pre-determined method, usually by comparing the total performance of each of the securities during the previous period of defined length.
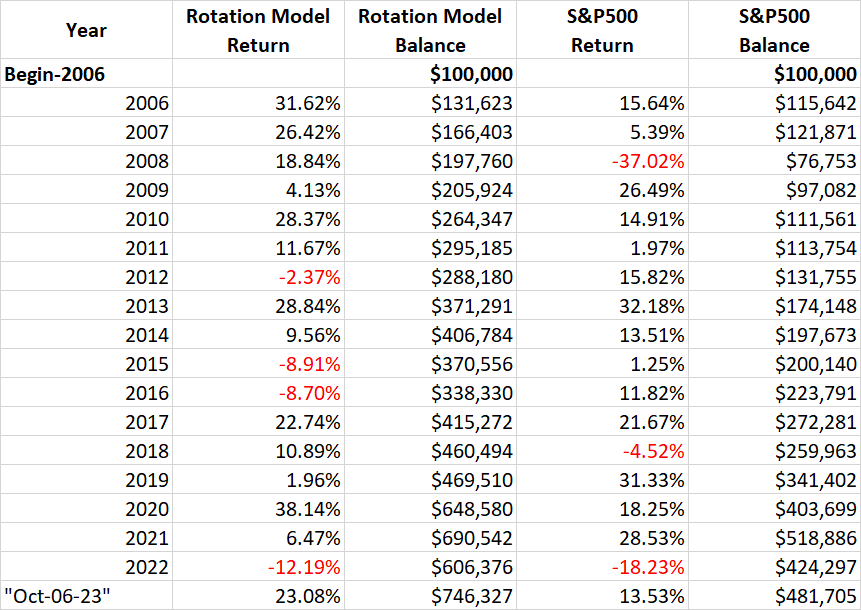
Rotational Model: Divergent-Asset-Model
This model has only three securities representing three different asset classes. We will select just one security out of three for investment every month. The security is selected based on the performance (total return basis) during the previous three-month period. These three securities are:
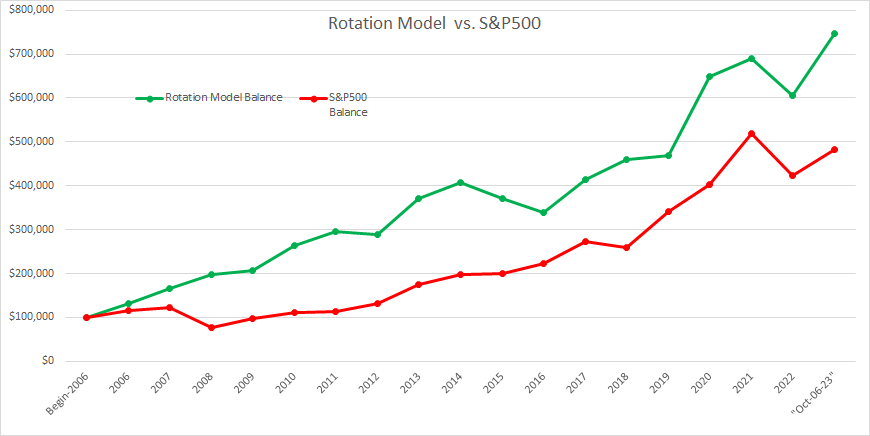
The back-tested performance and comparison with the S&P500 (from Jan 2006 to Oct-06-2023) are presented below.
Table 5A:
| (from Jan.2006 to Oct-06 2023) |
| Rotation Model |
| S&P500 |
| CAGR |
| 11.93% |
| 9.22% |
| Max Drawdown |
| -25.44% |
| -50.97% |
| Worst Year |
| -12.19% |
| -37.02% |
| Stock Market Correlation |
| 0.30 |
| 1.00 |
Table-5B:
Chart-1:
As presented above, this model has a pretty low correlation with the market only to the extent of 0.30 (S&P500 being 1.0). This often results in the model performance diverging from that of the S&P500. Many times, it outperforms the S&P500, but other times, it underperforms, many times by a wide margin. But, as the results suggest, the long-term performance of the model beats the S&P500, both in terms of higher returns and lower drawdowns. However, as you may have noticed, the model underperformed the S&P500 by a good margin in 2015 and 2016. So, the investors are likely to succeed only if they have a strong conviction and stay the course in good years as well as bad.
Combined NPP Strategy Performance During the Last 15 Years:
To provide some perspective, we will now compare the performance of the NPP Strategy with the S&P 500 ((SP500)). We will also compare drawdowns of the recent (and not-so-recent) corrections and recessions. In the table below, we have listed the drawdowns of various buckets of the NPP strategy and the S&P 500 (based on back-tested data).
List of drawdown timeframes:
- Jan-2008 to Mar-2009 (Financial and Housing crash)
- Feb-2015 to Oct-2016
- Oct-2018 to Dec-2018 (Crash of 2018)
- Jan-2020 to Mar-2020 (Pandemic crash)
- Jan. 2022 to Sep 2022 (Most recent correction).
Table-6:
| Drawdown Period |
| DGI |
| CEF |
| Rotation |
| Combined NPP (Max Drawdown)** |
| S&P500 (Max Drawdown) |
| Improvement over S&P500 |
| Jan 2008-Mar 2009 |
| -25.99% |
| -47.84% |
| -6.04% |
| -20.29% |
| -48.47% |
| 58.14% |
| Feb 2015-Oct 2016 |
| 11.94% |
| 0.0080% |
| -17.45% |
| -3.08% |
| 10.40% |
| -70.43% |
| Oct 2018-Dec 2018 |
| -6.66% |
| -13.82% |
| -7.16% |
| -7.96% |
| -13.55% |
| 41.26% |
| Jan 2020-Mar 2020 |
| -10.74% |
| -24.52% |
| 0.18% |
| -7.89% |
| -19.63% |
| 59.79% |
| Jan 2022-Sep 2022 |
| -13.99% |
| -21.96% |
| -14.11% |
| -15.24% |
| -23.95% |
| 36.37% |
** The combined NPP performance is calculated assuming a 40% allocation to DGI, 45% to Rotation, and 15% to a CEF portfolio.
The Combined NPP Strategy Performance:
Below, we will provide the annualized growth rates ("CAGR") of various baskets of the NPP strategy. Please note these are the results based on back-tested data.
Table-6B:
| From Jan 2008 to 06-OCT-2023 |
| CAGR** |
| CAGR of DGI Bucket |
| 14.48% |
| CAGR of CEF-High-Income Bucket |
| 9.23% |
| CAGR of Rotation Bucket |
| 10.0% |
| CAGR of Combined NPP Strategy |
| 12.03% |
| CAGR of the S&P500 |
| 9.11% |
** CAGR - Compound Annual Growth Rate.
Concluding Thoughts
Even though the market, as represented by the S&P500, is up significantly in 2023, the year has been full of challenges. We have the highest interest rates in more than a decade amid an inflationary environment. For the first time, the interest burden on the U.S. sovereign debt will be more than the entire defense spending. Most experts still expect a recession in 2024; however, the opinions differ about its severity. We have a war raging in Eastern Europe that is entering its 20 th month and has cost the U.S. and Europe hundreds of billions of dollars. Now, a second war has just started in the Middle East that is certain to keep energy prices higher. In short, markets are at a critical juncture. Will the recent bull market sustain or fizzle out? That is a million-dollar question, but no one can predict the future.
That's why we advocate to have an investment approach that can handle all types of situations with relative calmness. In this article, we have presented several strategies to serve the needs of a wider audience. We have also included our NPP strategy as well, which is a conservative and diversified investment approach with three baskets, with a goal to provide lower volatility, lower drawdowns, and decent growth.
For further details see:
3 Strategies To Invest $100,000 Today