TXT - A Deep Dive Into Textron Stock: A Cautious 'Buy'
2023-10-10 18:28:58 ET
Summary
- Textron Inc. showed promising financial growth in Q2 2023, with significant revenue upticks in its Aviation and Industrial segments.
- The company increased its EPS guidance for 2023 and has a substantial backlog for future business.
- The company has high earnings quality, with free cash flow exceeding net income.
Investment Thesis
Textron Inc. (TXT), a conglomerate with interests in various sectors such as aviation, industrial, and defense, shows promising financial growth in Q2 2023. Most notably, the company’s Aviation and Industrial segments are flourishing, registering significant revenue upticks. Also, as of July 1, 2023, the company is sitting on a hefty backlog of about $14.293 billion, which is good news for future earnings. In addition, the company has recently signed promising deals, including one with NetJets for up to 1,500 Cessna Citation business jets over 15 years and a separate $241.37 million contract through Textron Systems with the US Navy.
The company increased its EPS guidance for 2023 from $5.20 to $5.30, up from $5.00 to $5.20.
However, investors should be wary of potential red flags, including the decline in free cash flow and minor setbacks in the Bell segment. Despite these concerns, the company's growth prospects make it a cautious "Buy." Given the high backlog, the substantial revenue growth, and the new contracts, the rewards here seem to outweigh the risks.
Overview
Textron Inc., a global player in aircraft, defense, industrial, and finance sectors, saw its revenues climb by $270 million or 9% in Q2 2023 compared to Q2 2022. This increase was driven by several factors, including a $155 million bump in Industrial revenues, largely thanks to a higher volume and mix contributing $121 million and a favorable pricing impact of $37 million. Textron Aviation revenues also rose by $78 million, with higher pricing of $95 million partially offset by a decrease in volume and mix amounting to $17 million. Revenues from the Bell and Textron Systems segments increased by $14 million and $13 million, respectively, mostly due to higher pricing and volume.
The first half of 2023 saw a $293 million, or 5%, revenue increase when compared to the first half of 2022. Industrial revenues alone went up by $249 million, boosted by higher volume and mix of $209 million and a $61 million favorable impact from pricing, which was slightly offset by a $21 million hit due to foreign exchange rate fluctuations. Textron Aviation and Textron Systems also showed growth, with $187 million and $46 million increases in revenues, respectively. However, Bell experienced a $199 million drop in revenue due to lower military spares and support and H-1 production volume.
Textron Systems and the Industrial segment also saw rises in revenue, with the Industrial segment boosted largely by favorable pricing and higher volume and mix. The new Textron eAviation segment also saw a modest increase in revenue, adding $6 million and $10 million in the second quarter and first half of 2023, mainly because of higher volume and mix.
As of July 1, 2023, the total backlog for the company stood at $14.293 billion, up from $13.266 billion at the end of 2022. This includes Textron Aviation's backlog, which increased by $451 million or 7%, and Bell’s backlog that went up by $786 million or 16%.
On September 20 2023, Textron Aviation and NetJets have announced that they've inked a fleet agreement , giving NetJets the option to purchase up to 1,500 additional Cessna Citation business jets over the next 15 years.
Earlier in August 2023, Textron Systems was awarded a roughly $241.37 million cost-reimbursable, not-to-exceed contract action contract. This contract is for the procurement of LCAC 100 Class material and non-recurring activities for five future Ship to Shore Connector Landing Craft Air Cushion 100 Class crafts, with the work slated to be completed by October 2025.
Approximately 22% of the company's 2022 revenues came from U.S. Government contracts, which could be precarious if governmental budgets shift. Looking at the results, the positive points are that revenues are increasing, but there are also some red flags, like the drop in Bell’s revenues and foreign exchange risks.
Segment Analysis
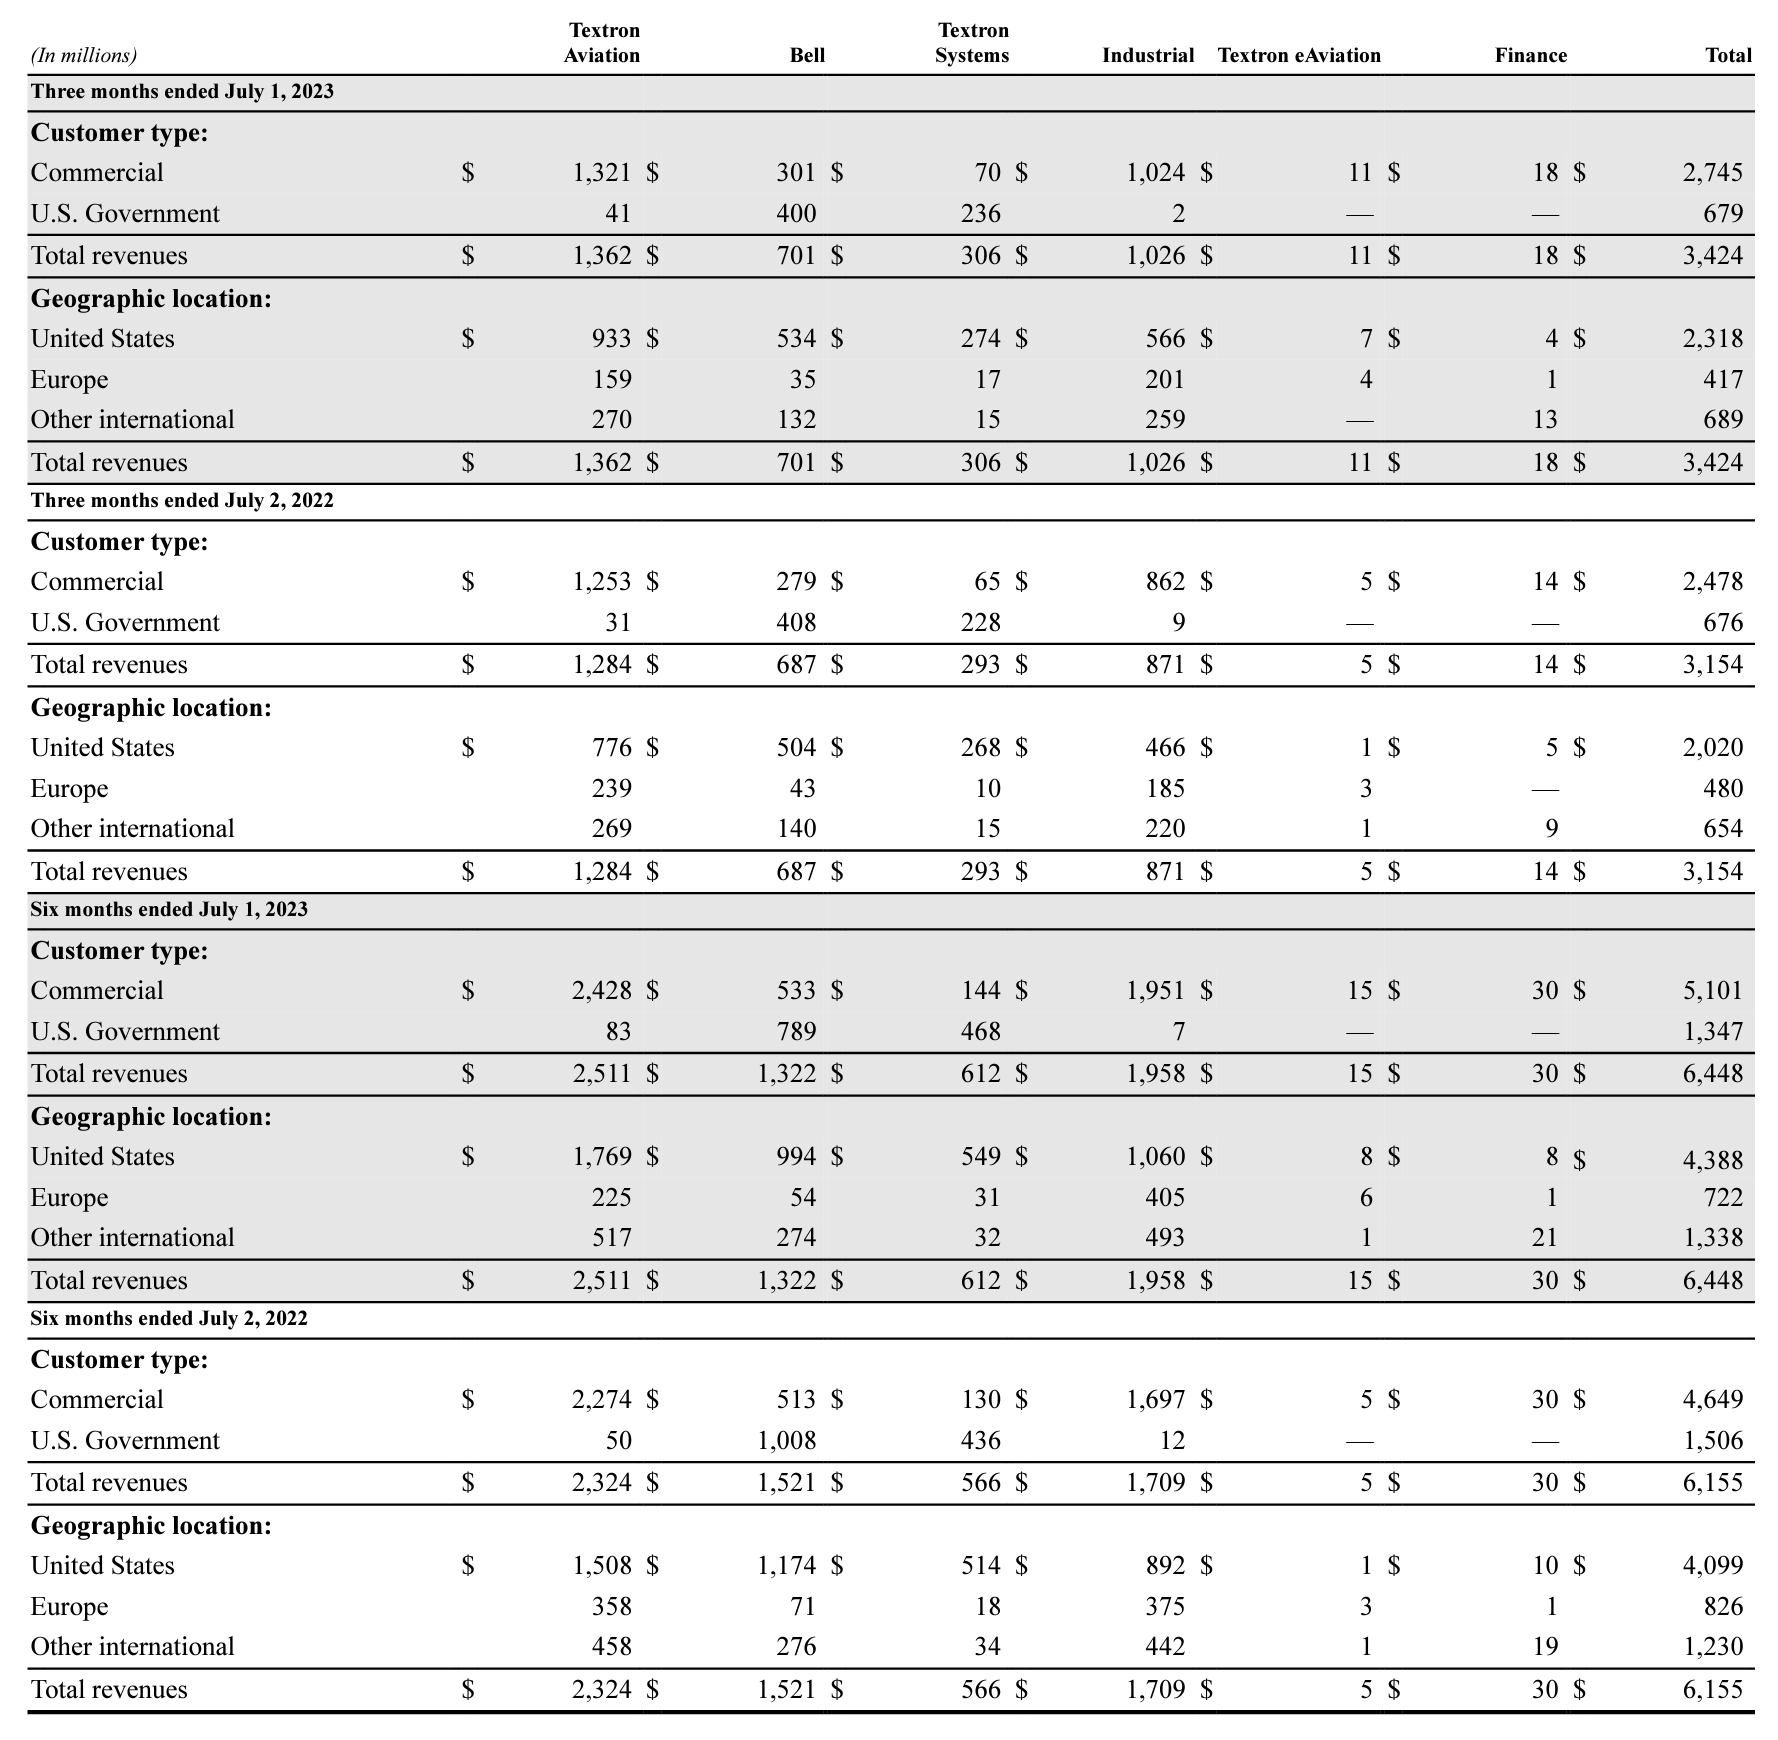
Looking at Textron's latest financials, I see some interesting trends. For the three months ending in July 2023, the company generated a total revenue of $3,424 million, marking an 8.56% uptick from the $3,154 million it made during the same period in 2022. Among its various segments, Textron Aviation and Industrial sectors stand out, with revenues of $1,362 million and $1,026 million, respectively. The Industrial sector actually saw the most growth year-over-year, shooting up by 17.8% from $871 million in 2022.
One area of concern, however, is Bell’s slight dip in U.S. Government revenue, falling 1.96% from $408 million to $400 million in a year. This 1.96% decrease might be a red flag, considering government contracts usually provide steady revenue.
Among its business segments, Aviation is the highest revenue generator, followed closely by Industrial, which also shows promising growth prospects. Lastly, the company has its strongest market in the United States, generating $2,318 million, but it's also making progress in Europe and other international regions.
Projecting into the future, if Textron keeps up this 8.56% growth rate, we can expect the revenue for the same quarter next year to be roughly $3,716 million. The Industrial sector, assuming it maintains its 17.8% growth rate, could potentially grow its sales to $1,208 million.
The primary drivers of value for Textron appear to be the Aviation and Industrial segments. Specifically, the Industrial segment's YoY growth of 17.8% shows strong potential and makes it the key financial metric to keep an eye on.
Revenue Analysis
The company's total revenue has grown from $3,154 million to $3,424 million, an 8.56% increase compared to last year's quarter.
Manufacturing product revenues have shown an encouraging growth of about 8.5%, going from $2,689 million to $2,917 million. Although manufacturing service revenues grew from $451 million to $489 million in the three-month period, they actually dipped when you take a six-month view, which is something to keep an eye on.
The income from continuing operations also increased from $218 million to $263 million, marking a 20.64% increase. Interestingly, the net profit margin improved to 7.6% this quarter from last year's 6.8%, which is positive. There is a drastic drop in interest expenses from $31 million to $19 million; it could mean better debt management or restructuring.
Looking ahead, if we stick to a conservative revenue growth rate of about 8% to 8.5% for next year, we could expect revenues around $3,698 million to $3,716 million for the same time frame.
The manufacturing product revenues of $2,917 million and manufacturing service revenues of $489 million are the main forces driving the company's value. Given the significant role of manufacturing product revenues in the overall financial picture, that's the key metric to watch going forward.
External risk factors also show significant foreign currency translation adjustments, swinging from -$90 million last year to $4 million this year. The improvements in revenue and income, as well as a basic earnings per share bump from $1.01 to $1.31, make this a cautious "Buy" for investors.
The earnings seem pretty solid, too; there's no evidence of unreliable income or one-time gains distorting the financials. If this trend continues, and the company continues to show around an 8.5% growth in manufacturing product revenues, I could see its total revenues exceeding $5 billion in the next five years.
So, to sum it up, this company is showing healthy growth in its main avenues of income and is managing its costs effectively. No major red flags in sight here.
Balance Sheet Analysis
Taking a good look at the company's Balance Sheet dated July 1, 2023, I find that it holds total assets worth $16,485 million, up slightly from $16,293 million at the end of last year. Although its cash and equivalents have dipped from $1,963 million to $1,695 million, accounts receivable and inventories have seen increases, going from $855 million to $953 million and $3,550 million to $4,108 million, respectively.
On the flip side, total liabilities have increased by 3% to $9,451 million from $9,180 million. The current portion of long-term debt has seen a significant leap from $7 million to $357 million as the company seeks to reduce its long-term debt. As a positive, the long-term debt has reduced from $3,175 million to $2,825 million. Shareholders' equity is holding steady, even though it's decreased slightly from $7,113 million to $7,034 million.
What is important is the treasury stock, growing from $84 million to $740 million, suggesting that the company is perhaps buying back shares. When it comes to the quality of the earnings, there don't appear to be any immediate red flags. The earnings seem stable and are mainly driven by core business activities.
Free Cash Flow Analysis
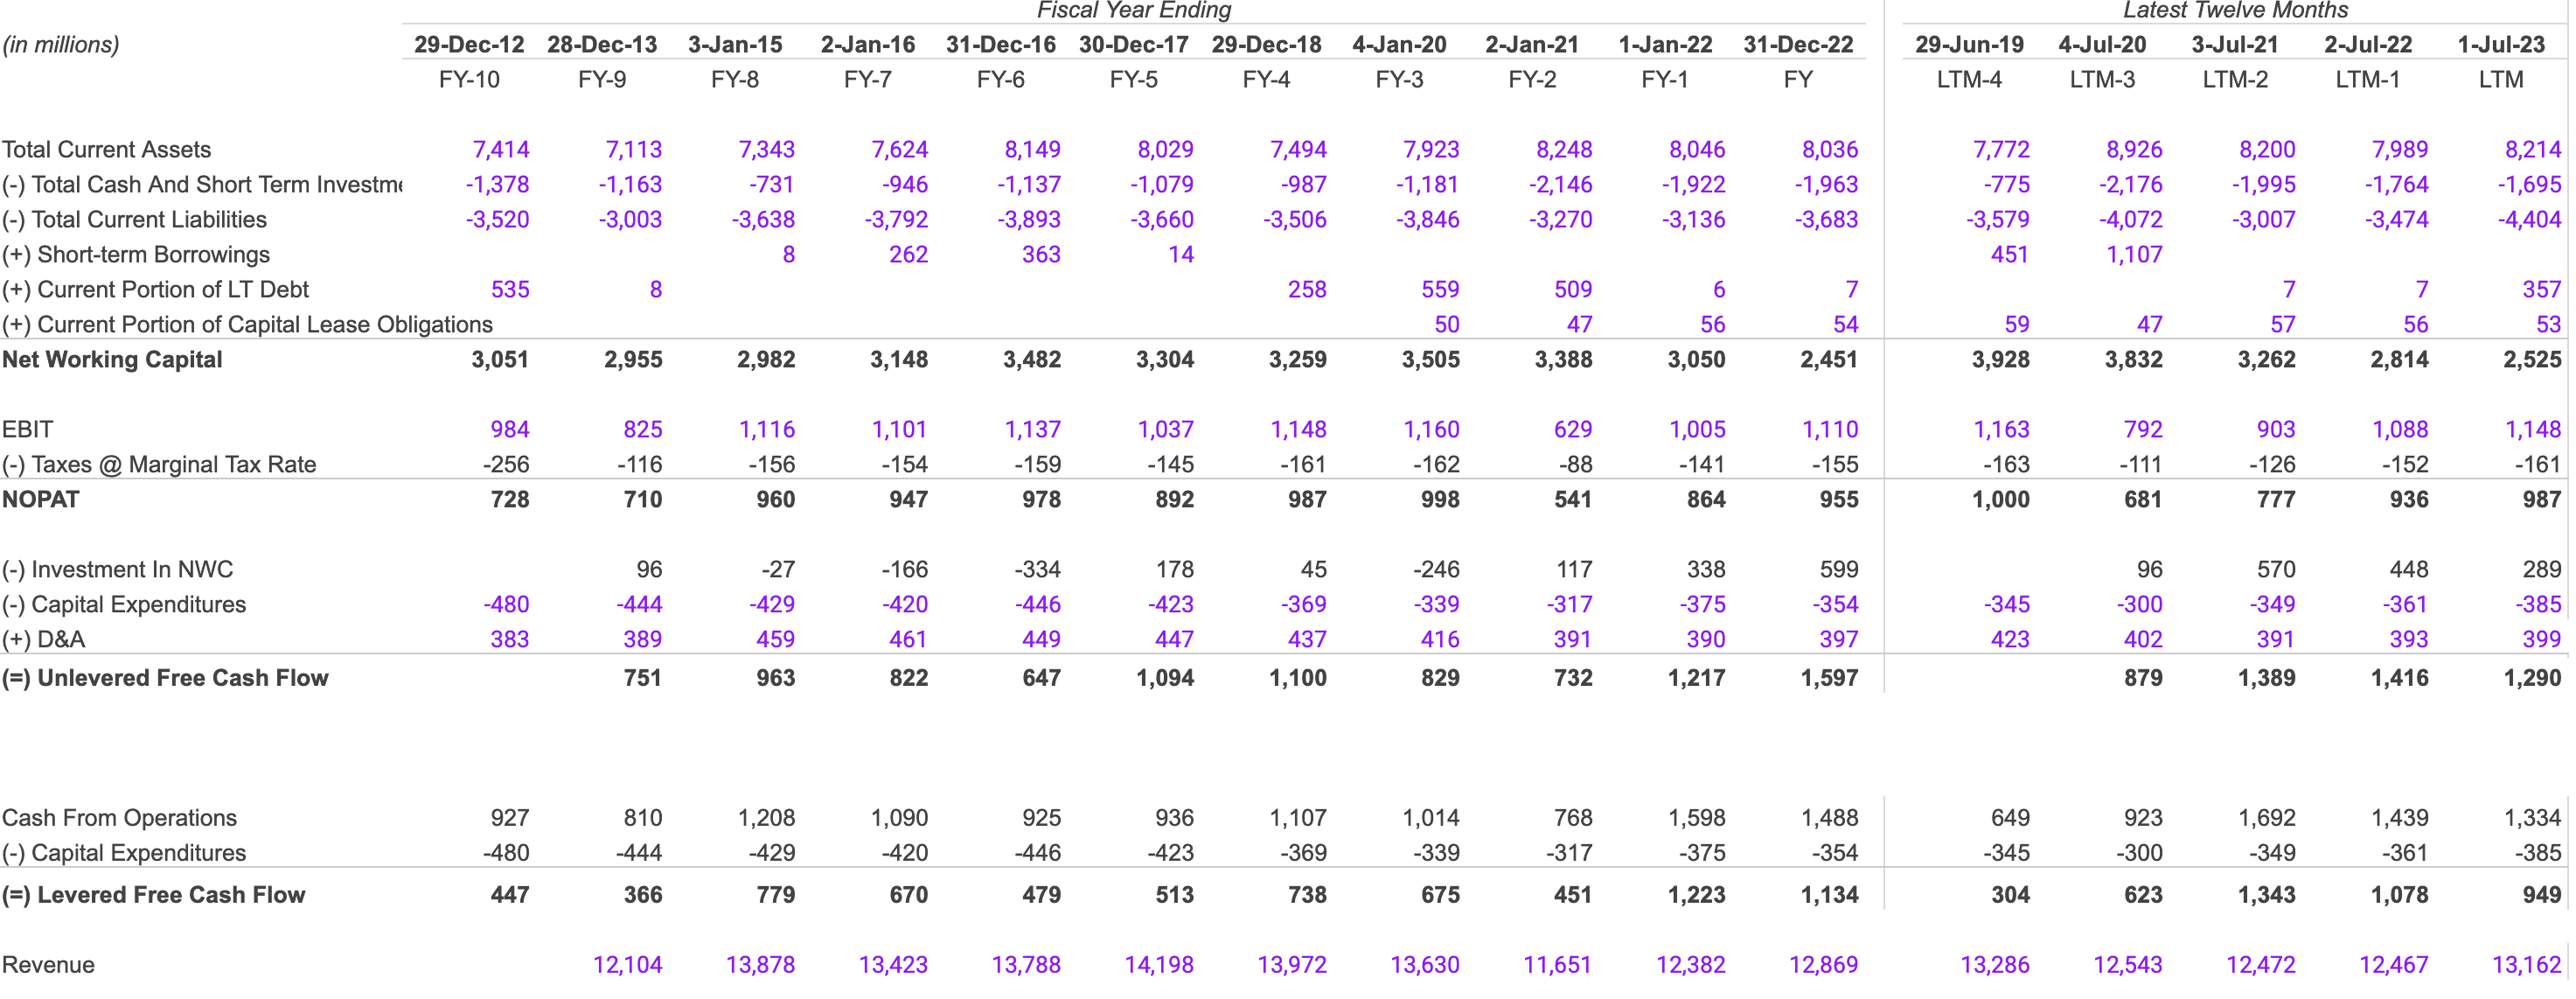
The cash from operations is on a decline, going from $1,692 million in 2021 to $1,334 million in 2023. On the investment side, the company's capital expenditures have increased from $349 million in 2021 to $385 million in 2023. This can be a positive if those investments generate solid returns down the road.
When it comes to the quality of earnings, we see a bit of a mixed bag. The Earnings Before Interest and Taxes (EBIT) has shown a nice bump, going from $903 million in 2021 to $1,148 million in 2023. Net Operating Profit After Tax (NOPAT) is up as well, from $777 million to $987 million over the same period. That's positive because it indicates the company is making money from its core operations. However, the net working capital has seen a noticeable decline from $3,262 million to $2,525 million over the last two years. That could be a sign the company might struggle with its daily operations down the line.
However, both Unlevered and Levered Free Cash Flows are down. Specifically, Unlevered Free Cash Flow went from $1,389 million in 2021 to $1,290 million in 2023, and Levered Free Cash Flow dipped from $1,343 million to $949 million. So, while the company’s earnings are growing, the decline in free cash flows due to debt repayment might indicate that this reduction in free cash flows is a one-time blip.
Cash Conversion Cycle
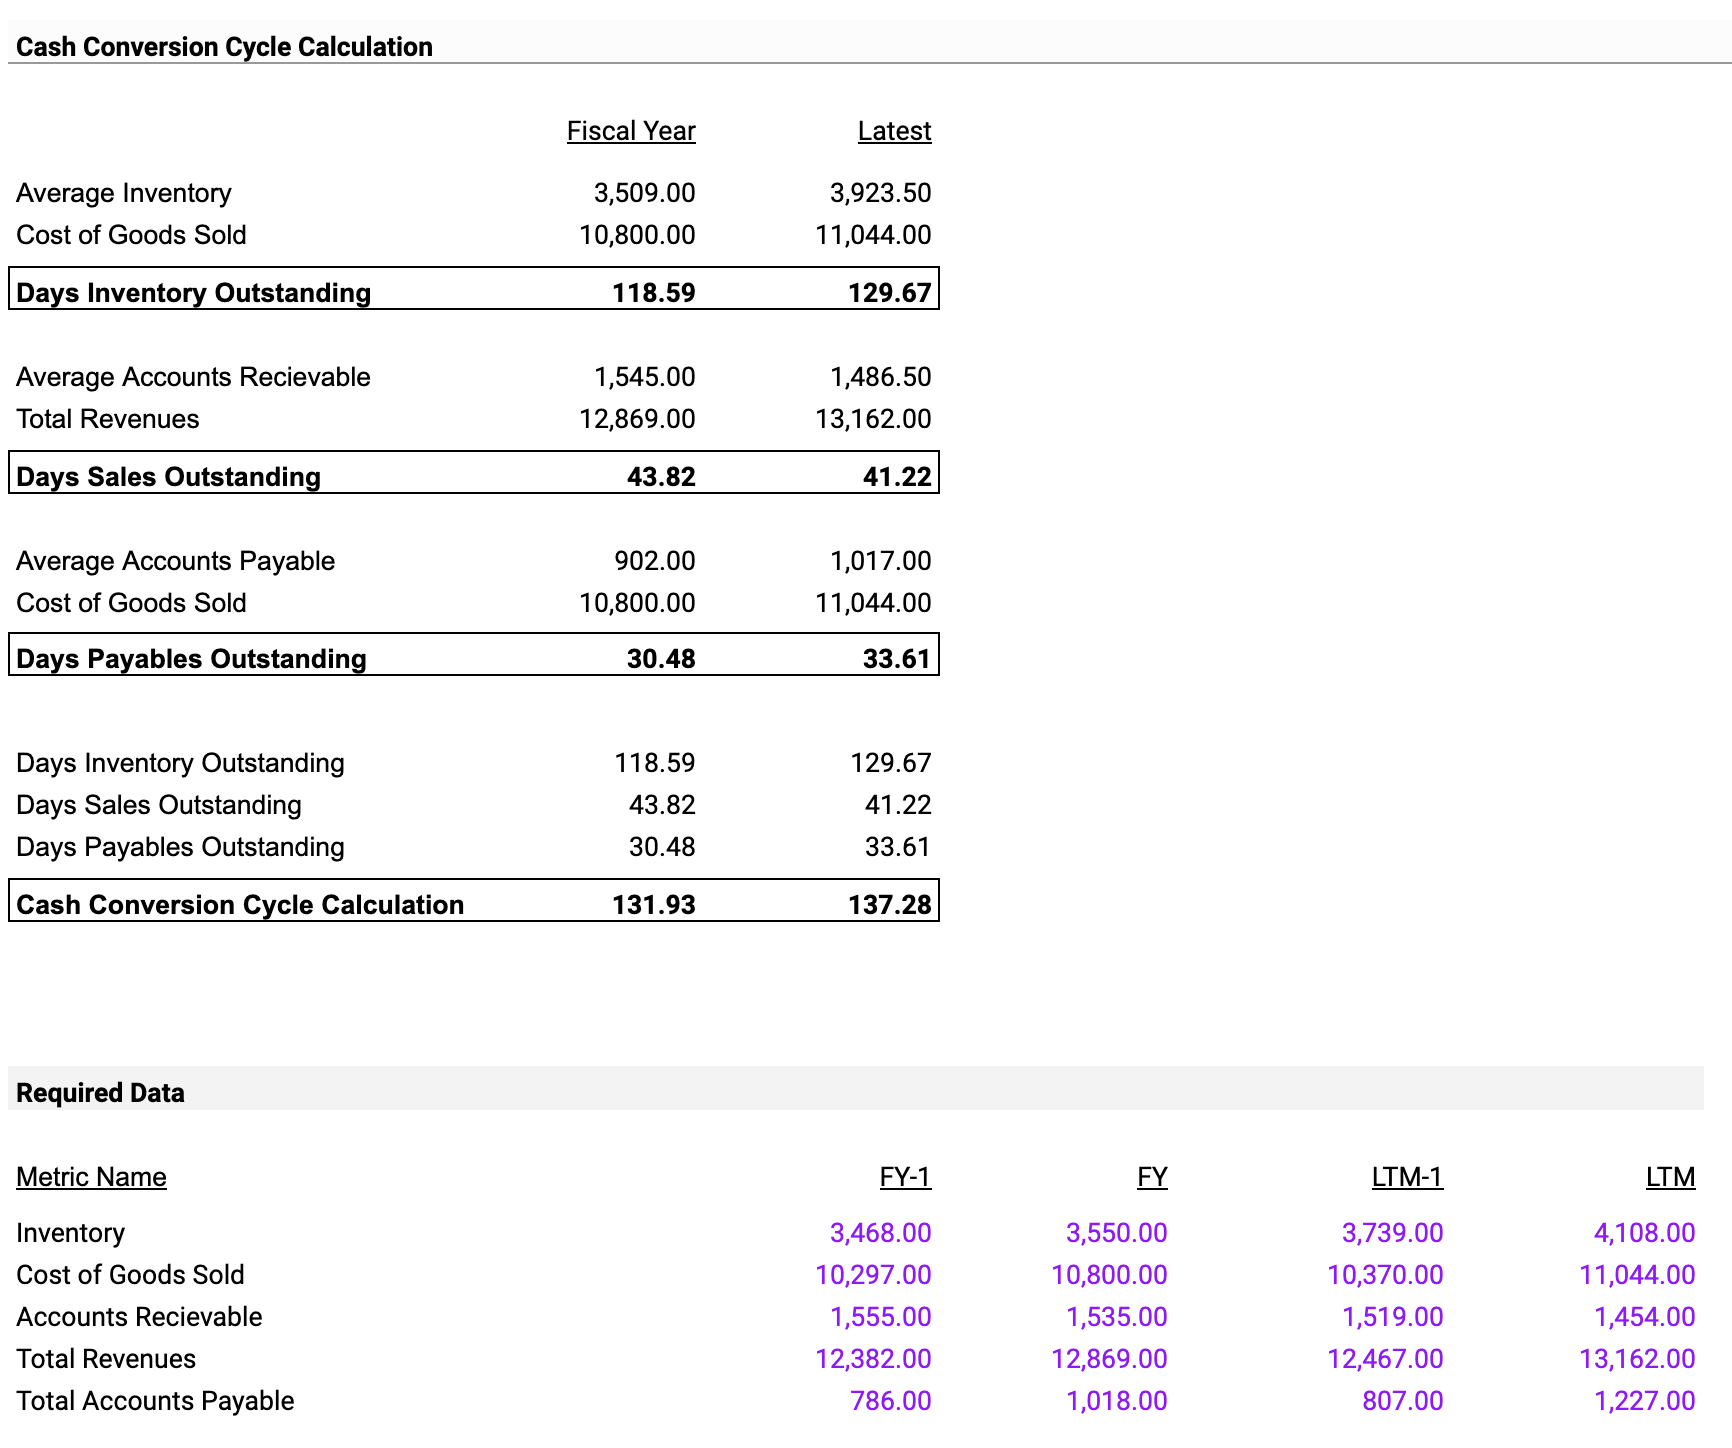
The Days Inventory Outstanding has gone up from 118.59 to 129.67 days. This means the company is taking longer to sell its inventory, which isn't ideal because it ties up cash. On the flip side, the Days Sales Outstanding has improved a bit, dropping from 43.82 to 41.22 days. So, they're getting their money from customers a little faster, which is a good sign. However, Days Payables Outstanding has also increased from 30.48 to 33.61 days, suggesting that the company is taking long time to pay suppliers. This can help with cash flow in the short term but might cause friction with suppliers. The Cash Conversion Cycle, which is a sum-up of all these metrics, has risen from 131.93 days to 137.28 days. That's not good because it means the company needs more time to turn its inventory into cash.
When forecasting what the next year might look like, these trends could mean tighter liquidity if they continue. The key metric to watch right now is the Cash Conversion Cycle, especially if you're concerned about how liquid the company is. A positive aspect is that average accounts receivable went down while revenue went up, which adds to the company's value and suggests effective collection strategies.
Shareholder Yield
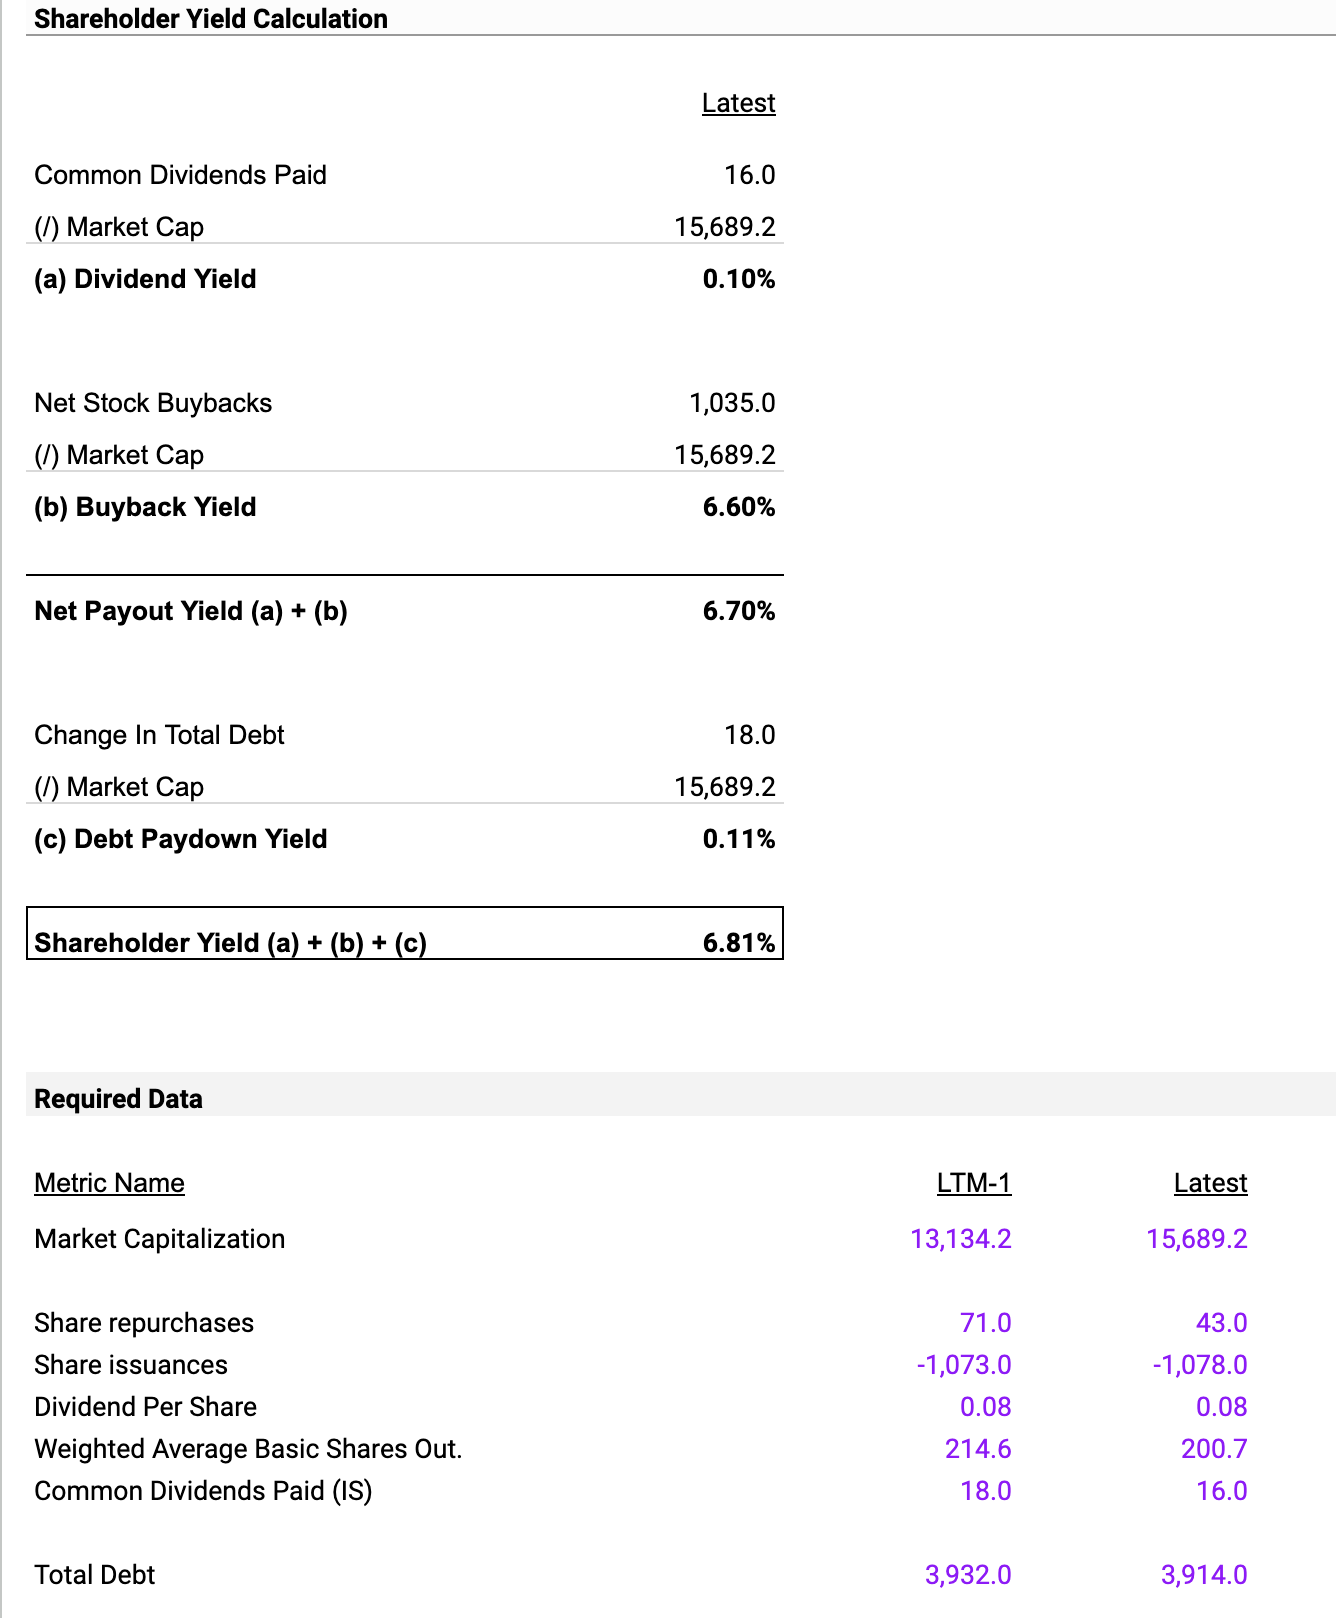
The company has a Dividend Yield of just 0.10%, calculated by taking the Common Dividends Paid of $16.0 million and dividing it by the Market Cap of $15,689.2 million. This is low, suggesting that shareholders shouldn't expect a lot of cash coming back to them in the form of dividends. However, when we consider the Buyback Yield, things get interesting. The company has a Buyback Yield of 6.60%, calculated the same way but using Net Stock Buybacks of $1,035.0 million. So, it seems the company is more inclined to buy back its shares than distribute dividends.
Add these two up, and you get a Net Payout Yield of 6.70%. A majority of this yield comes from stock buybacks, signaling the management's intent of using buybacks rather than dividends as a mode to pay back shareholders.
Looking at the company's prospects for the next year, the Shareholder Yield is a crucial metric to monitor.
Investment Recommendation
Textron appears to be in good standing with steady growth, particularly in its Aviation and Industrial segments. However, the company has several risk factors, like decreased liquidity and declining free cash flow that warrant caution. If you're okay with these risks and are looking at a medium to long-term investment, Textron could be a decent addition to your portfolio.
I'd cautiously recommend a 'Buy', based on positive growth metrics, though I'd also recommend keeping an eye on the liquidity and free cash flow aspects. Given the growth in key areas but certain financial red flags, this may be more suited for a medium to long-term investment, allowing time for the company to potentially resolve any issues.
For further details see:
A Deep Dive Into Textron Stock: A Cautious 'Buy'