SPY - Adding SDS To Our 2024MP Model Portfolio (Technical Analysis)
2024-01-05 04:10:25 ET
Summary
- ProShares UltraShort S&P500 was added to our 2024MP Model Portfolio as the market is turning down.
- Communications Sector SPDR (XLC) and Technology Sector (XLK) were deleted from our Model Portfolio.
- Market weakness is indicated by the dropping prices in mega caps, a weakening economy, and the Fed's decision to stop raising rates.
As the market (SPY) continues down, ProShares UltraShort S&P500 (SDS) gets a bounce, so we are adding it to our 2024MP Model Portfolio using our uninvested cash. We are also deleting the Communications Sector SPDR (XLC) and the Technology Sector (XLK) from this Model Portfolio until this selloff is done and we see a Buy Signal on the charts.
Market Turns Down
As you can tell from our moves, we think the market is going lower to test support after a big run-up. Our 2024MP Model Portfolio is heavily weighted in the stocks and ETFs that are being hit by this pullback. So we are deleting the ETFs being hit and adding an inverse ETF that goes up when the SPY goes down. This should cover some of our losses as the market goes lower. But why is the market going lower? Mega caps like Apple (AAPL) are dropping for fundamental reasons and analysts are downgrading it. The market is seeing some early signs of weakness in the economy. The Fed is also seeing this and that is why it has stopped raising rates because it wants a soft landing. That is a difficult timing objective for the Fed.
Timing The Market Is Tricky
Everyone knows it is tricky to time the market. The Fed is not noted for timing as most of its data is in the rearview mirror. It uses the stock market as a leading indicator. If it has stopped raising rates, it means the Fed expects this leading indicator to go down. The other leading indicators are already down.
The positive AI wave will go on for decades, but short term, the AI bounce now wants to see what earnings it will produce now and which it has already priced into stocks like Nvidia (NVDA). The N.Y. Times AI lawsuit shows what AI will have to pay up to use copyrighted material. Alphabet (GOOGL) can crawl all over the Internet for free, but AI has a problem reading the Times without paying the asking price.
The Technology stocks with their high PEs and high PEGs seem to be out of sync with a slowing economy. The magnificent seven stocks were the market leaders, but will they be in 2024? It seems like the market is looking at more reasonably priced stocks for 2024.
Fairly Valued Doing Better Than Overvalued
On this pullback, our BuyWeakness Model Portfolio is doing much better than our Robo Model Portfolio of high flyers and our 2024MP growth portfolio. If the economy continues to weaken, we think our Model Portfolios will reflect that shift to more reasonably priced stocks. So far our BuyWeakness Model Portfolio is the place to be if the market is going down. This portfolio is driven by our fundamental buy signals shown in the Implied Return and Fund columns of our daily reports.
The Stock Trader's Almanac just flashed "If Santa Claus should fail to call, bears may come to Broad and Wall." Bob Pisanti of CNBC sent out the bad news on "X" formerly Twitter, as Santa failed to show by 0.9% for the seven-day rally. (We go by our signals on the SPY chart and not that failure of the Santa rally.)
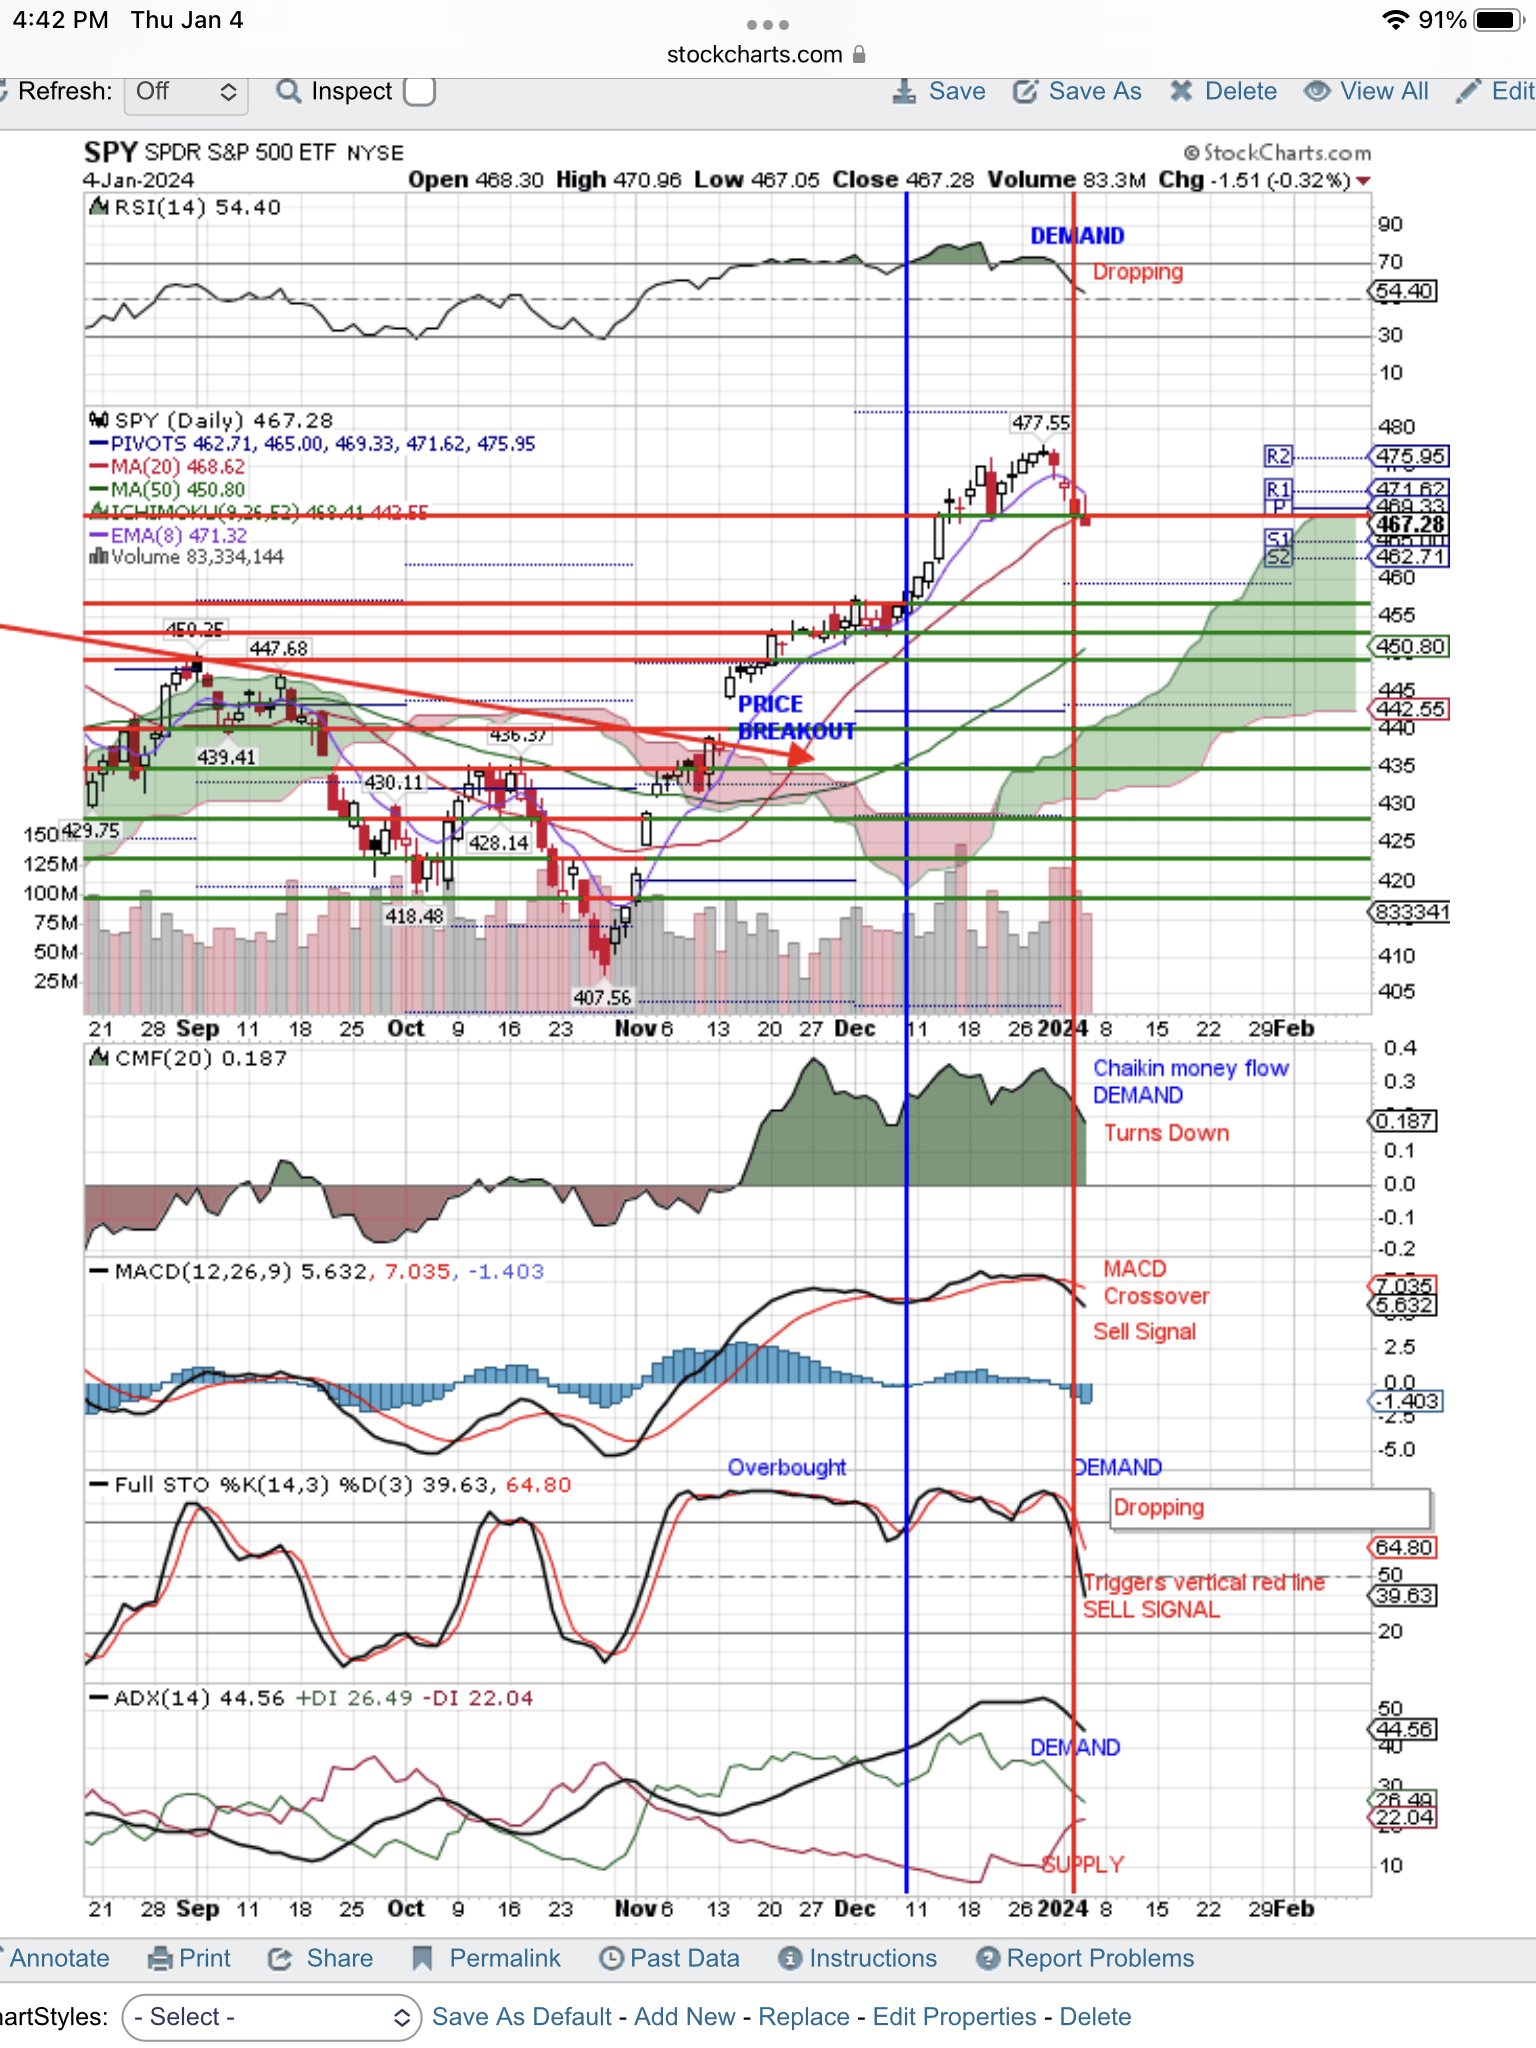
Here is the daily SPY chart showing the short-term Sell Signals:
SPY Sell Signals Targeting $460 (StockCharts.com)
As you can see on the above chart, all the signals show Demand dropping and Supply increasing. Price is testing support levels and targeting $460. You can see we have drawn our vertical, red line, Sell Signal triggered by the Full STO signal. Both the RSI and MACD Sell Signals led to our red line Sell Signal. We will hold the SDS until we get a buy signal on this chart.
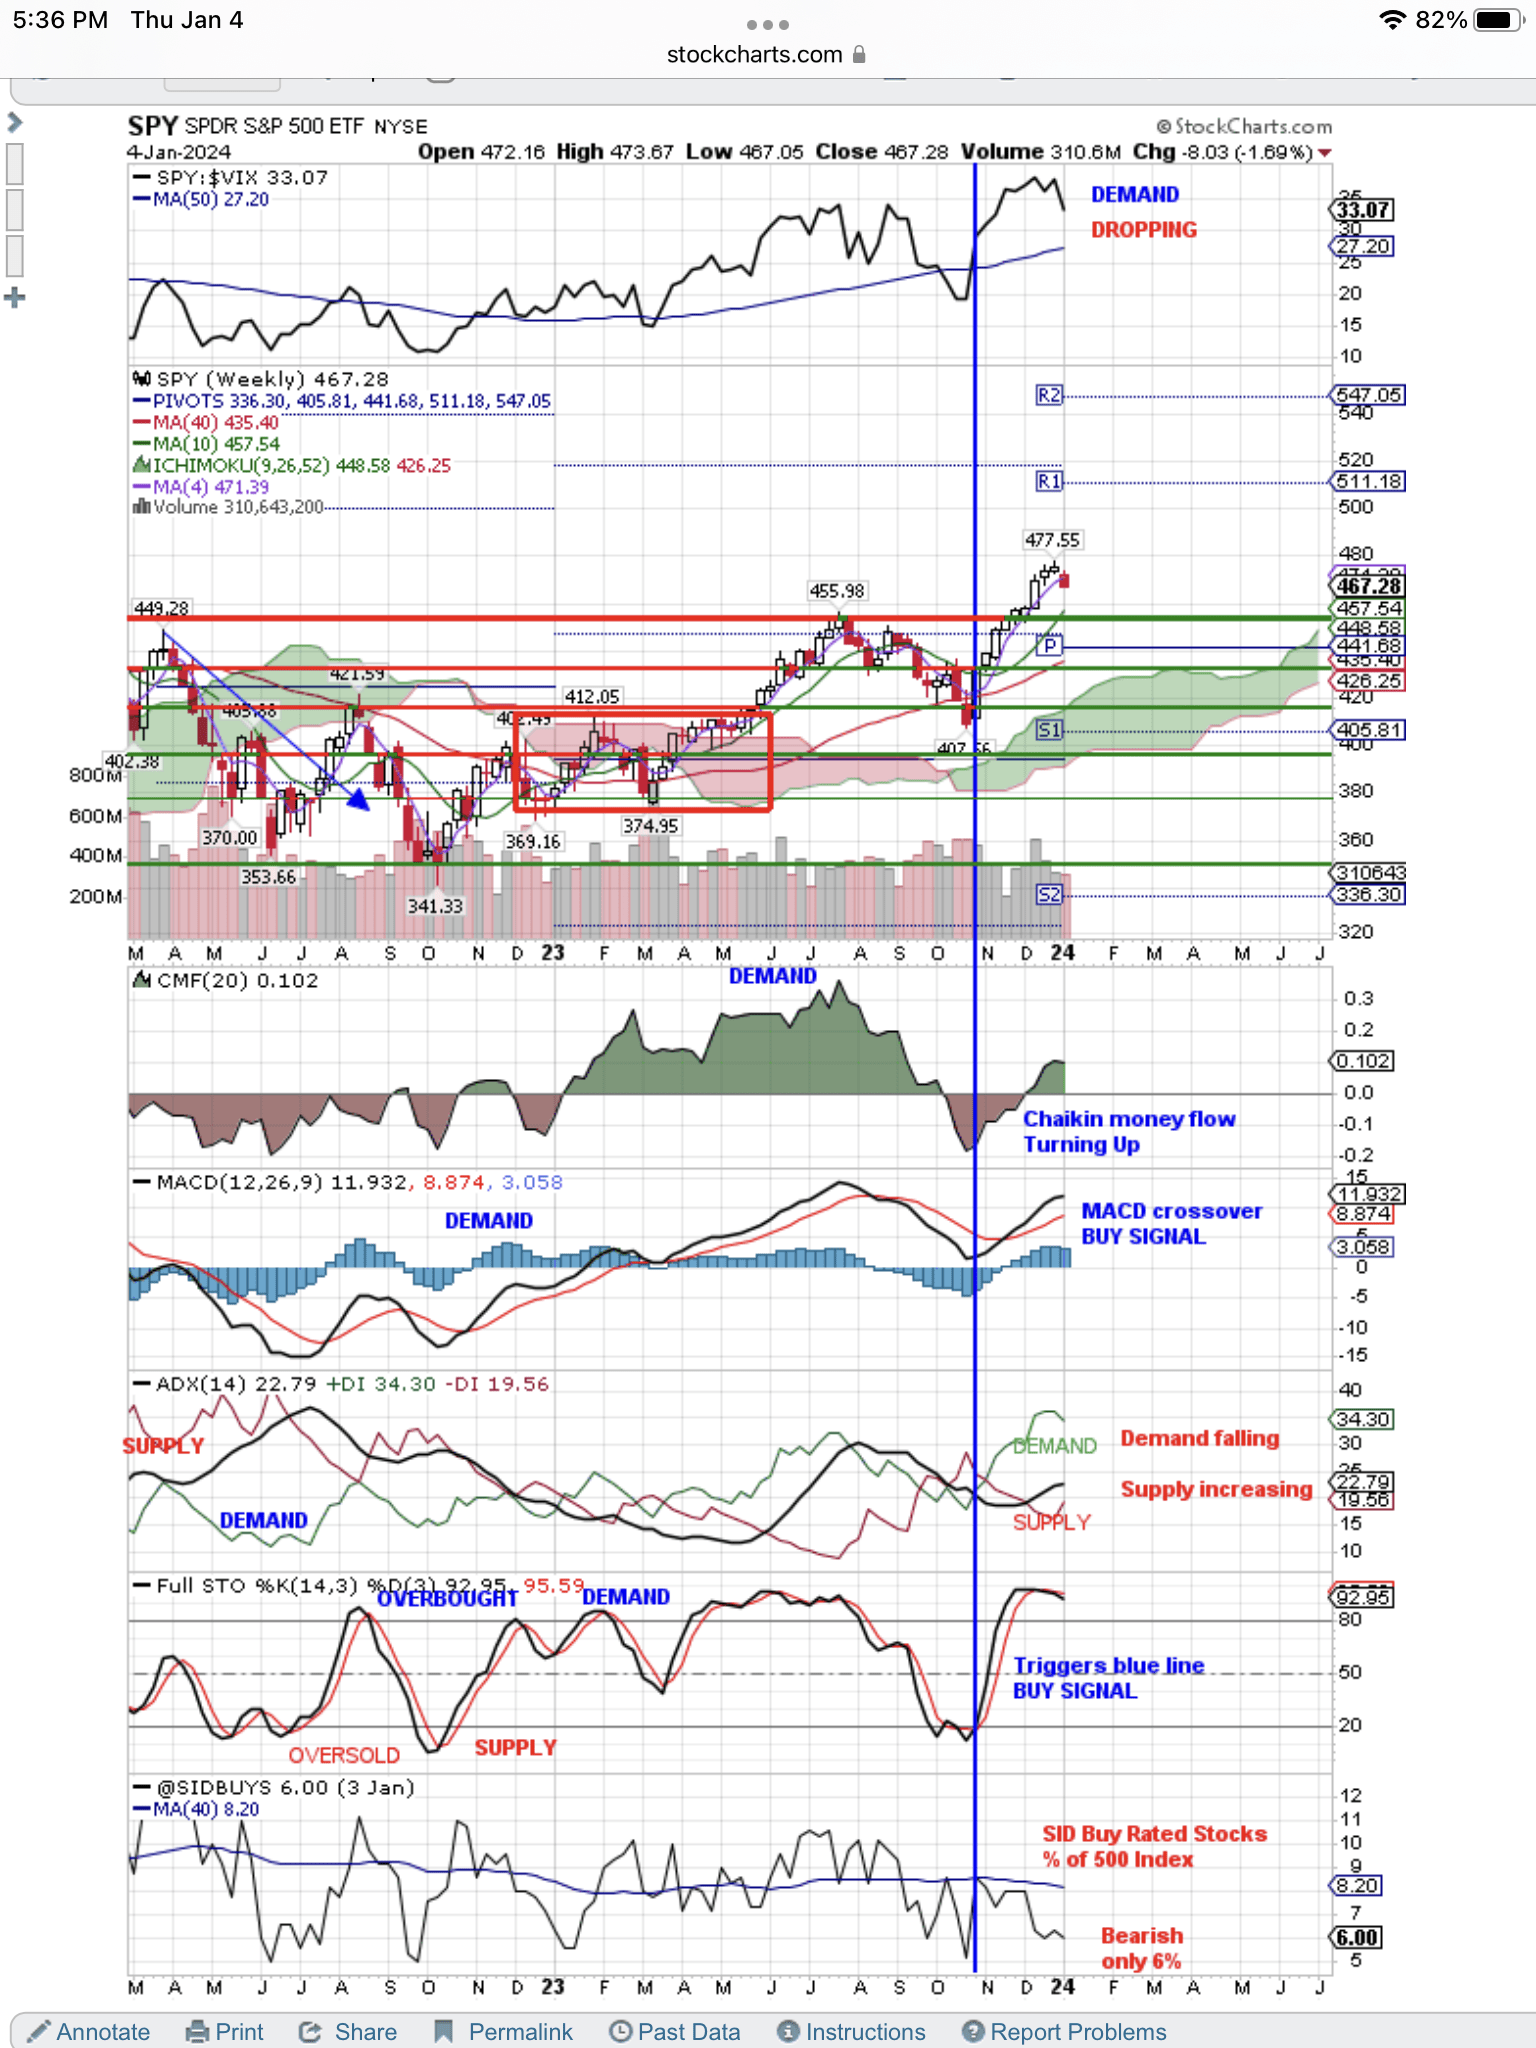
More important is the weekly chart and you can see the signals weakening. If we see a Sell Signal on this chart shown below, then the sell cycle will go from just days to weeks. We will let you know when we see a Sell Signal on the weekly with an author's update.
Here is the weekly SPY chart showing the weakening Demand signals:
Demand dropping on the weekly chart (StockCharts.com)
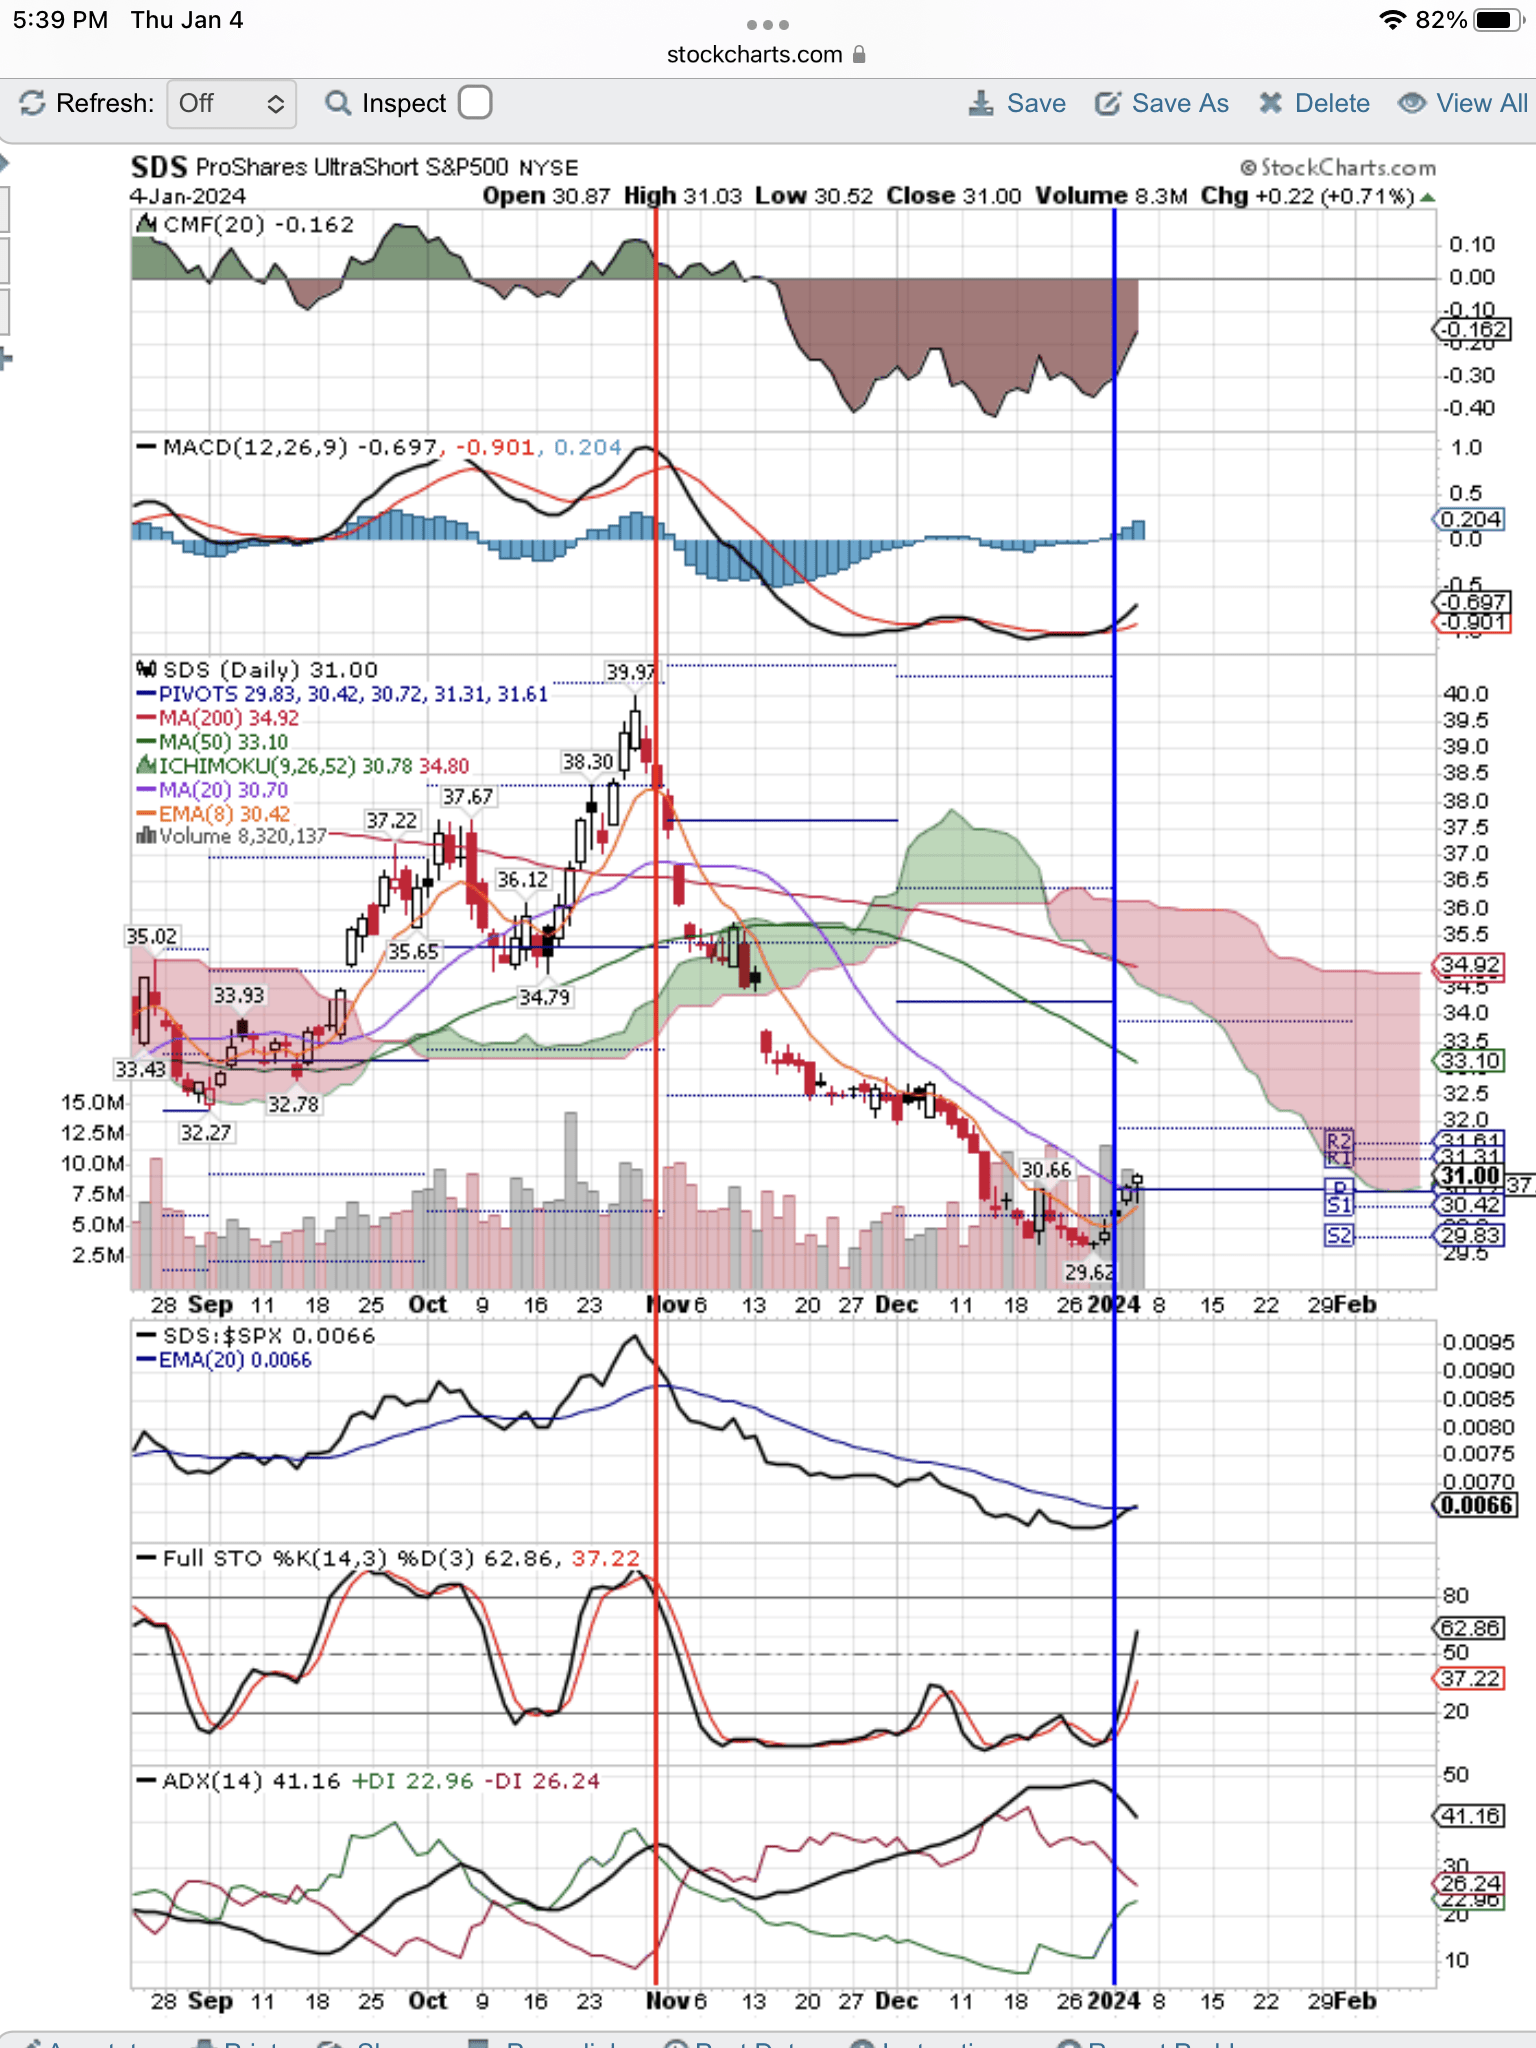
Finally, here is our SDS chart showing our blue, vertical line Buy Signal:
SDS buy signal.. (StockCharts.com)
Conclusion
As you can see, the Sell Signals on the SPY chart are triggering the Buy Signals on the SDS chart. When these signals reverse, we will delete the SDS from our 2024MP Model Portfolio. So far this is just a normal pullback after an enormous run-up in the market during the 4th quarter that made the market extremely overbought and distorted by the "magnificent seven" weighting in the Index.
For further details see:
Adding SDS To Our 2024MP Model Portfolio (Technical Analysis)