CA - Agnico Eagle Mines: One Of The Best
2023-07-28 05:43:58 ET
Summary
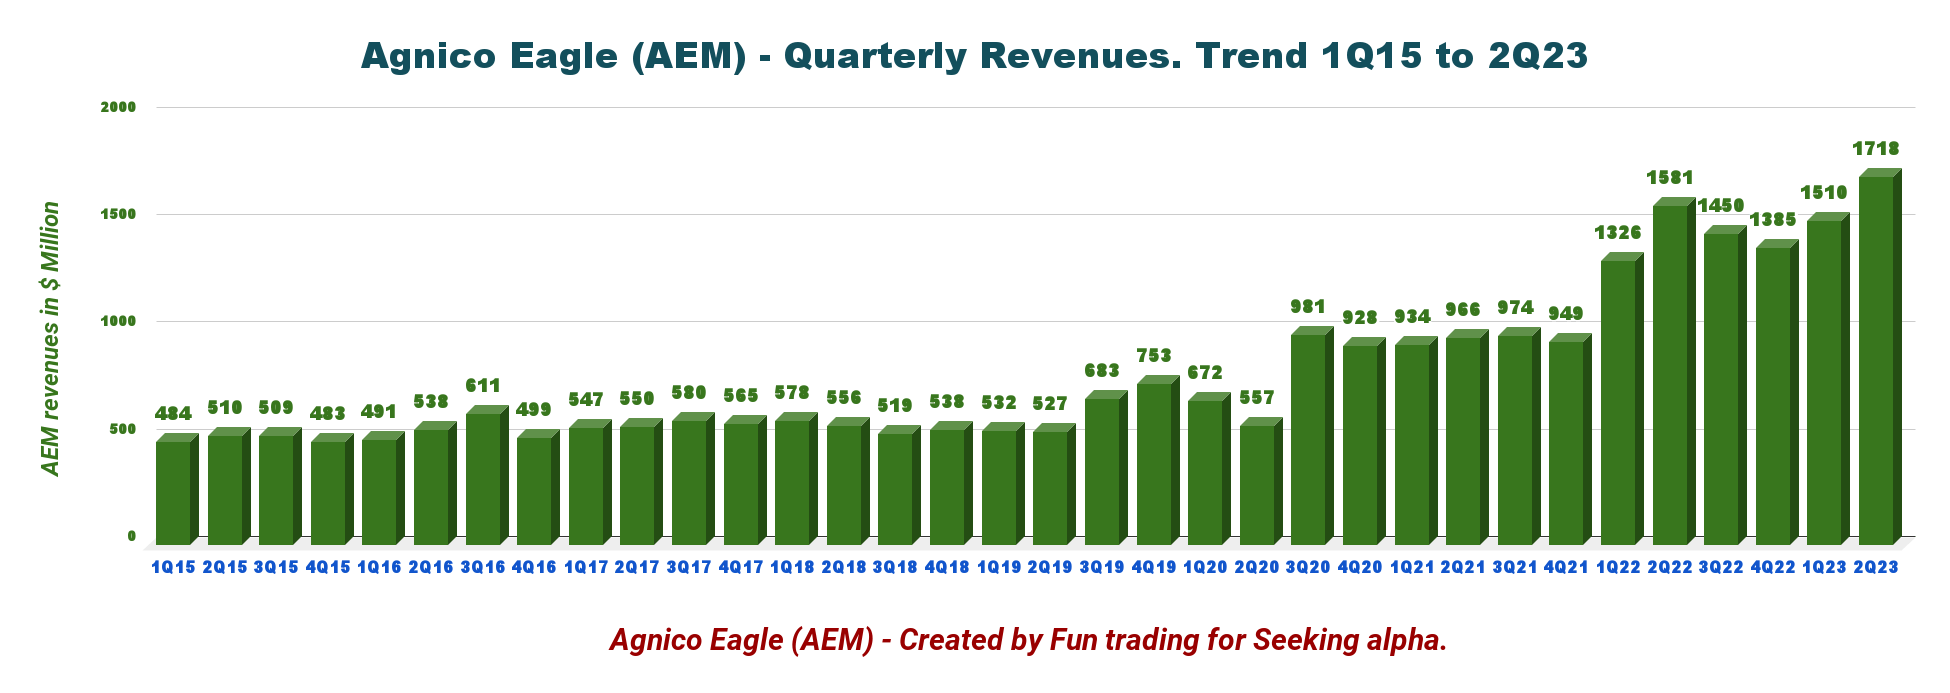
- Agnico Eagle Mines Limited's revenues were $1,718.2 million, up 8.7% compared to the same quarter a year ago and up 13.8% quarter over quarter.
- Production in the second quarter of 2023 was 873,204 Au ounces, above the 858,170 Au ounces produced last year.
- I recommend buying AEM between $50 and $49.5, with possible lower support at $47.85.
Part I - Introduction
Agnico Eagle Mines Limited (AEM) is one of the preferred long-term gold miners I have covered quarterly on Seeking Alpha since 2014. The company reported its second quarter 2023 results on July 27, 2023.
Note: This article updates my May 18, 2023 article.
AEM is now the third-largest gold producer, with a P&P mineral reserve of 49 Au Moz.
AEM Map Assets (AEM Presentation)
Ammar Al-Joundi - President and Chief Executive Officer, said in the conference call :
[W]e had a very strong operating quarter, consistent performance by the team across all the sites, and I'm proud to say now for several quarters in a row. Two, excellent progress on our Abitibi optimization programs. As many of you know, we have a very ambitious program to consolidate and optimize our Abitibi platform. We believe, we have the potential to add several hundred thousand ounces of additional production, potentially and we've made some good progress on that and we'll talk about that and where we are. And the third point is we've had some excellent exploration results.
1 - 2Q23 Results Snapshot
AEM posted a net income of $326.82 million in 2Q23, or $0.66 per diluted share, compared with $275.85 million, or $0.60, in 2Q22. Adjusted net income was $0.65 per share.
The company generated revenues of $1,718.2 million this quarter, well over the $1,581.06 million in 2Q22. Revenues were up 13.8% sequentially.
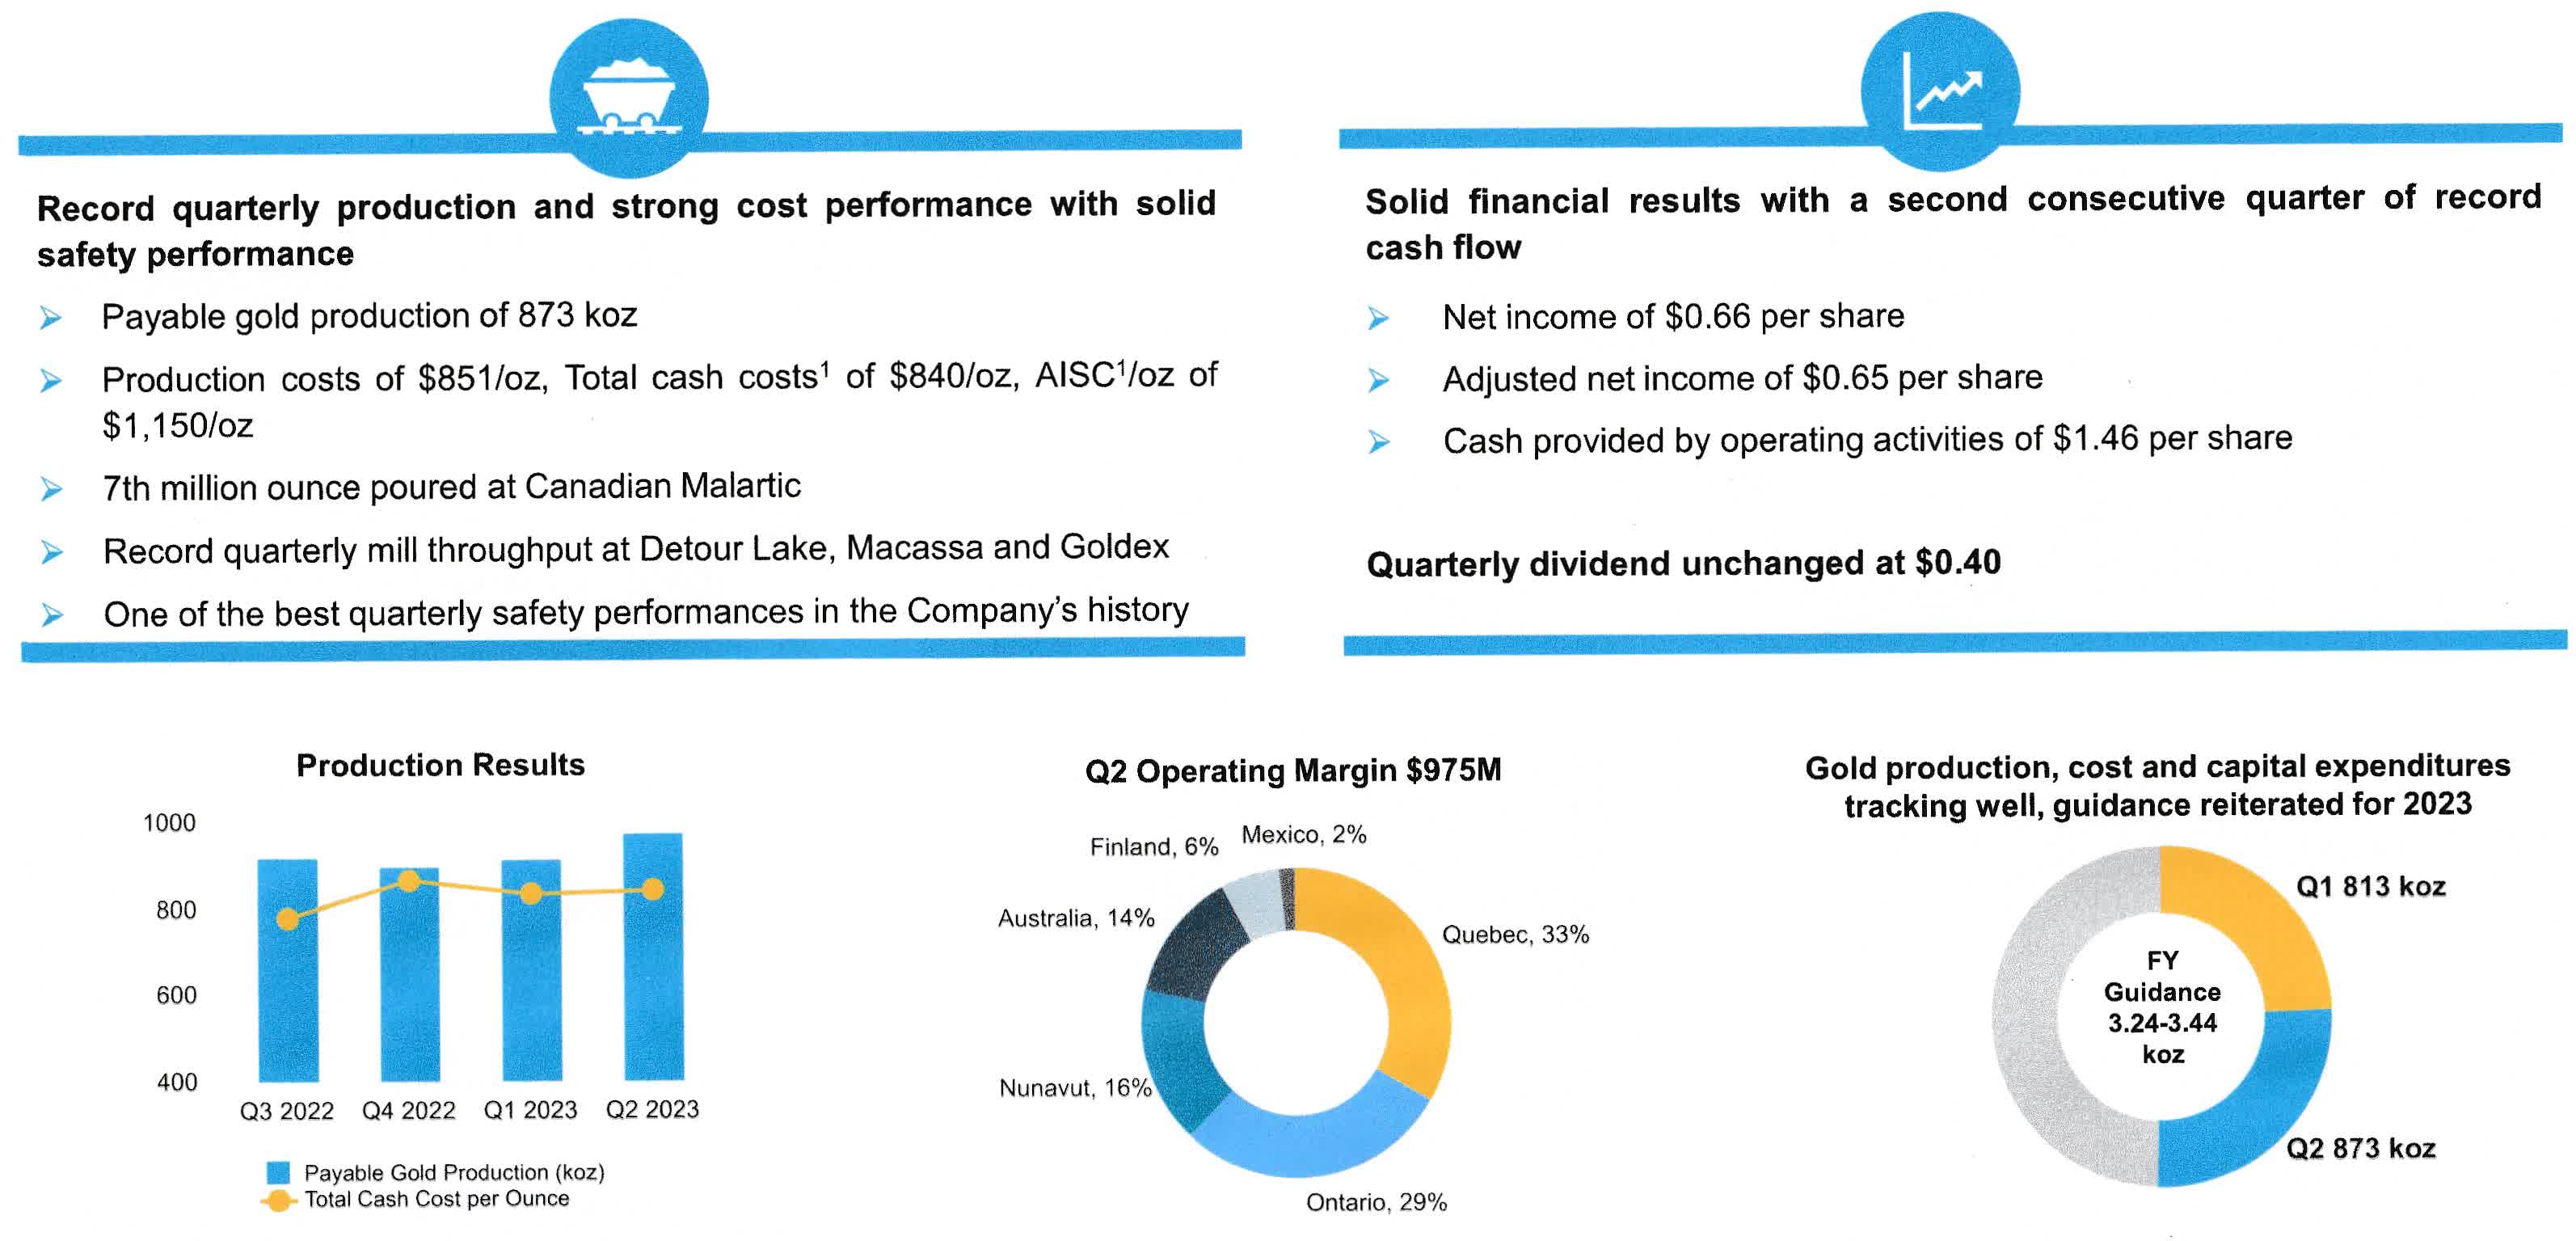
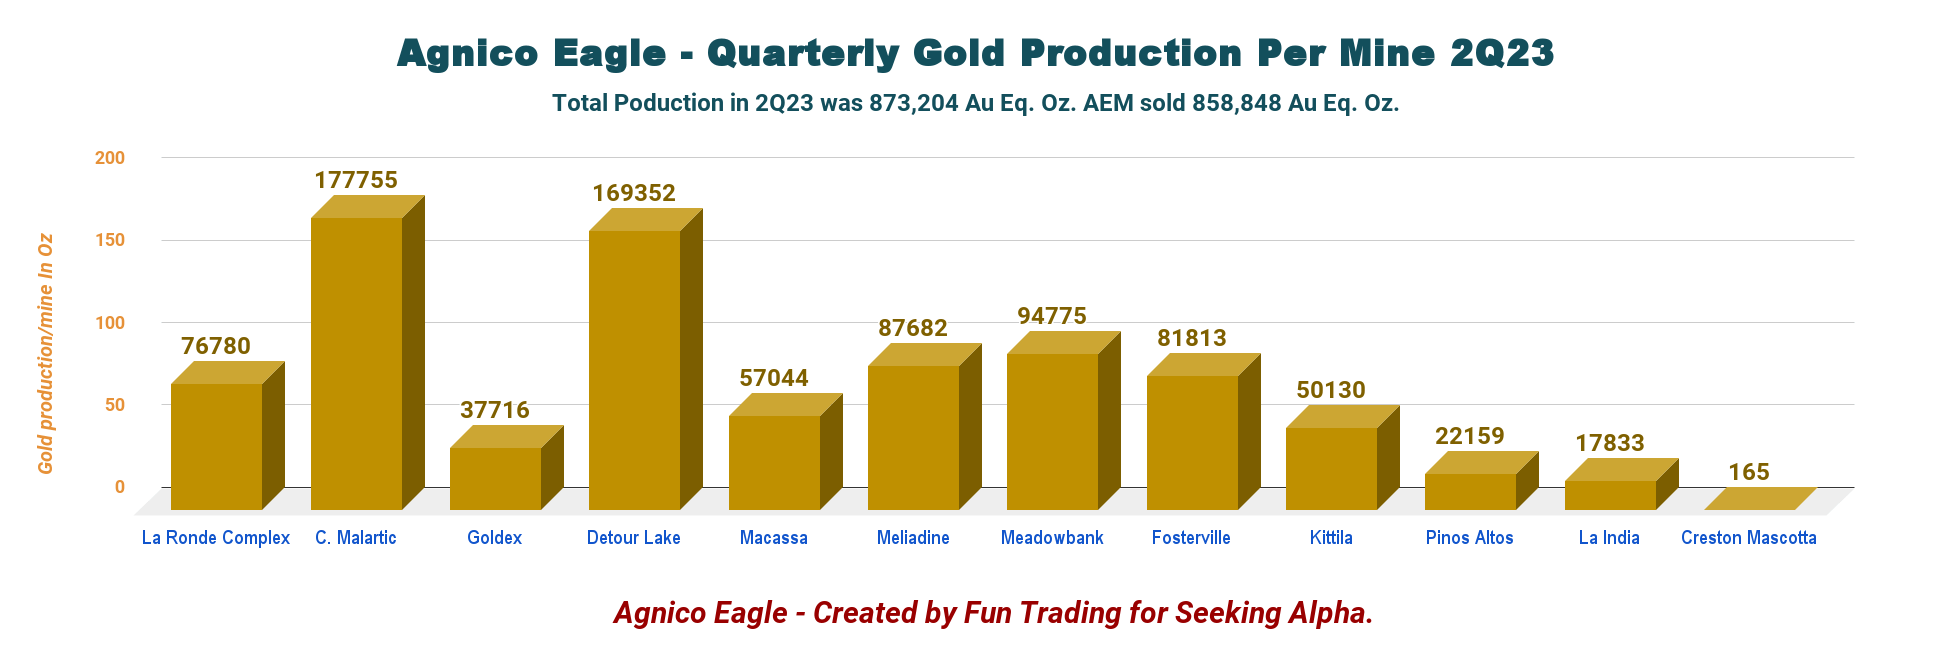
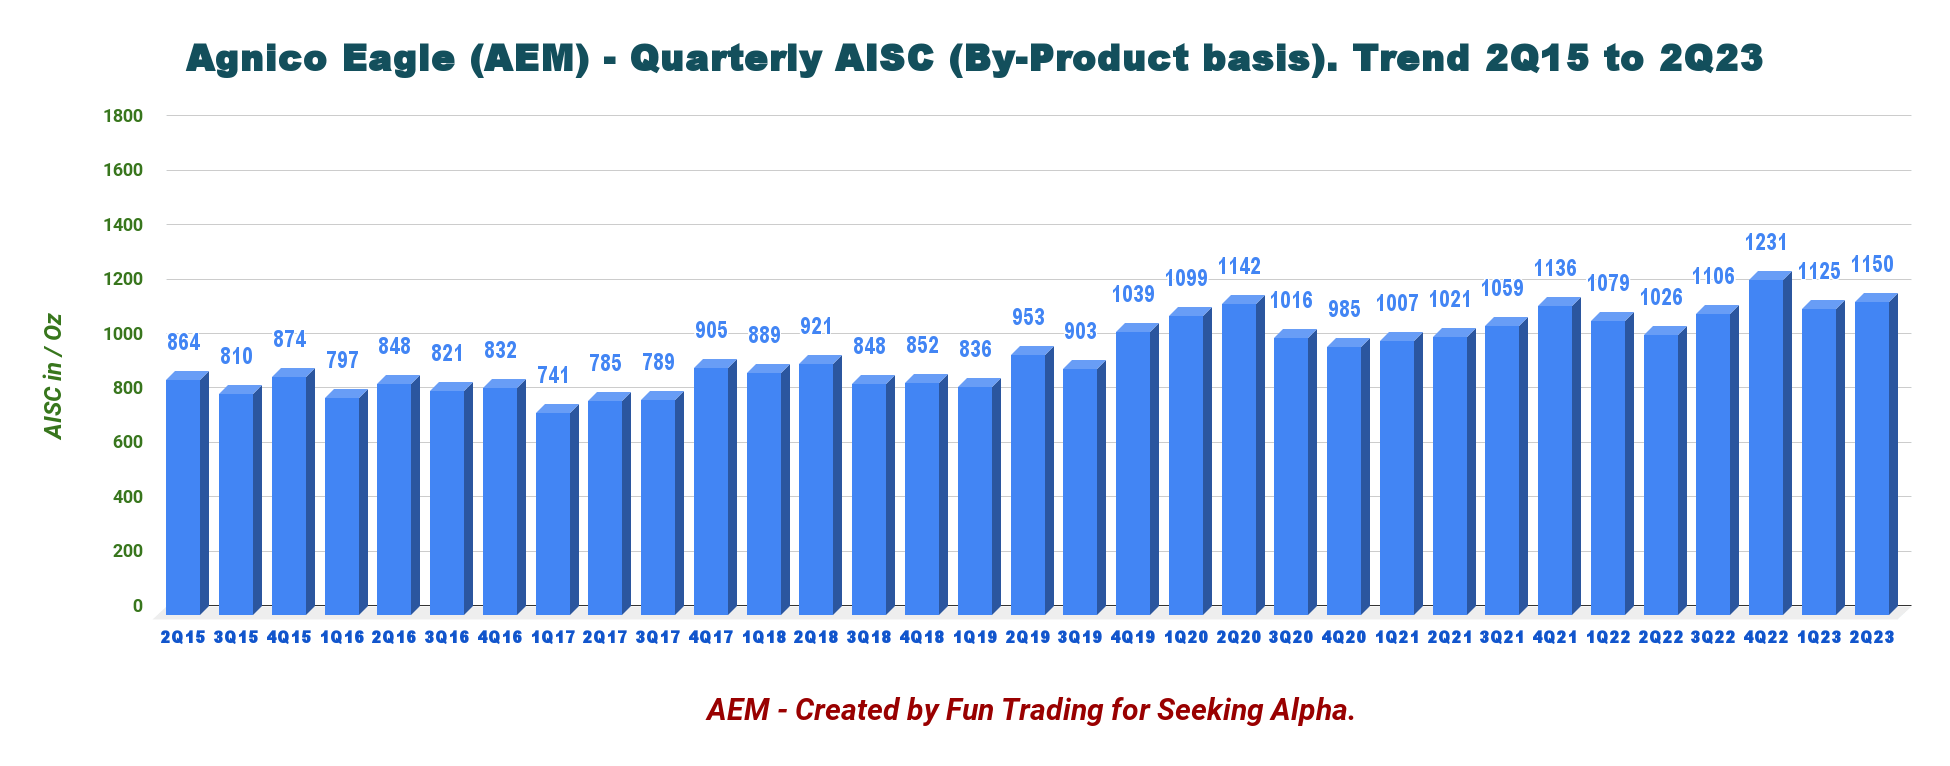
Production in the Second quarter of 2023 was 873,204 Au ounces , above the 858,170 Au ounces produced last year. All-in-sustaining costs ("AISC") per ounce were $1,150 per ounce . AEM sold 858,848 Au Oz in 2Q23.
AEM 2Q23 Highlights (AEM Presentation)
Agnico Eagle indicated 2023-2025 Guidance , including the recent Canadian Malartic portion of Yamana Gold, of excellent and consistent production for the next three years, going from 3,320K Au ounces in 2023 to 3,500K Au ounces in 2025.
AEM multi-year Guidance (AEM Filing)
2 - Stock Performance
For years, Agnico Eagle, Newmont Corporation ( NEM ), and Barrick Gold Corporation ( GOLD ) have been my preferred long gold miners.
As shown below, AEM is up 28% on a one-year basis and has slightly outperformed the group beside KGC.
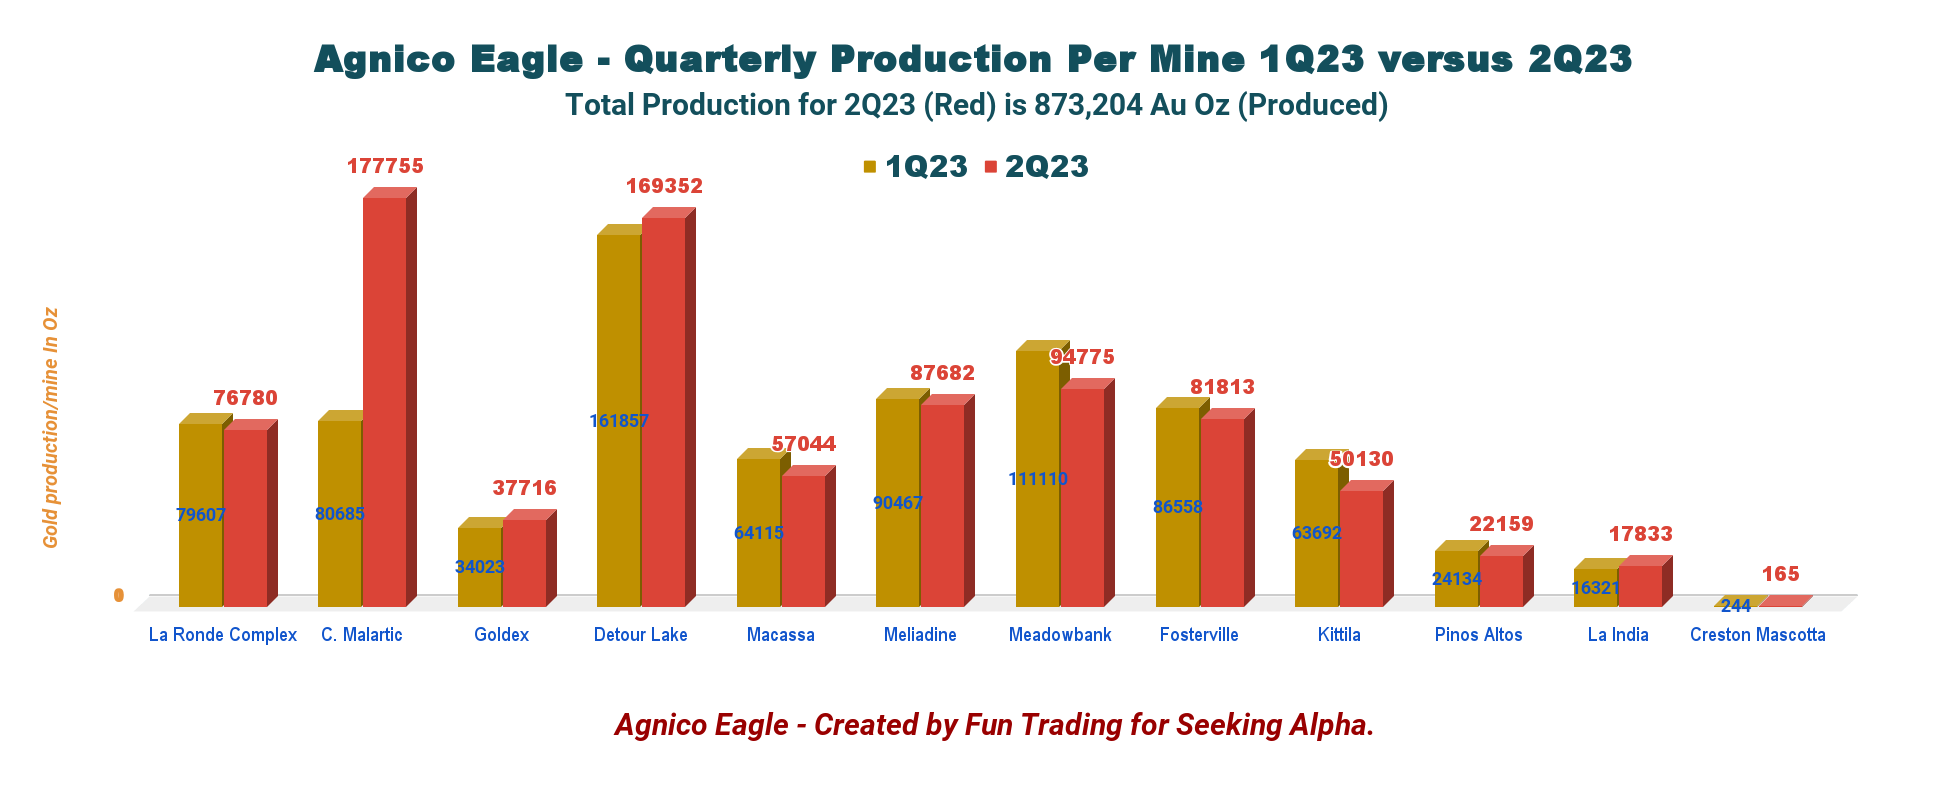
Agnico Eagle presently produces gold from 12 mines with details below:
AEM Quarterly Production per Mine 2Q22 versus 2Q23 (Fun Trading)
Note: The Canadian Malartic is still reported at 100% in 2Q23 .
3 - Investment Thesis
As I said in my previous article,
Agnico Eagle Mines Limited is as excellent a gold miner as we can find. We can't imagine talking about gold mining and omitting AEM as one of the leading players.
Thus, the long-term investment thesis is quite simple here. I recommend accumulating AEM on any weakness for the long term.
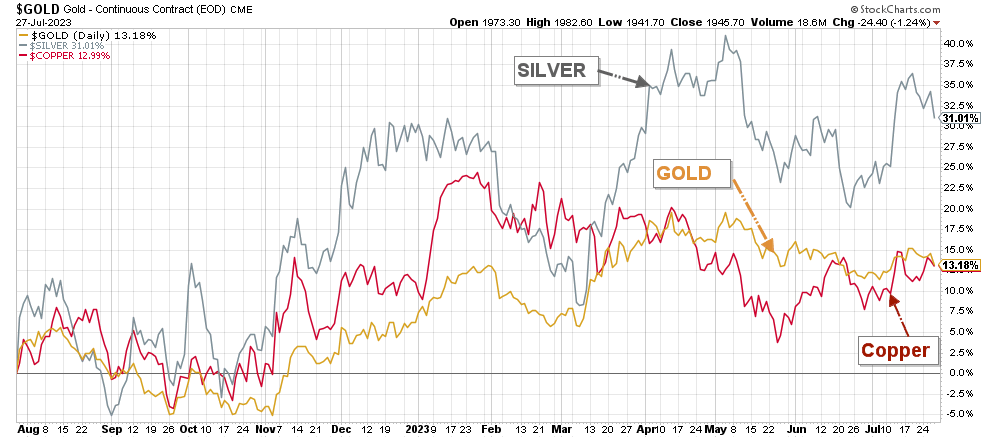
AEM is highly correlated to the gold price. Gold is now struggling due to the FED action.
Initially, the market expected the FED to consider lowering interest rates at the end of 2023, which boosted the gold price. However, the market is now less optimistic for 2023, with the FED indicating another hike in 2023 after the 25-point hike declared today.
AEM 1-Year Chart Gold, Silver, Copper (Fun Trading StockCharts)
Thus, trading short-term LIFO at a minimum of 40% of your AEM position is crucial.
Agnico Eagle - Financials and Production History Until 1Q23 - The Raw Numbers
| Agnico Eagle |
| 2Q22 |
| 3Q22 |
| 4Q22 |
| 1Q23 |
| 2Q23 |
| Total Revenues in $ Million |
| 1,581.1 |
| 1,449.7 |
| 1,384.7 |
| 1,509.7 |
| 1,718.2 |
| Net Income in $ Million |
| 275.9 |
| 79.6 |
| 205.0 |
| 1,816.9 |
| 326.82 |
| EBITDA $ Million |
| 747.7 |
| 518.8 |
| 547.1 |
| 2,272.9 |
| 883.44 |
| EPS diluted in $/share |
| 0.60 |
| 0.17 |
| 0.45 |
| 3.86 |
| 0.66 |
| Cash from operations in $ Million |
| 633.3 |
| 575.4 |
| 380.5 |
| 649.6 |
| 722.00 |
| Capital Expenditure in $ Million |
| 408.6 |
| 435.7 |
| 400.8 |
| 384.9 |
| 423.62 |
| Free Cash Flow in $ Million |
| 224.7 |
| 139.8 |
| -20.3 |
| 264.7 |
| 298.38 |
| Total cash $ Billion (including equity securities) |
| 1.016 |
| 0.822 |
| 0.669 |
| 0.754 |
| 0.442 |
| Total debt in $ Billion |
| 1.44 |
| 1.34 |
| 1.34 |
| 2.34 |
| 1.94 |
| Dividends per quarter in $/ share |
| 0.40 |
| 0.40 |
| 0.40 |
| 0.40 |
| 0.40 |
| Shares outstanding diluted in millions |
| 456.8 |
| 456.3 |
| 456.4 |
| 470.5 |
| 495.5 |
Source: Company filing and Fun trading.
Part II - Gold Production Details
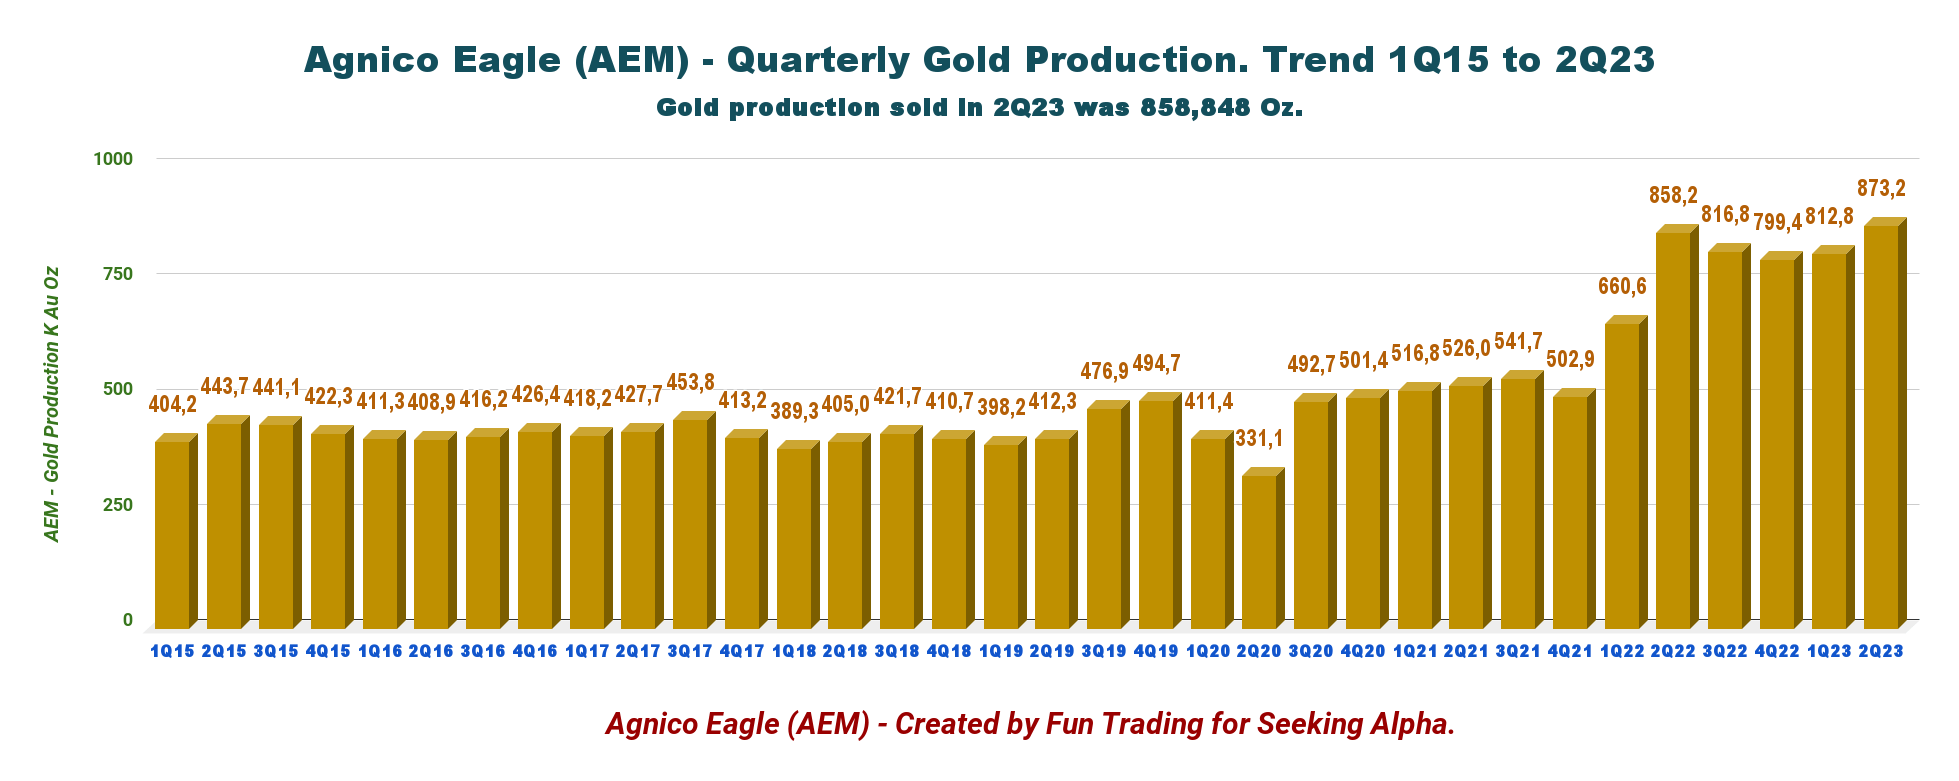
1 - Gold Production
Agnico Eagle had gold production this quarter. Production was 873,204 Au Eq. Oz from 812,813 Au Eq. ounces the preceding quarter.
Note: The company also produced 619K Ag Oz , 2,611 Tonnes of Zinc , and 746 Tonnes of Copper . Silver price was $24.43 per ounce, Zinc price was $1.06 per pound, and Copper price was $3.58 per pound.
AEM Quarterly Production History (Fun Trading) AEM included three new producing mines (Detour, Fosterville, and Macassa) and now declares 100% of the Canadian Malartic production. AEM 2Q23 Production per Mine (Fun Trading) All-in sustainable costs, or AISC, were an average of $1,150 per ounce in 2Q23 compared to $1,026 in the prior year period. AEM Quarterly AISC History (Fun Trading)
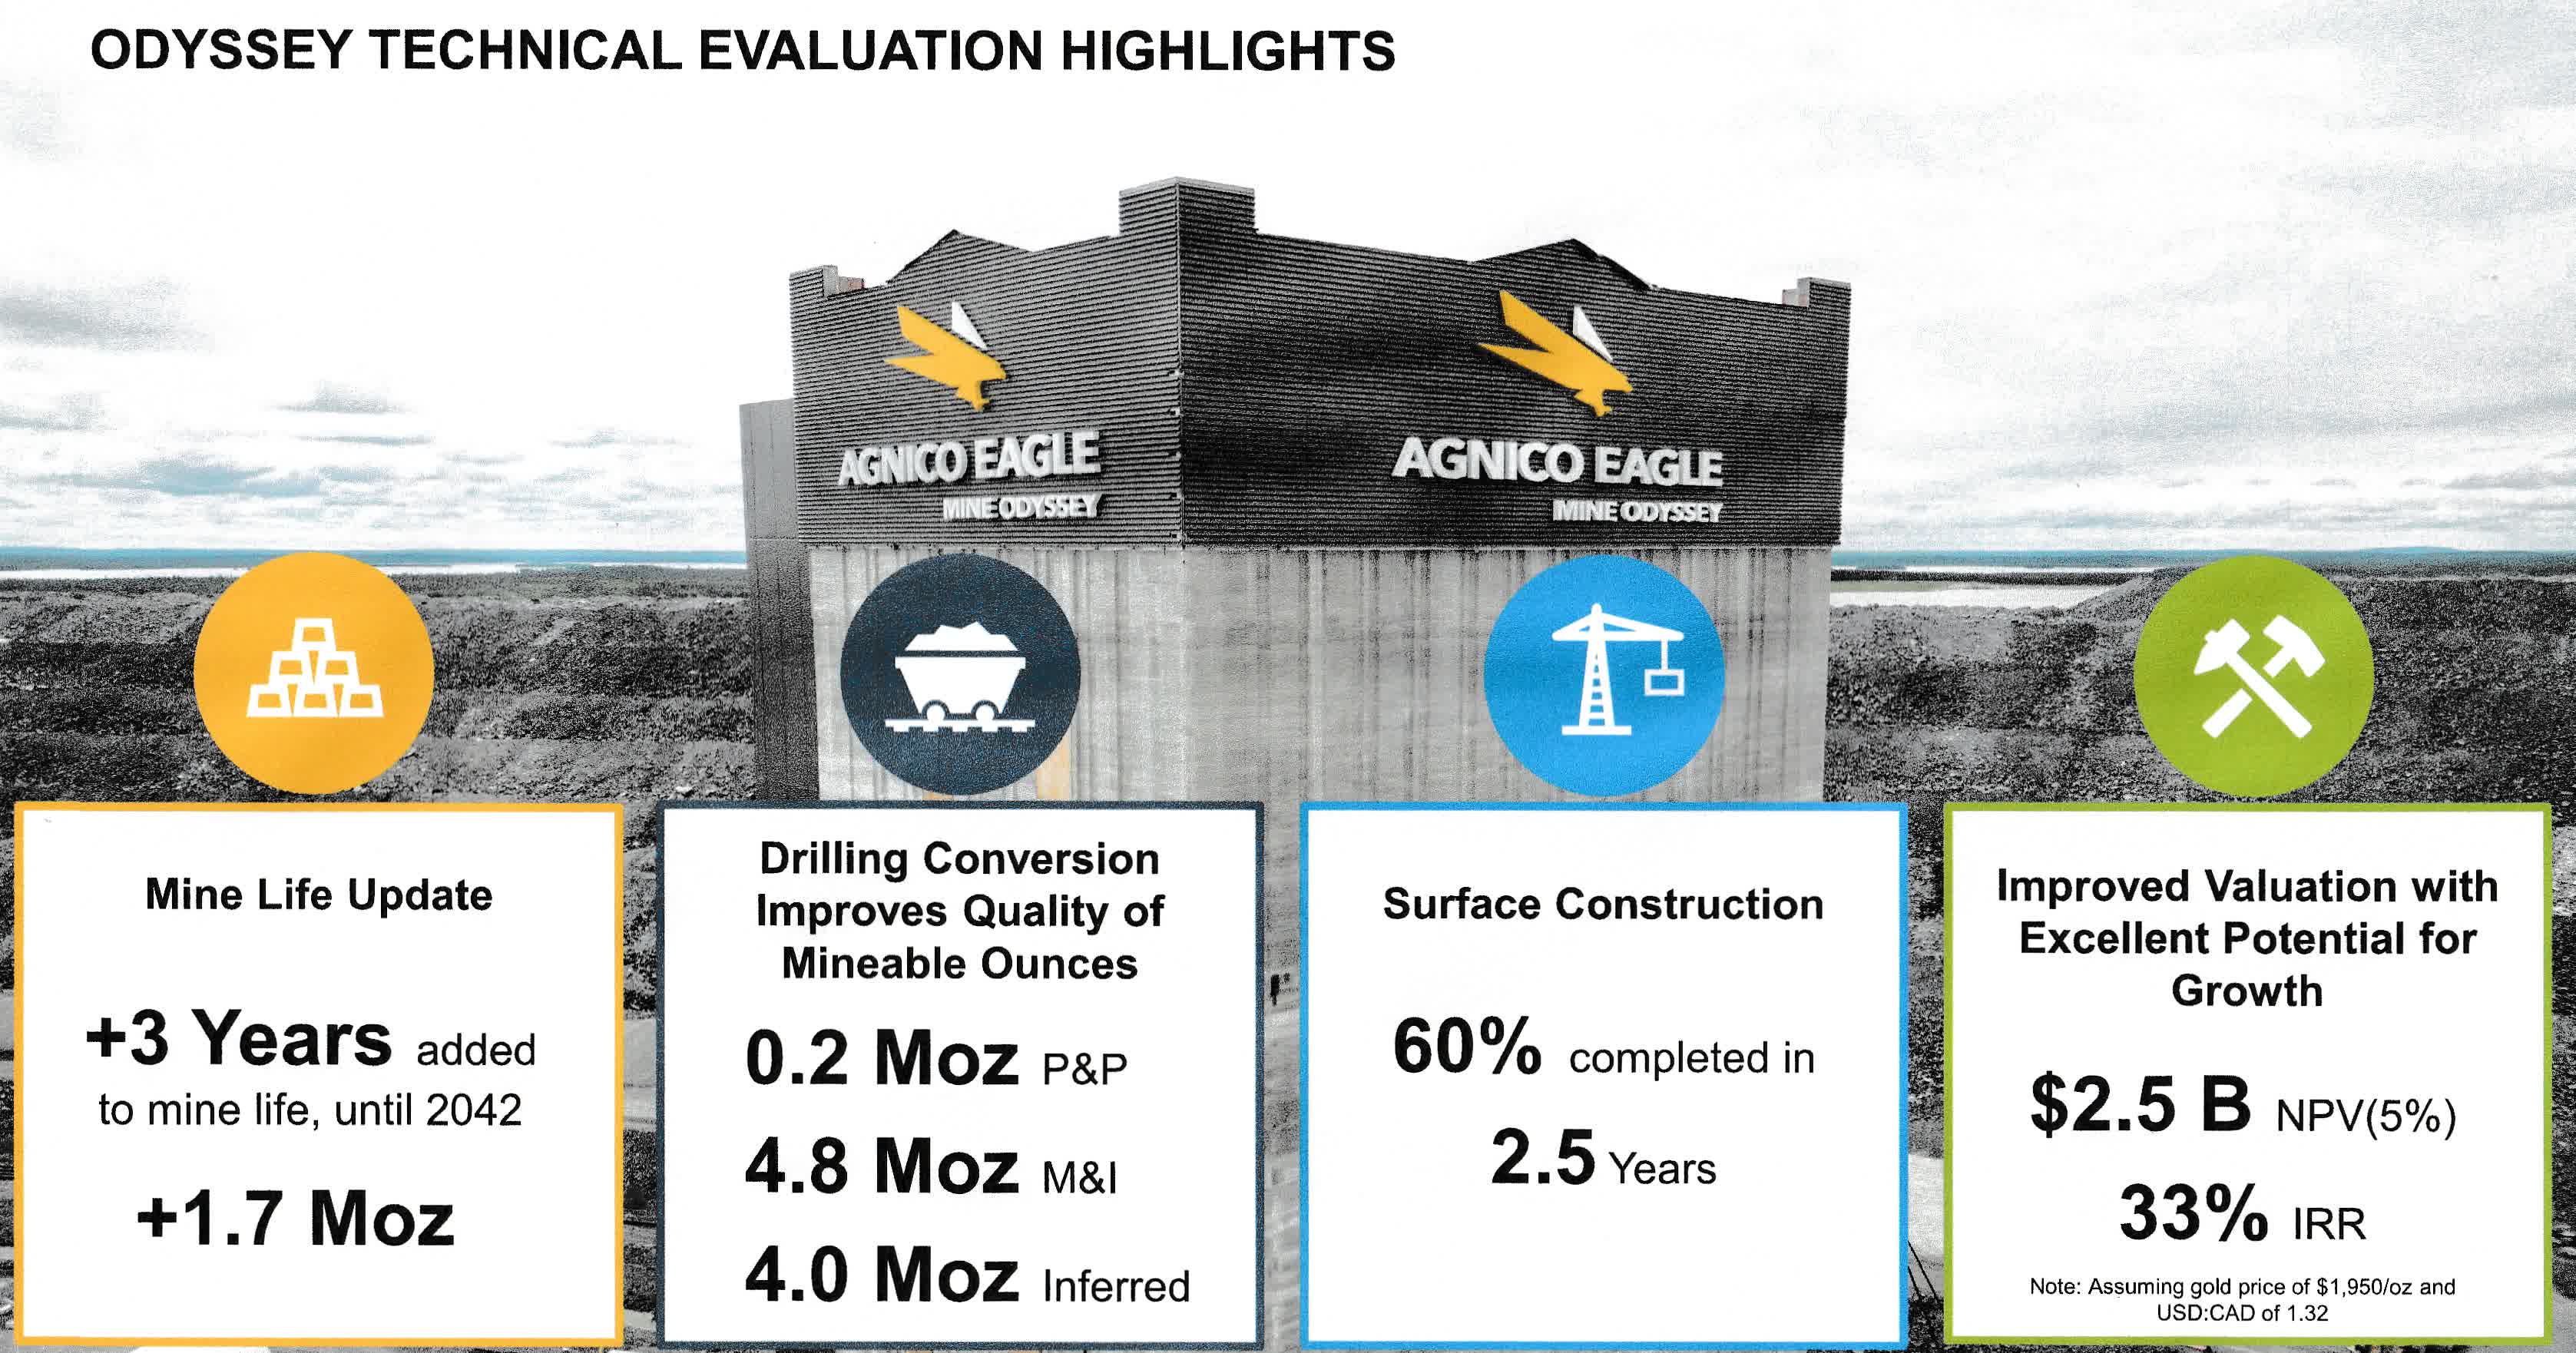
2 - The company said it completed The Odyssey Project's initial construction phase.
The surface construction is now 60% completed . It is an important project for Agnico Eagle. COO Dominique Girard said in the conference call:
Odyssey project, if we put it in perspective, the first hole where we discovered East Gouldie Zone in 2018. In 2021, we released a first study and we just updated that one last June. Very good improvement, where we production profile increased by three years. So, we have now in front of us a 20 years life of mine with 8.5 million ounces on the production plan. And this is just the beginning, as Ammar said. This is, there's still full of potential to just increase those zones. And eventually, maybe also on the regional aspect too.
AEM Odyssey Project (AEM Presentation)
Part III - Balance Sheet Analysis
1 - Revenues of $1,718.2 Million in 2Q23
Agnico Eagle Mines Limited's revenues were $1,718.2 million , up 8.7% compared to the same quarter a year ago and up 13.8% quarter over quarter.
The company posted a $326.82 million net income, or $0.66 per diluted share, in the second quarter of 2022. Adjusted net income was $0.65 per share for the second quarter of 2023.
AEM Quarterly Revenue History (Fun Trading) AEM Quarterly Gold Price History (Fun Trading)
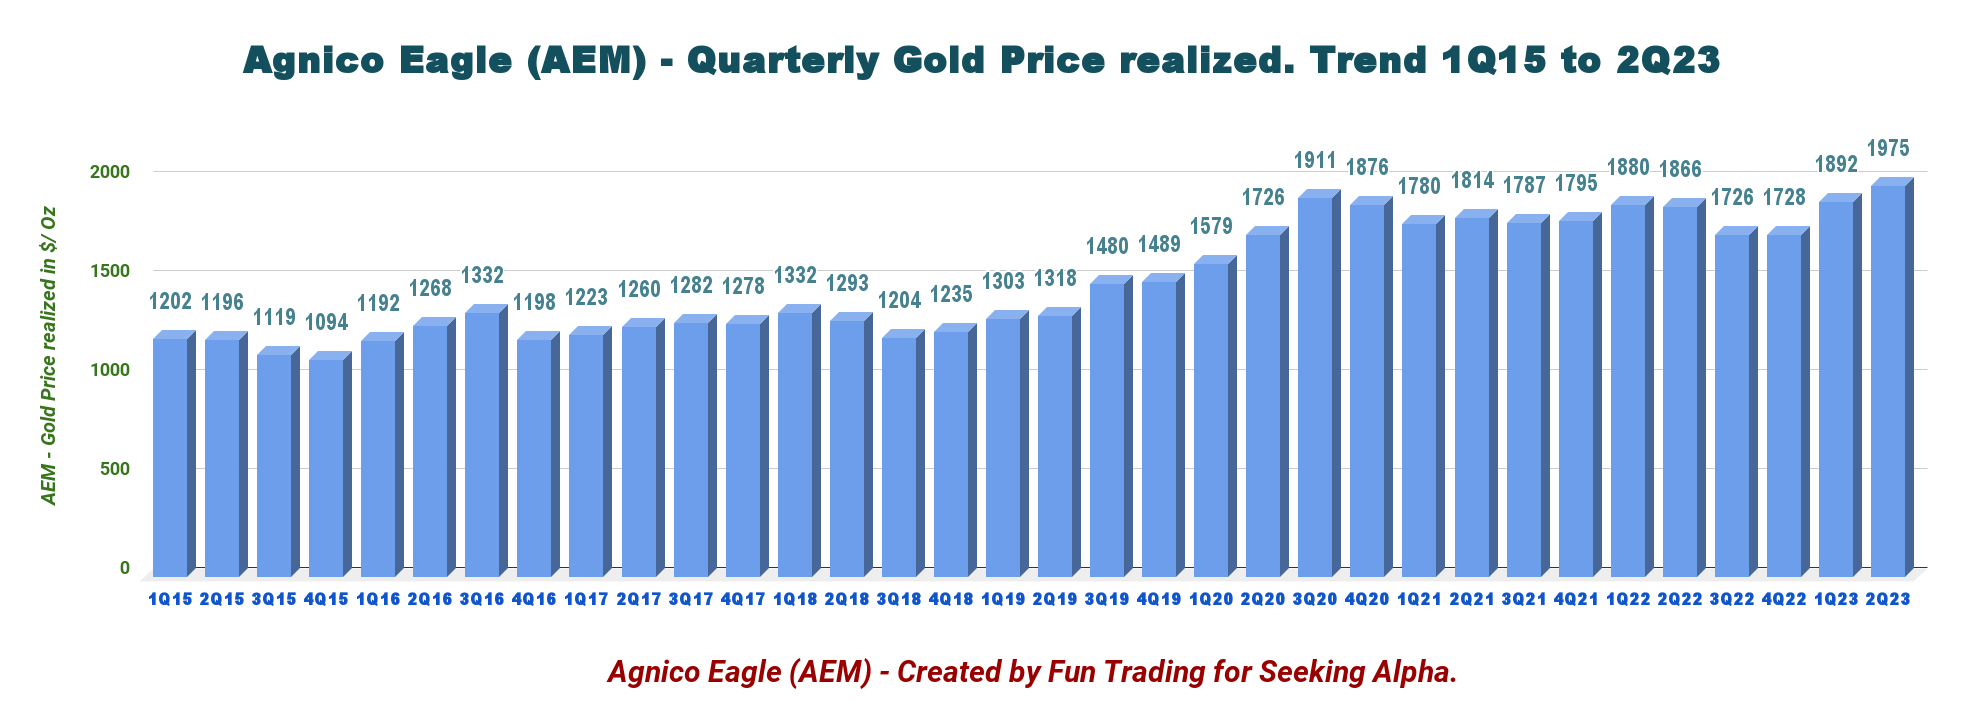
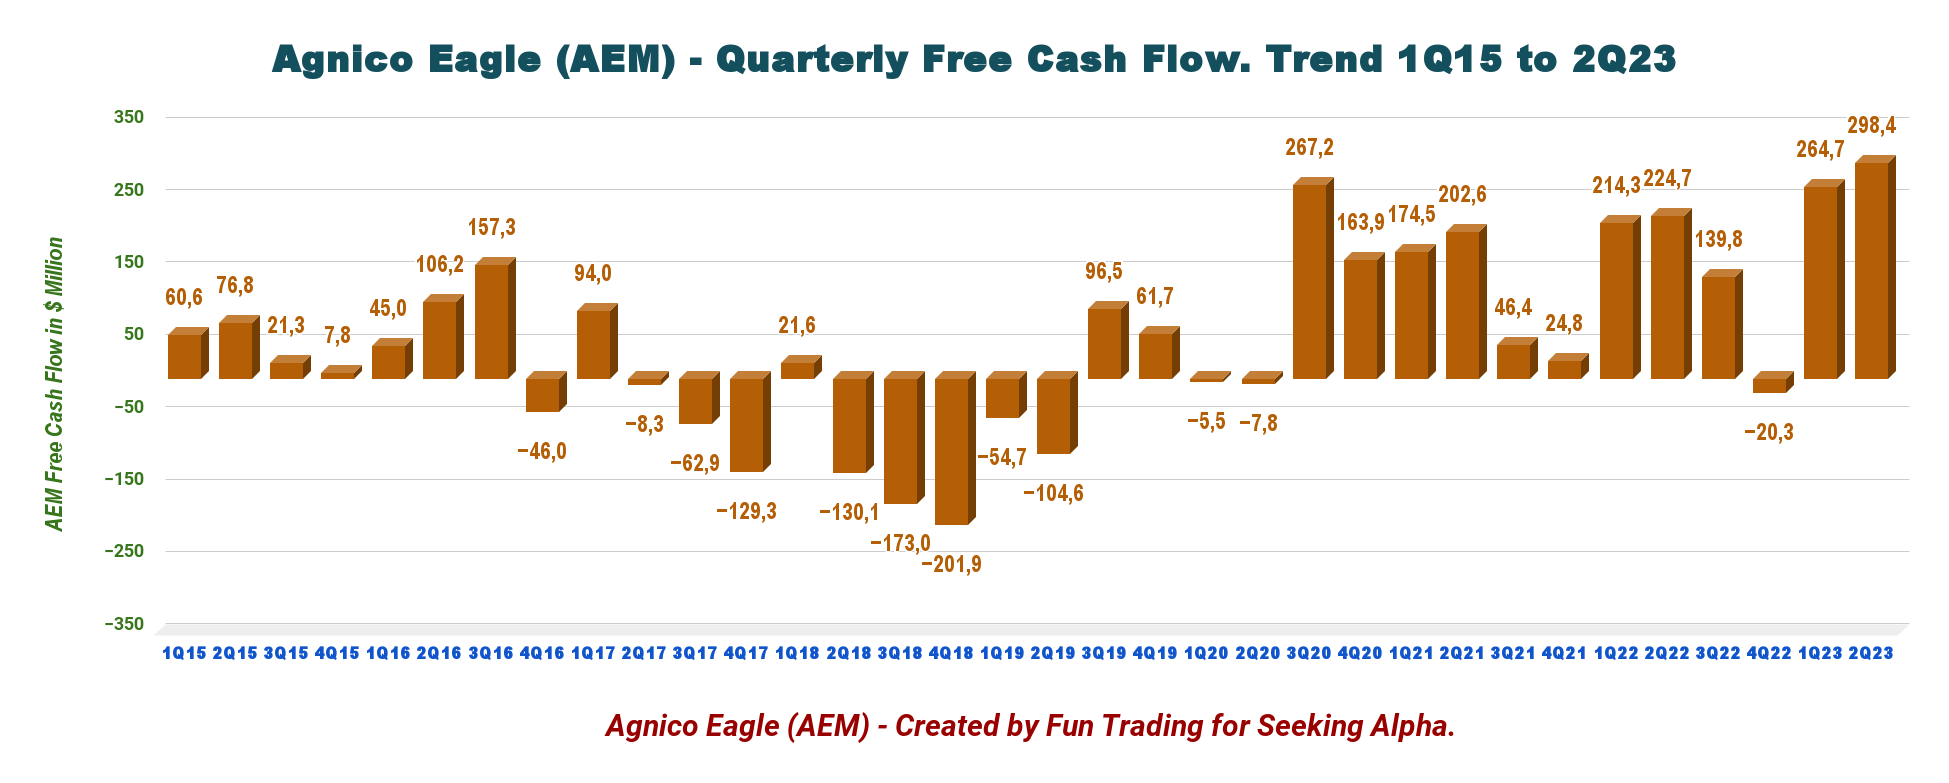
2 - Free Cash Flow was $298.38 Million in 2Q23
The trailing 12-month free cash flow ("FCF") is estimated at $682.51 million ("TTM"), and the free cash flow for 2Q23 was estimated at $298.38 million .
AEM Quarterly Free Cash Flow History (Fun Trading)
The Quarterly dividend declared is $0.40 per share .
3 - Net Debt was $1,500 Million in 2Q23
Agnico Eagle has solid financials with a net debt of $1,500.17 million , down QoQ.
AEM Quarterly Cash versus Debt History (Fun Trading)
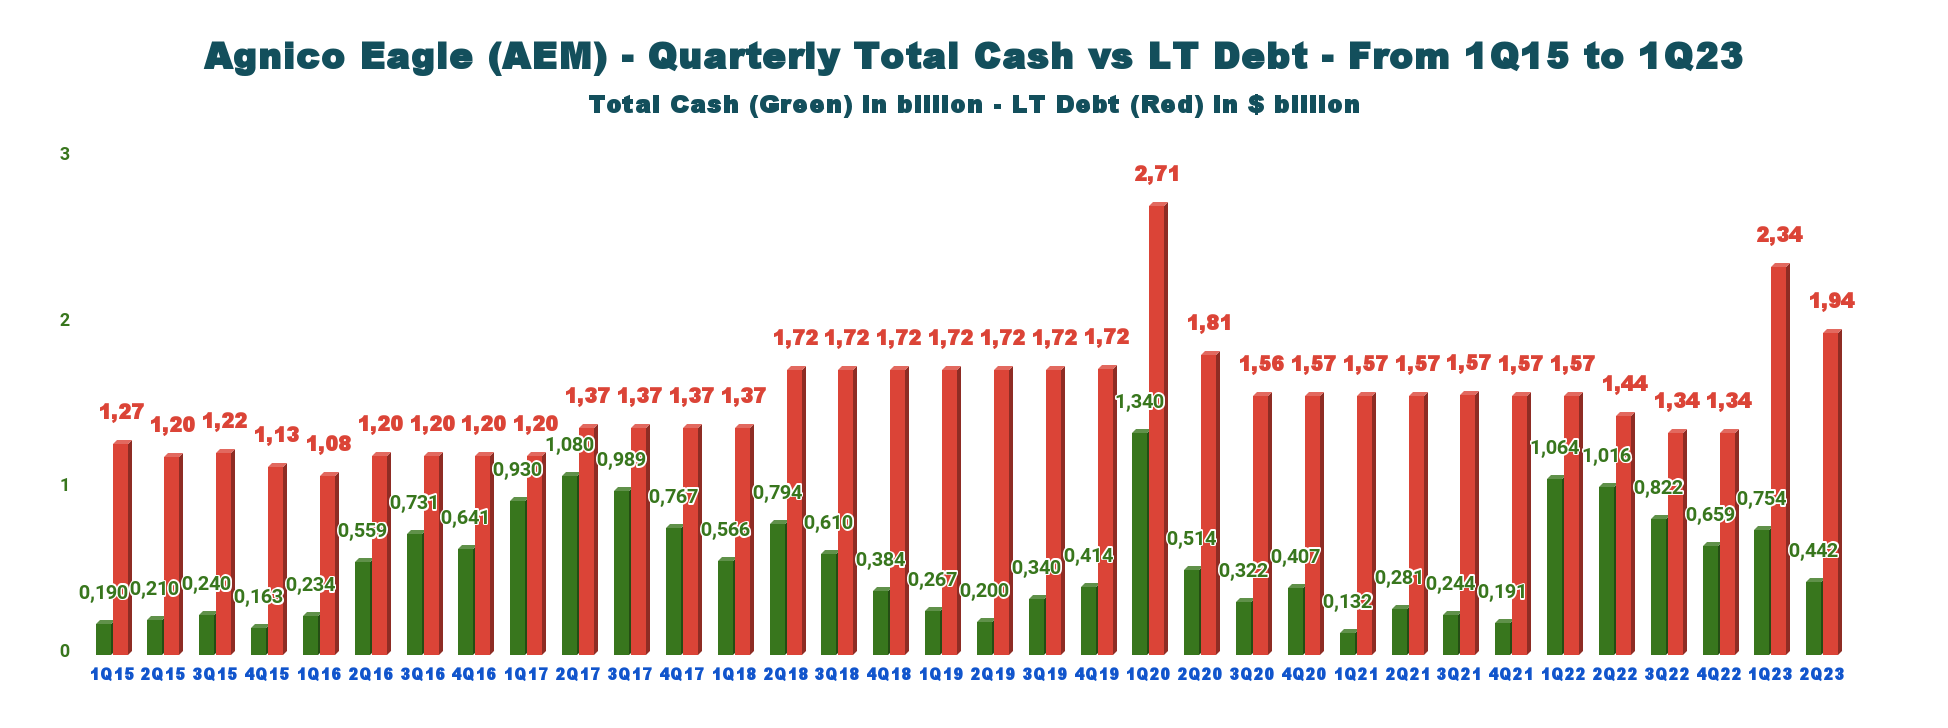
Agnico Eagle had total cash of $441.85 million in 2Q23 compared with $668.52 million as of December 31, 2022. Long-term debt dropped to $1,942.02 million (including current), compared with $1,342.07 million in 4Q22.
AEM has a strong liquidity of $1,533 million in 2Q23. The company repaid the credit line with a $600 million term loan and $300 million in cash.
AEM Balance Sheet (AEM Presentation)
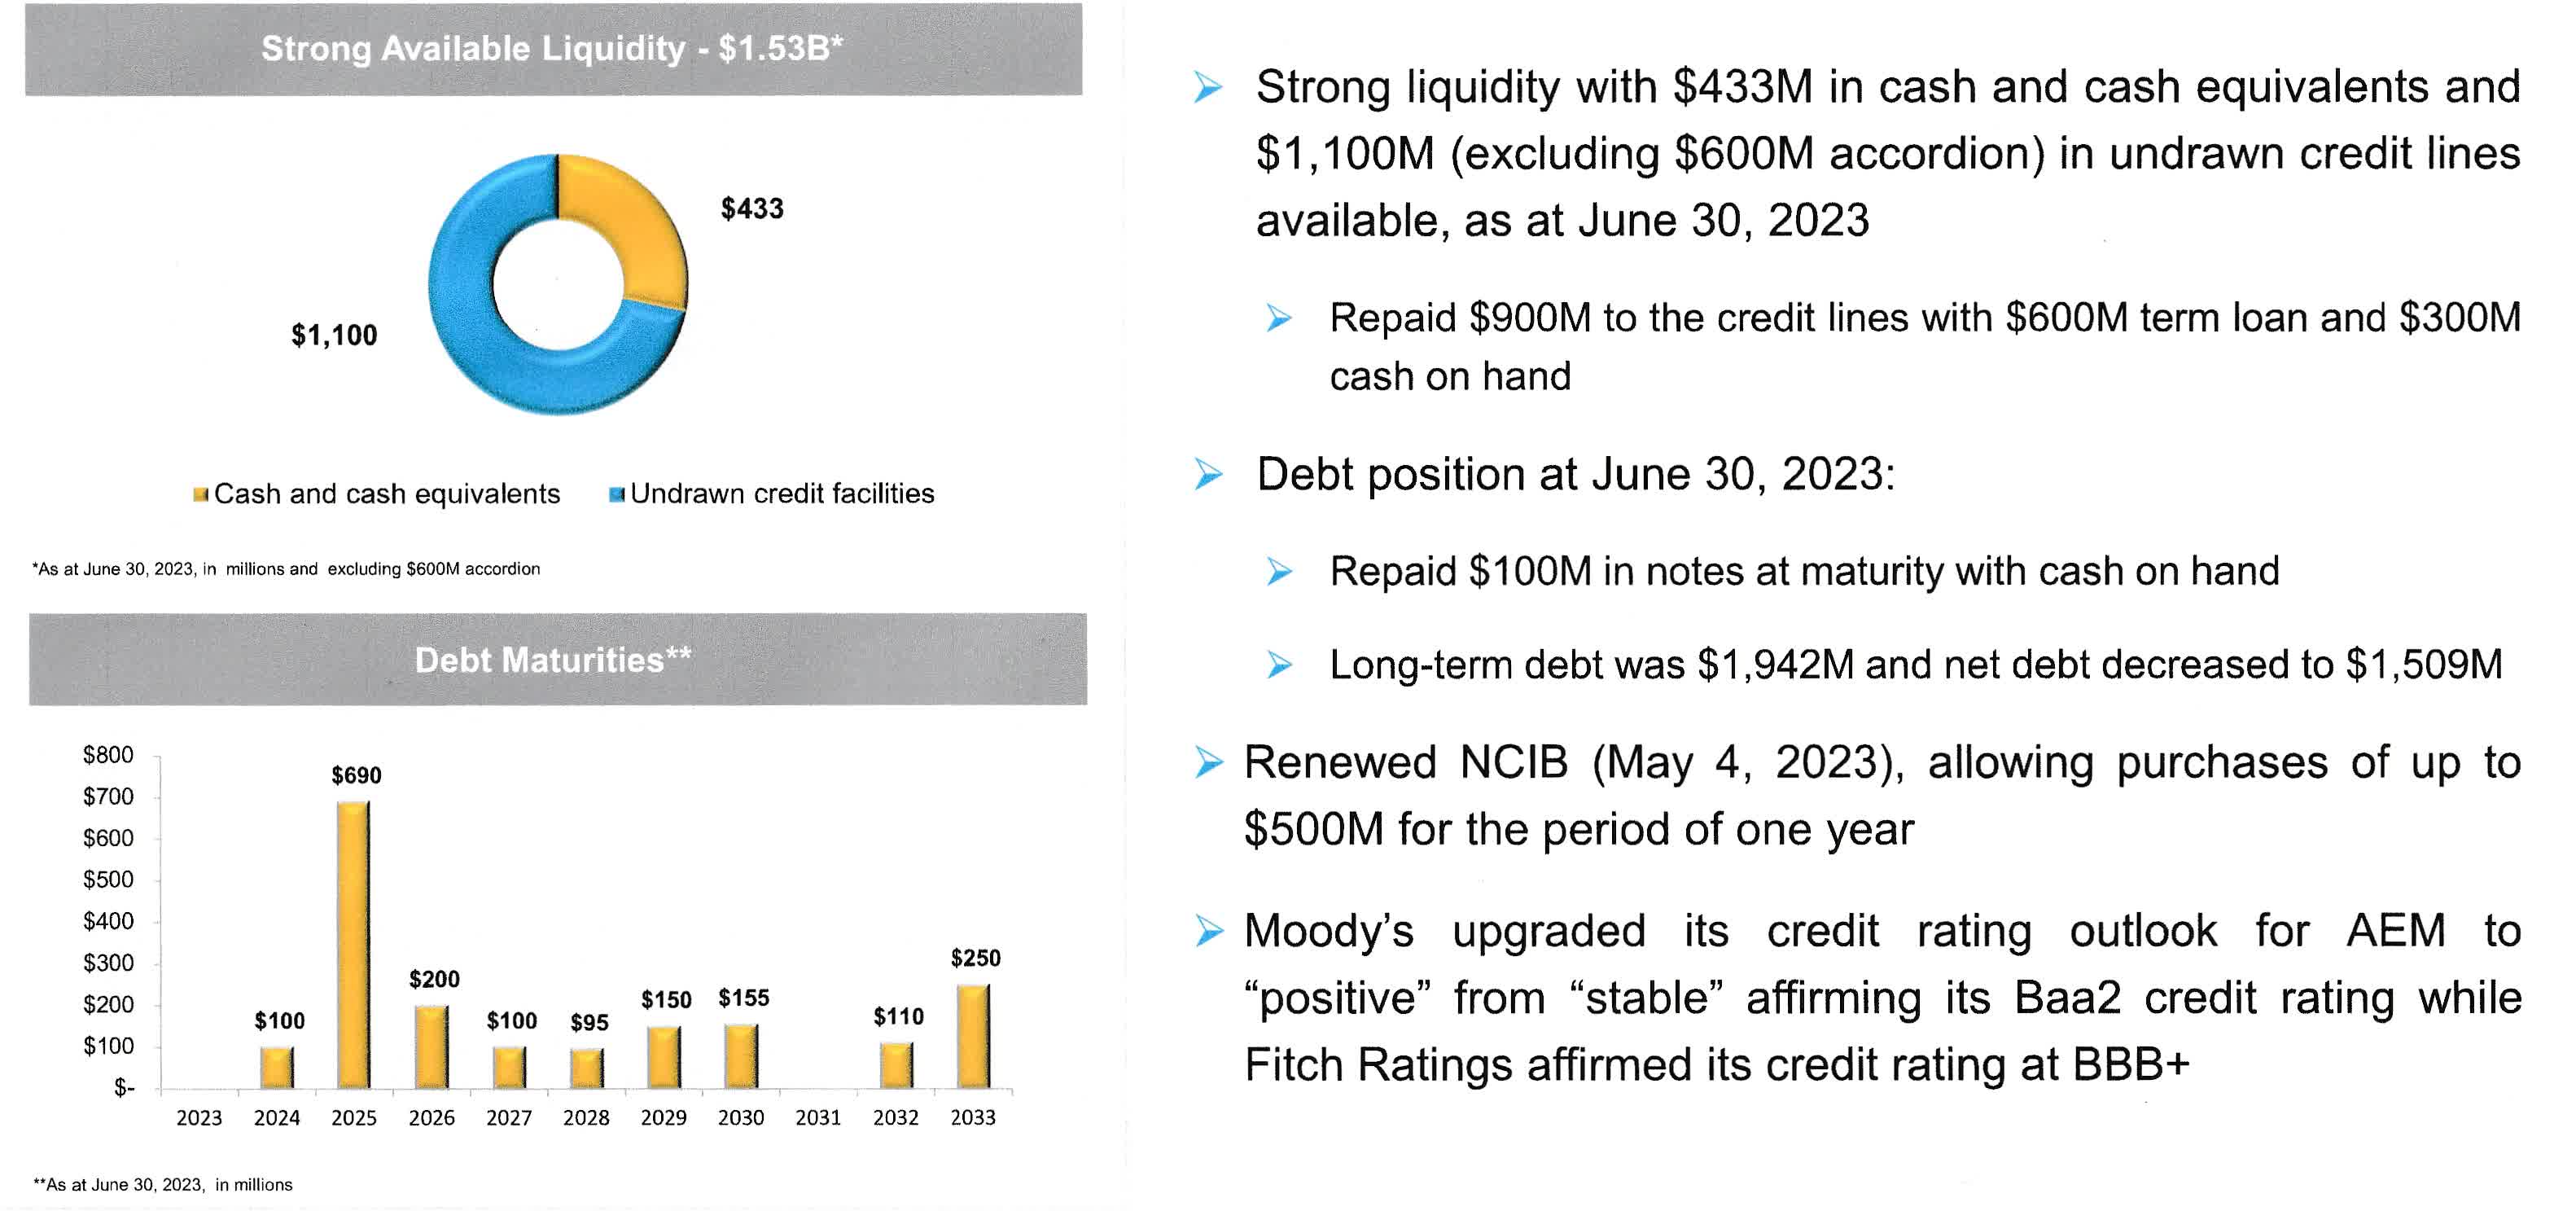
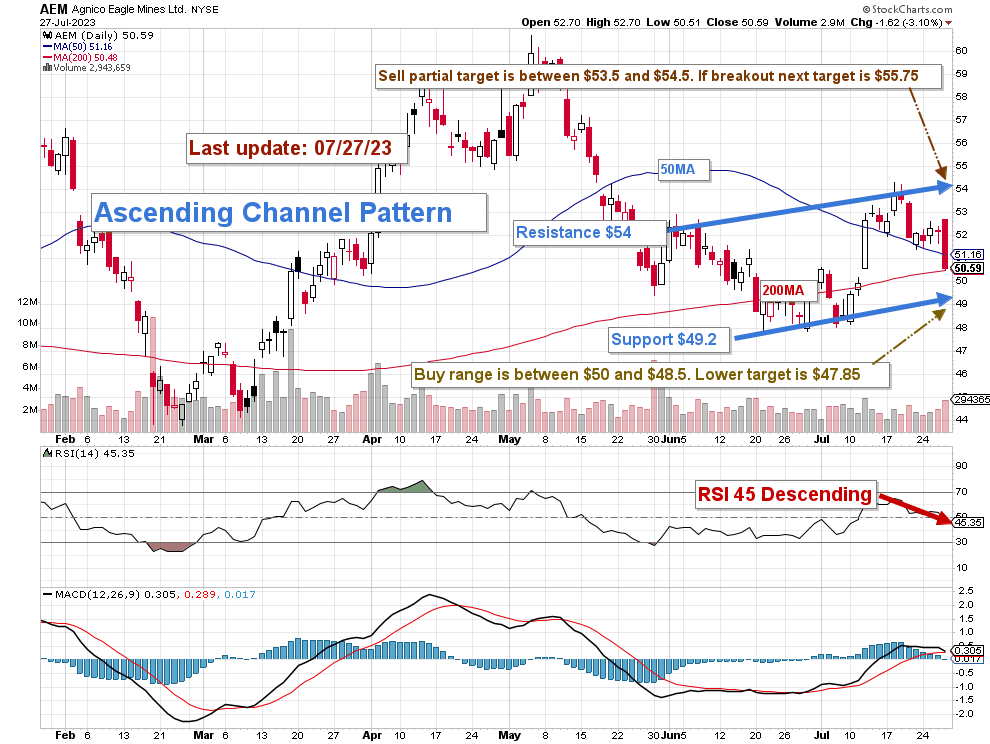
Part IV - Technical Analysis and Commentary
AEM TA Chart Short-Term (Fun Trading StockCharts)
Note: The chart has been adjusted for dividends.
AEM forms an ascending channel pattern with resistance at $54 and support at $49.2 . The RSI is now 45 descending, showing possible further downside ahead.
Ascending channel patterns or rising channels are short-term bullish in that a stock moves higher within an ascending channel, but these patterns often form within longer-term downtrends as continuation patterns. The ascending channel pattern is often followed by lower prices, but only after a downside penetration of the lower trend line. The stock will continue channeling upward until it is able to break either the upper or lower trend line.
The trading strategy I recommend is to sell Agnico Eagle Mines Limited shares about 40% between $53.5 and $54.5 with a potential upper resistance at $55.75 . Conversely, I recommend buying shares between $50 and $49.5 , with possible lower support at $47.85 . Starting accumulating at the 200MA is an option.
The gold price is now retracing a little due to the FED hiking interest by 25 points today.
However, allocating a sizeable portion of your investment in Agnico Eagle Mines is crucial to trade short-term LIFO and take advantage of the volatility.
Warning: The TA chart must be updated frequently to be relevant. It is what I am doing in my stock tracker. The chart above has a possible validity of about a week. Remember, the TA chart is a tool only to help you adopt the right strategy. It is not a way to foresee the future. No one and nothing can.
For further details see:
Agnico Eagle Mines: One Of The Best