SPY - AIEQ: Deep Learning ETF With 6 Red Flags
2023-11-22 16:53:37 ET
Summary
- AI Powered Equity ETF is an actively managed fund that uses deep learning technology.
- The fund is being reorganized and will be sold to Amplify ETFs.
- The AIEQ ETF has underperformed the S&P 500 Index and another AI-powered ETF, has high fees and turnover rate, and low liquidity.
AIEQ strategy
AI Powered Equity ETF ( AIEQ ) is an actively managed exchange-traded fund, or ETF, based on deep learning technology launched on 10/17/2017. “Deep learning” refers to a branch of artificial intelligence using neural networks to identify, extract and combine features in old data so as to make predictions with new data. The learning process involves multiple iterations of training and testing resulting in an operational predictive model. A model is typically defined by a graph of nodes and connections associated with parameters and organized in multiple layers.
Metaphorically, they can be considered as neurons and synapses of an artificial brain. The prediction process consists in feeding the model with new data to classify elements in different categories with associated probabilities. I don’t know the details of the model used by AIEQ, but it might predict that a given stock will have an alpha (or an excess return over a benchmark) between A and B with a probability P in a certain time interval.
It’s important to note that predictions are probabilistic. Models can be aggregated to build a higher-level model. The model used by AIEQ, named EquBot, is composed of four deep learning models respectively trained on financial, news/information, management and macro data. Therefore, it takes into account the different aspects of the market: fundamental, technical, sentiment and economy. A particularity of EquBot is its ability to make predictions on SPACs (Special Purpose Acquisitions Corporations). EquBot runs on IBM’s Watson AI platform.
As described in the prospectus,
Each day, the EquBot Model ranks each company based on the probability of the company benefiting from current economic conditions, trends, and world events and identifies approximately 30 to 200 companies with the greatest potential over the next twelve months for appreciation and their corresponding weights, targeting a maximum risk adjusted return versus the broader U.S. equity market.
The expense ratio of AIEQ is quite high (0.75%) and the portfolio turnover rate is sky-high (1708% in the most recent fiscal year).
Reorganization
The fund's managing company, ETF Managers Trust, will be selling its funds to Amplify ETF Trust. As reported in the prospectus:
The Board of Trustees of ETF Managers Trust (the “Trust”) has approved an Agreement and Plan of Reorganization (the “Agreement”) providing for the reorganization of the Target Funds into corresponding new funds (the “Acquiring Funds”), which are newly created series of Amplify ETF Trust with similar investment objectives and the same fees and expenses as the corresponding Target Funds.
The reorganization is imminent: “ If approved by the Target Fund’s shareholders, each Reorganization is expected to occur in the fourth quarter of 2023. ”
AIEQ will get a new prefix to its name and become Amplify AI Powered Equity ETF. The ticker and the strategy may stay the same, but nothing is sure until a new prospectus is issued.
AIEQ portfolio
The fund currently has 109 holdings and a trailing 12-month distribution yield of 1.21%. It is almost exclusively invested in U.S. companies (96% of asset value) in all size segments
AIEQ holding size breakdown (chart: author; data: Fidelity)
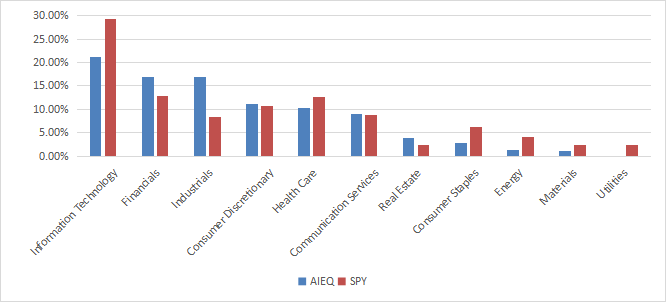
The sector breakdown is more balanced than in the S&P 500 (SP500), as plotted by the next chart. Technology remains the heaviest sector, with about 21% of asset value. Compared to the large cap benchmark, the fund underweights technology, consumer staples, energy, materials, and ignores utilities. It overweights mostly industrials and financials.
AIEQ sector breakdown (Chart: author; data: Fidelity, SSGA)
AIEQ is significantly cheaper than the S&P 500 index regarding the usual valuation ratios, as reported in the next table.
| AIEQ |
| SPY |
| Price / Earnings TTM |
| 16.69 |
| 20.79 |
| Price / Book |
| 2.44 |
| 3.69 |
| Price / Sales |
| 1.44 |
| 2.38 |
| Price / Cash Flow |
| 10.52 |
| 14.73 |
Source: Fidelity.
The top 10 holdings, listed in the next table, represent 39% of asset value. The top names are close to 5%. Risks related to individual companies are moderate.
| Ticker |
| Name |
| Weight |
| EPS growth% |
| P/E ttm |
| P/E fwd |
| Yield% |
| Coherent Corp. |
| 5.53% |
| -877.43 |
| N/A |
| 26.51 |
| 0 |
| Visa, Inc. |
| 5.00% |
| 19.04 |
| 30.94 |
| 25.50 |
| 0.82 |
| Honeywell International, Inc. |
| 4.91% |
| 3.18 |
| 23.71 |
| 20.88 |
| 2.26 |
| Lockheed Martin Corp. |
| 4.61% |
| 25.69 |
| 16.38 |
| 16.45 |
| 2.81 |
| RTX Corp. |
| 4.39% |
| -28.04 |
| 36.27 |
| 15.61 |
| 3.02 |
| Electronic Arts, Inc. |
| 3.91% |
| 13.07 |
| 37.54 |
| 19.06 |
| 0.56 |
| Laboratory Corp. of America Holdings |
| 3.12% |
| -60.10 |
| 28.40 |
| 15.62 |
| 1.36 |
| Arista Networks, Inc. |
| 2.83% |
| 63.70 |
| 35.83 |
| 32.89 |
| 0 |
| Seagate Technology Holdings plc |
| 2.60% |
| -168.93 |
| N/A |
| 256.92 |
| 3.68 |
| Whirlpool Corp. |
| 2.12% |
| -576.34 |
| N/A |
| 6.82 |
| 6.44 |
Ratios: Portfolio123.
AIEQ Performance
As reported in the next table, AI Powered Equity ETF has underperformed the S&P 500 by about 67% in total return since inception (7.5% in annualized return). Moreover, the maximum drawdown and volatility (measured as the standard deviation of monthly returns) point to a significantly higher risk.
The Sharpe ratio shows that the objective of “ maximum risk-adjusted return versus the broader U.S. equity market ” is clearly missed.
| Total Return |
| Annual.Return |
| Drawdown |
| Sharpe ratio |
| Volatility |
| AIEQ |
| 27.93% |
| 4.14% |
| -38.97% |
| 0.17 |
| 23.72% |
| SPY |
| 95.56% |
| 11.67% |
| -33.72% |
| 0.54 |
| 17.78% |
Data calculated with Portfolio123.
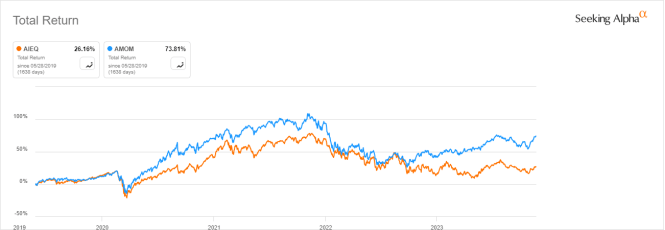
The next chart compares total returns of AIEQ and another AI-powered ETF: QRAFT AI-Enhanced U.S. Large Cap Momentum ETF ( AMOM ). The starting date is 5/27/2019 to match inception dates.
AIEQ vs AMOM since 2019 (Seeking Alpha)
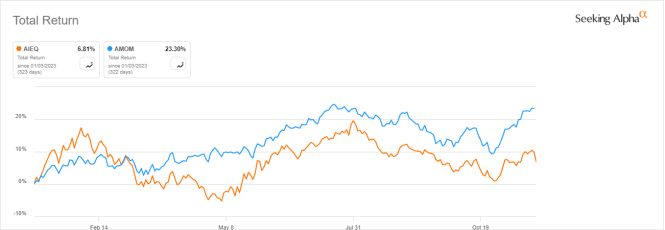
AIEQ has underperformed its competitor AMOM by a wide margin since 2019, and especially in 2023 to date:
AIEQ vs AMOM, year-to-date (Seeking Alpha)
Takeaway
AI Powered Equity ETF ( AIEQ ) is an actively managed ETF using deep learning to select stocks that are likely to outperform the market and provide a superior risk-adjusted return. A closer look shows six red flags:
- The fund has missed its objective since inception, lagging the S&P 500 and showing a higher volatility.
- It has also lagged another AI-powered ETF.
- The turnover rate is extremely high.
- The expense ratio is high.
- Liquidity is low.
- Some uncertainty remains about the reorganization under a new management.
For further details see:
AIEQ: Deep Learning ETF With 6 Red Flags