CA - Alamos Gold: A Solid Quarter Again
2023-07-31 15:38:51 ET
Summary
- Alamos Gold Inc. indicated a net income of $75.1 million, or $0.19 per share, up from $6.4 million, or $0.02 per share, in 2Q22.
- Alamos Gold produced 136K Au ounces in 2Q23 and sold 131,952 Au ounces at $1,978 per ounce. It was a solid production, up 30.9% YoY, exceeding quarterly guidance.
- I recommend buying Alamos Gold shares between $11.85 and $11.60, with possible lower support at $11.
Introduction
The Toronto-based Alamos Gold Inc. ( AGI ) released its second-quarter results on July 26, 2023.
Note: This article updates my article published on May 2, 2023. I have followed AGI on Seeking Alpha since August 2017.
President & CEO John McCluskey said in the conference call:
We delivered an outstanding performance in the second quarter, achieving a number of operational and financial records. Production increased to a record 136,000 ounces, exceeding our guidance for the quarter while all-in sustaining costs decreased below our annual guidance.
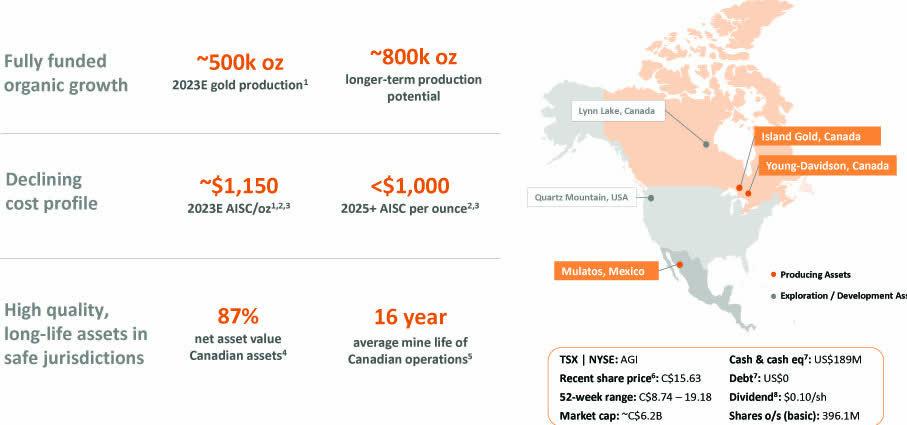
Alamos Gold owns three producing mines and two projects.
AGI Assets Presentation (AGI Presentation)
1 - 2Q23 Results Snapshot
The company posted record revenues of $261.0 million in 2Q23 and a net income of $75.1 million , or $0.19 per diluted share. Revenues were up a whopping 36.5% from 2Q22.
AGI pays a quarterly dividend of $0.025 per share (annualized rate of $0.10, or a yield of 0.8%).
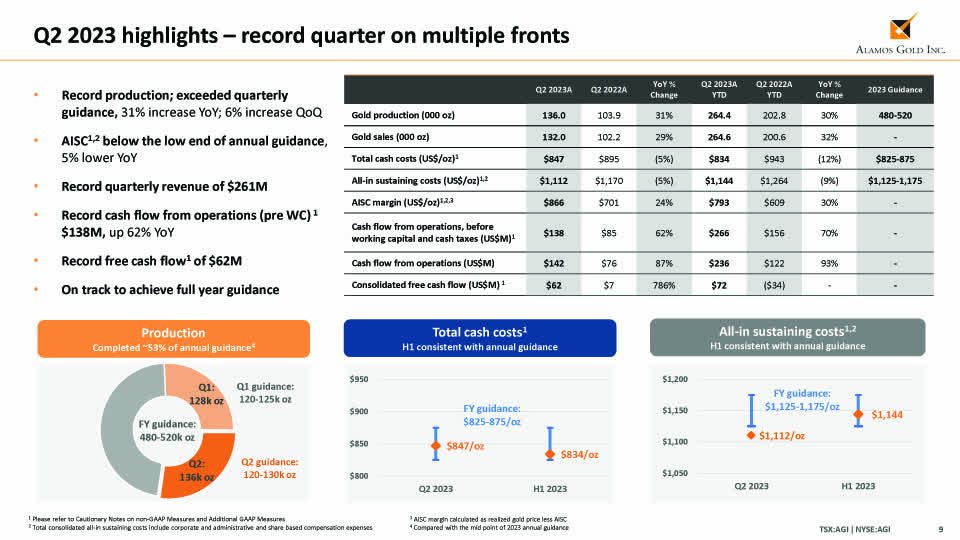
AGI produced 136K Au ounces in 2Q23 and sold 131,952 Au ounces at $1,978 per ounce. It was a solid production, up 30.9% YoY, exceeding quarterly guidance, driven by a significant increase in output from the Mulatos District. AGI is on track to achieve 2023 Guidance of 480K-520K Au ounce at an AISC between $1,125-$1,165 per ounce .
Below is shown the 2Q23 highlights and 2023 Guidance:
AGI 2Q23 Highlights (AGI August Presentation)
The increase was explained by a solid performance at Mulatos district, slightly offset by Island Gold. President & CEO John McCluskey said in the conference call:
This was driven by another exceptional performance from La Yaqui Grande, which contributed to the strongest quarter from Mulatos district in more than a decade. With production totaling 264,000 ounces through the first half of the year and costs well within guidance
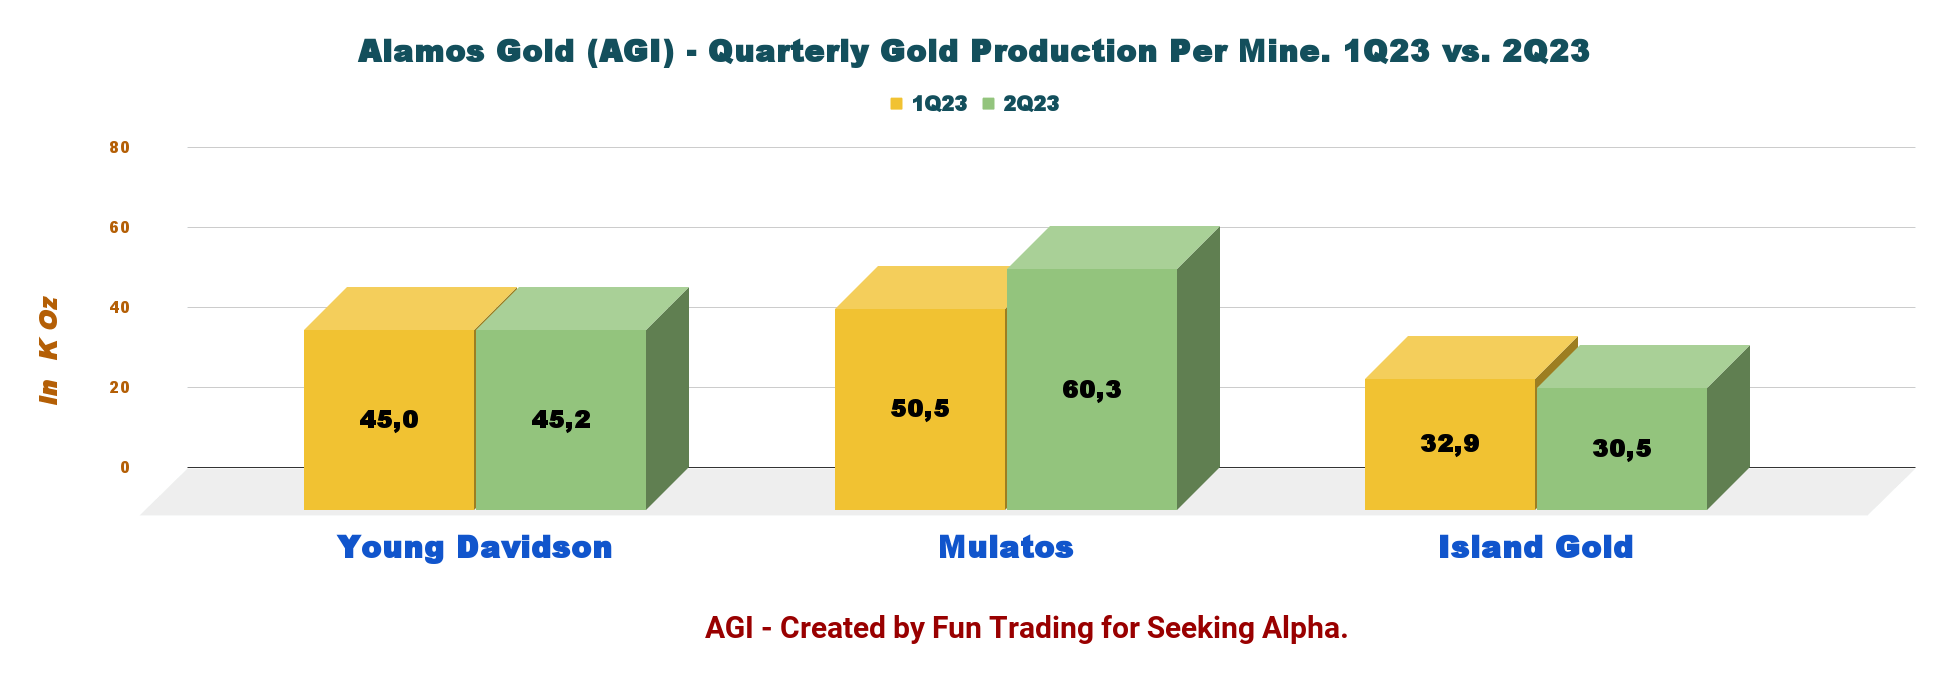
AGI Quarterly Production comparison 1Q23 versus 2Q23 (Fun Trading)
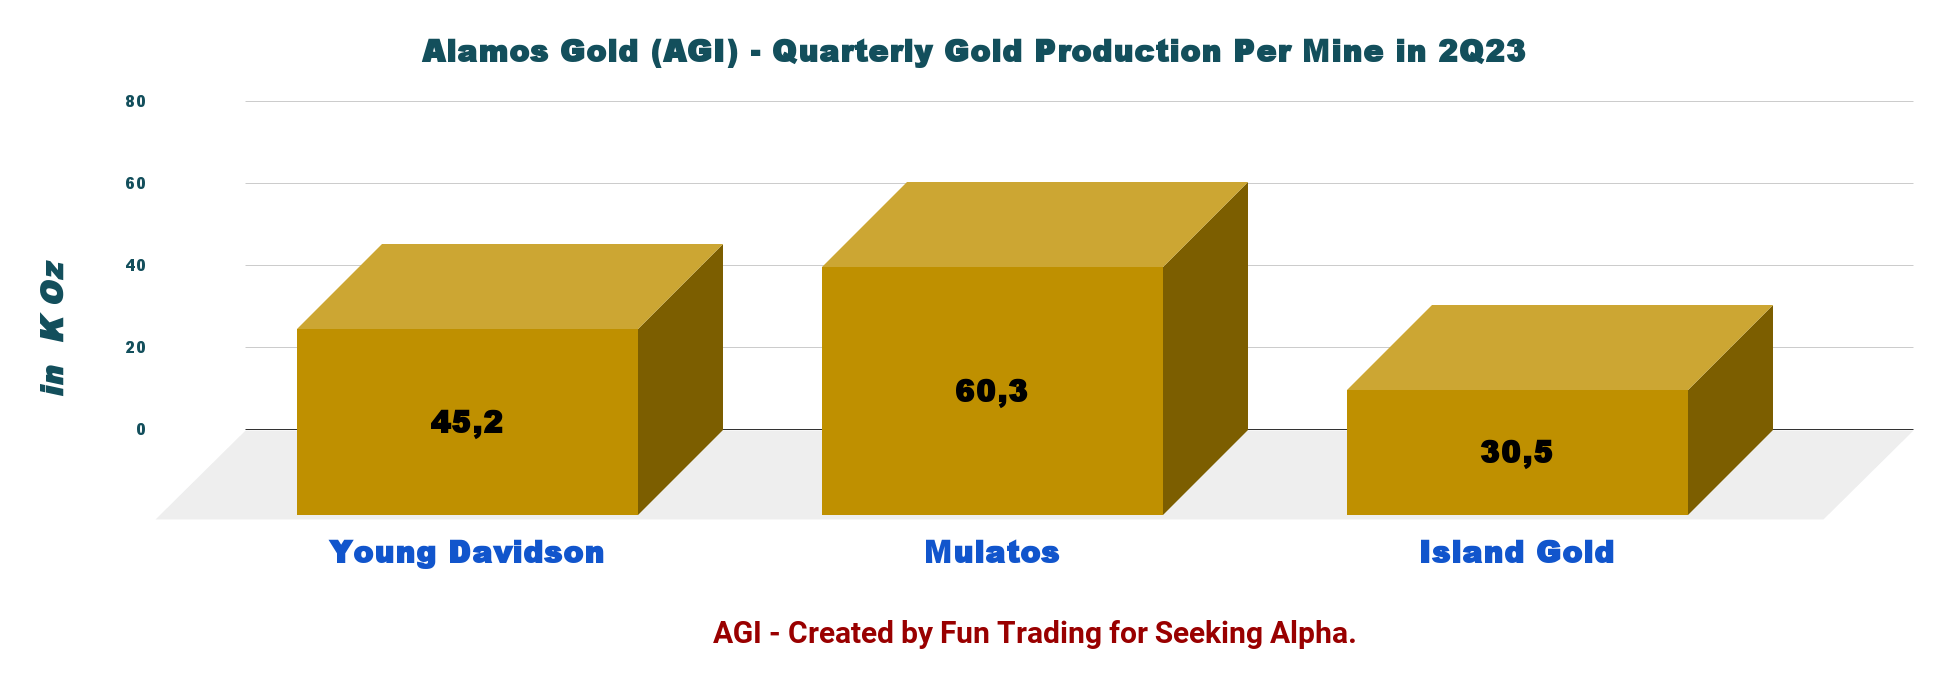
The Mulatos District produced 60,300 ounces, a 19% increase from the first quarter of 2023 and the highest level in 10 years, reflecting another solid quarter from La Yaqui Grande (Press release).
2 - Stock Performance
AGI is outperforming the VanEck Vectors Gold Miners ETF ( GDX ) and is now up 54% on a one-year basis.
3 - Investment Thesis
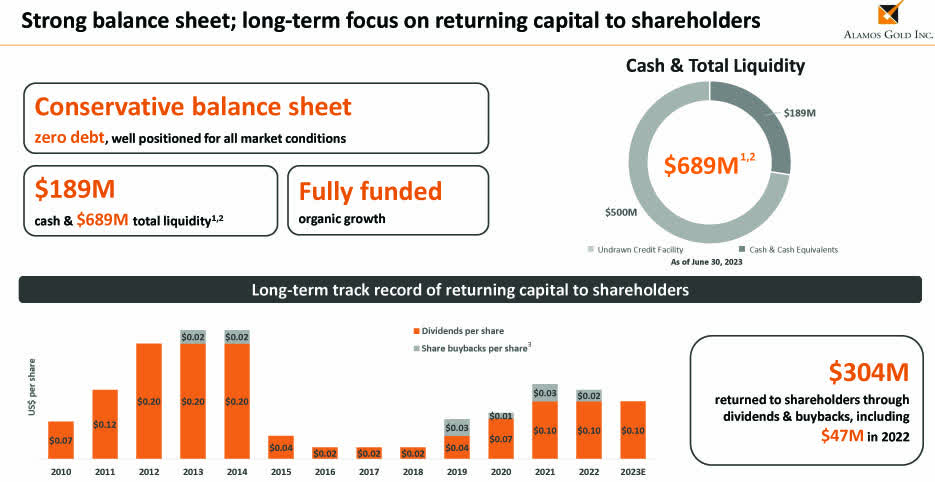
Alamos Gold Inc. is an outstanding company with excellent financials, no debt, and solid cash, paying a small quarterly dividend of $0.025. One crucial positive is that the growth is fully funded.
AGI Growth fully funded (AGI Presentation)
Offering significant growth potential with, among others, the Island Gold Phase 3+ Expansion to 2,400 tpd.
AGI Growth Potential (AGI Presentation)
In my preceding article, I said that the only sensible topic was attached to the gold price fluctuation. However, the most urgent concern for investors has been replaced by a valuation matter I indicated in my preceding article.
AGI is a small gold producer with limited producing mines. This situation could elevate the risk of a sudden stock correction due to an unplanned hiccup.
AGI 1-Year Chart Gold, Silver, Copper (Fun Trading StockCharts)
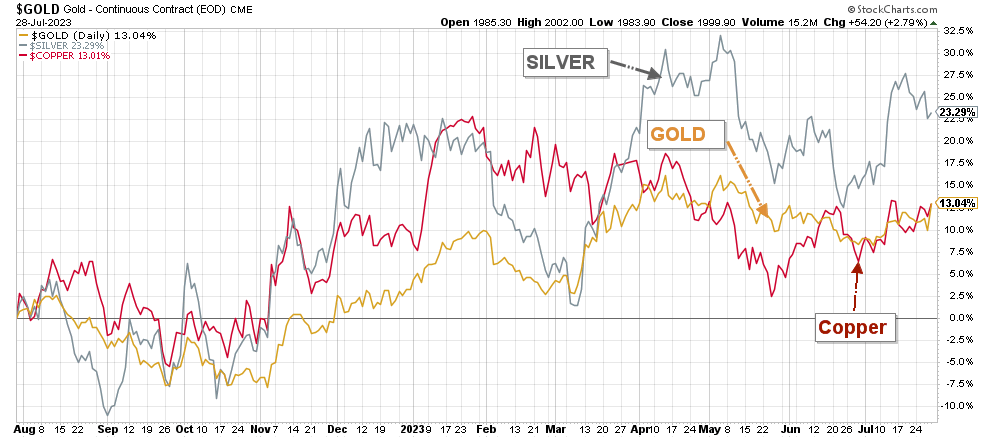
Thus, trading AGI short-term LIFO using at least 40% of your entire position is crucial, while keeping a core long-term for a much higher target. The method is based on technical analysis and fundamental knowledge.
This two-level strategy has succeeded in my marketplace, "The Gold And Oil Corner," and I believe it is the safer way to play AGI.
Alamos Gold - Financial Snapshot 2Q23 - The Raw Numbers
| Alamos Gold |
| 2Q22 |
| 3Q22 |
| 4Q22 |
| 1Q23 |
| 2Q23 |
| Total Revenues $ million |
| 191.2 |
| 213.6 |
| 231.9 |
| 251.5 |
| 261.0 |
| Quarterly Earnings in $ million |
| 6.4 |
| -1.4 |
| 40.6 |
| 48.4 |
| 75.1 |
| EBITDA $ million |
| 69.7 |
| 84.8 |
| 100.4 |
| 119.9 |
| 138.9 |
| EPS (diluted) $ per share |
| 0.02 |
| 0.00 |
| 0.10 |
| 0.12 |
| 0.19 |
| Cash from Operating Activities $ million |
| 75.7 |
| 74.0 |
| 102.3 |
| 94.3 |
| 141.8 |
| CapEx in $ |
| 69.0 |
| 72.6 |
| 84.8 |
| 83.8 |
| 80.2 |
| Free Cash Flow |
| 6.7 |
| 1.4 |
| 17.5 |
| 10.5 |
| 61.6 |
| Total Cash $ million |
| 144.0 |
| 132.0 |
| 148.4 |
| 159.6 |
| 208.3 |
| Total LT Debt in $ million |
| 0 |
| 0 |
| 0 |
| 0 |
| 0 |
| Dividend $/share (semi-annual) |
| 0.025 |
| 0.025 |
| 0.025 |
| 0.025 |
| 0.025 |
| Shares Outstanding |
| 394.5 |
| 391.8 |
| 395.82 |
| 396.95 |
| 395.35 |
Source: Company press release .
Alamos Gold Financial Analysis
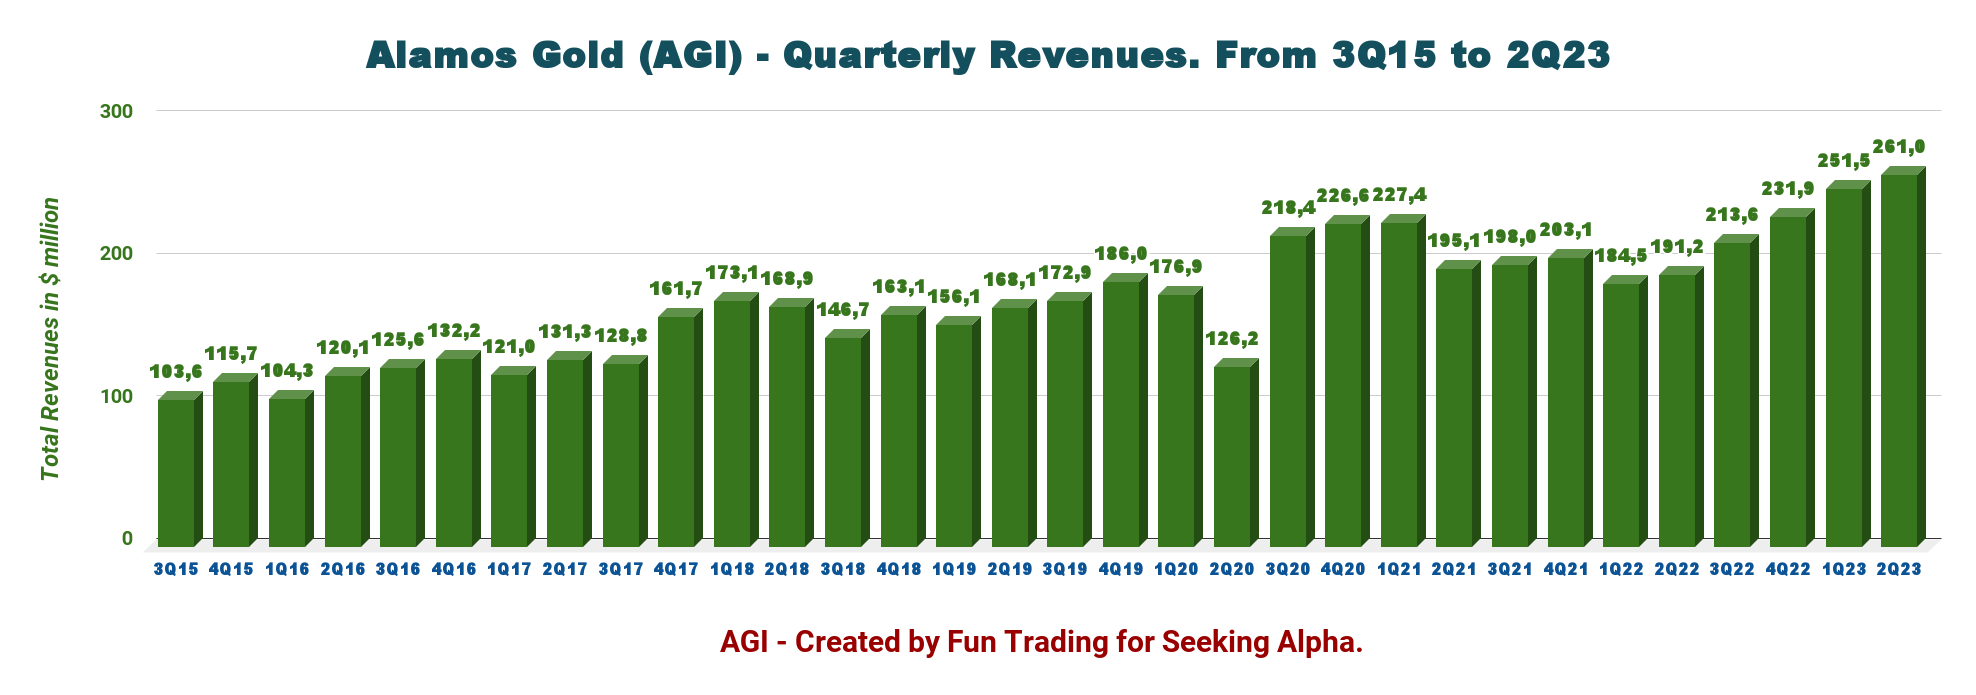
1 - Revenues were $261.0 million in the second quarter of 2023
AGI Quarterly Revenue History (Fun Trading)
The company indicated a net income of $75.1 million , or $0.19 per share, up from $6.4 million, or $0.02 per share, in 2Q22.
AGI generated a record cash flow from operating activities of $141.8 million .
The cost of sales per ounce sold was $1,196 in the second quarter.
Total cash costs of $847 per ounce were in line with annual guidance, and all-in-sustaining costs were $1,112 per ounce below the low end of the Guidance range.
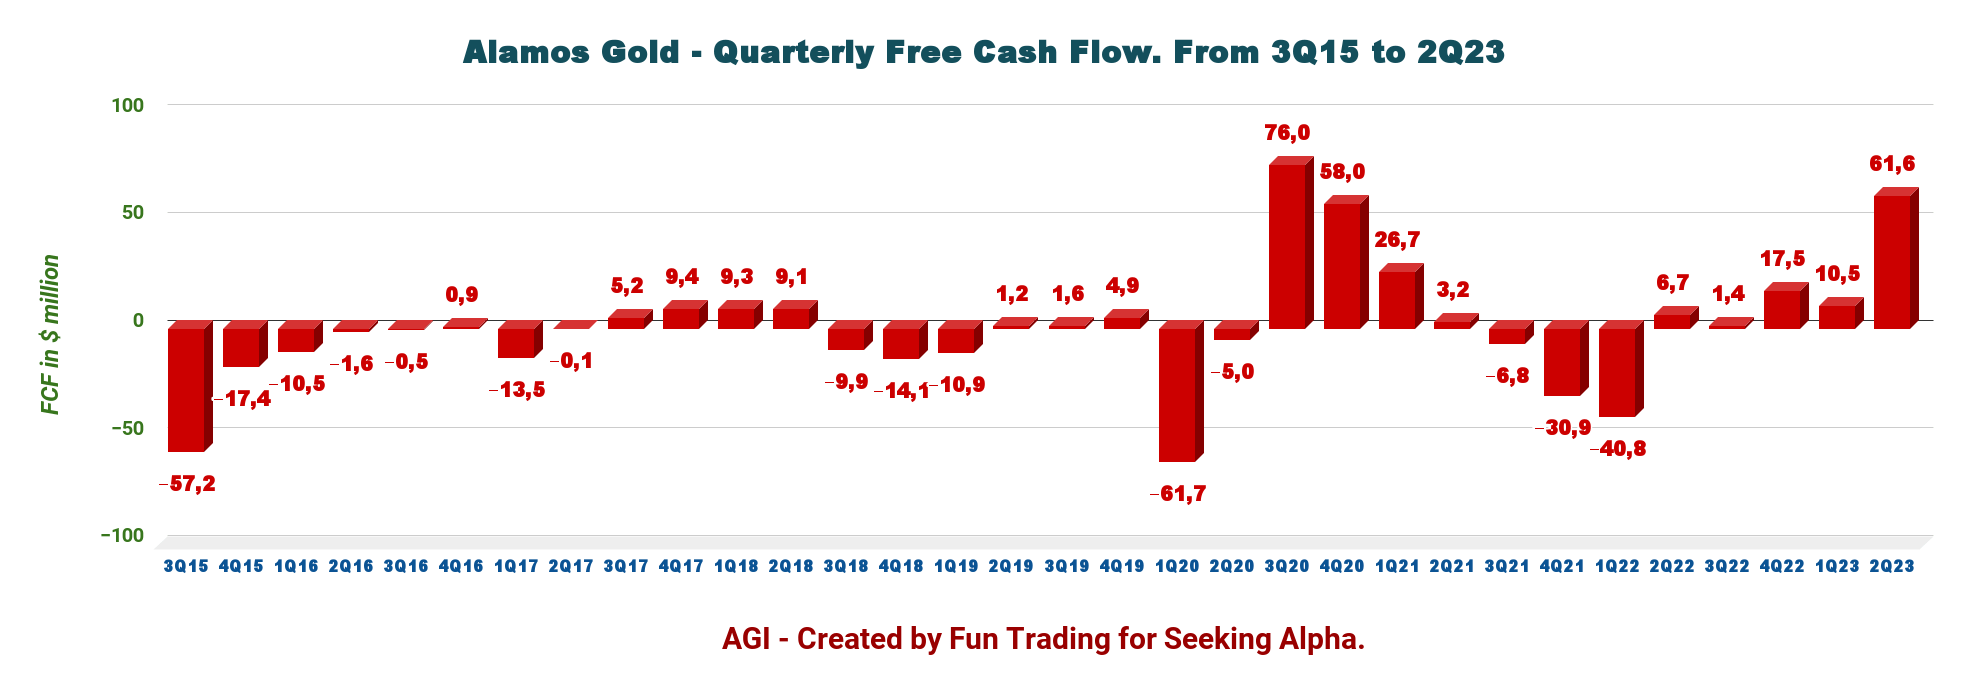
2 - Free cash flow was $61.6 million in 2Q23
AGI Quarterly Free Cash Flow History (Fun Trading)
Trailing 12-month free cash flow ("FCF") was $91.0 million , and the company posted an FCF of $61.6 million in 2Q23.
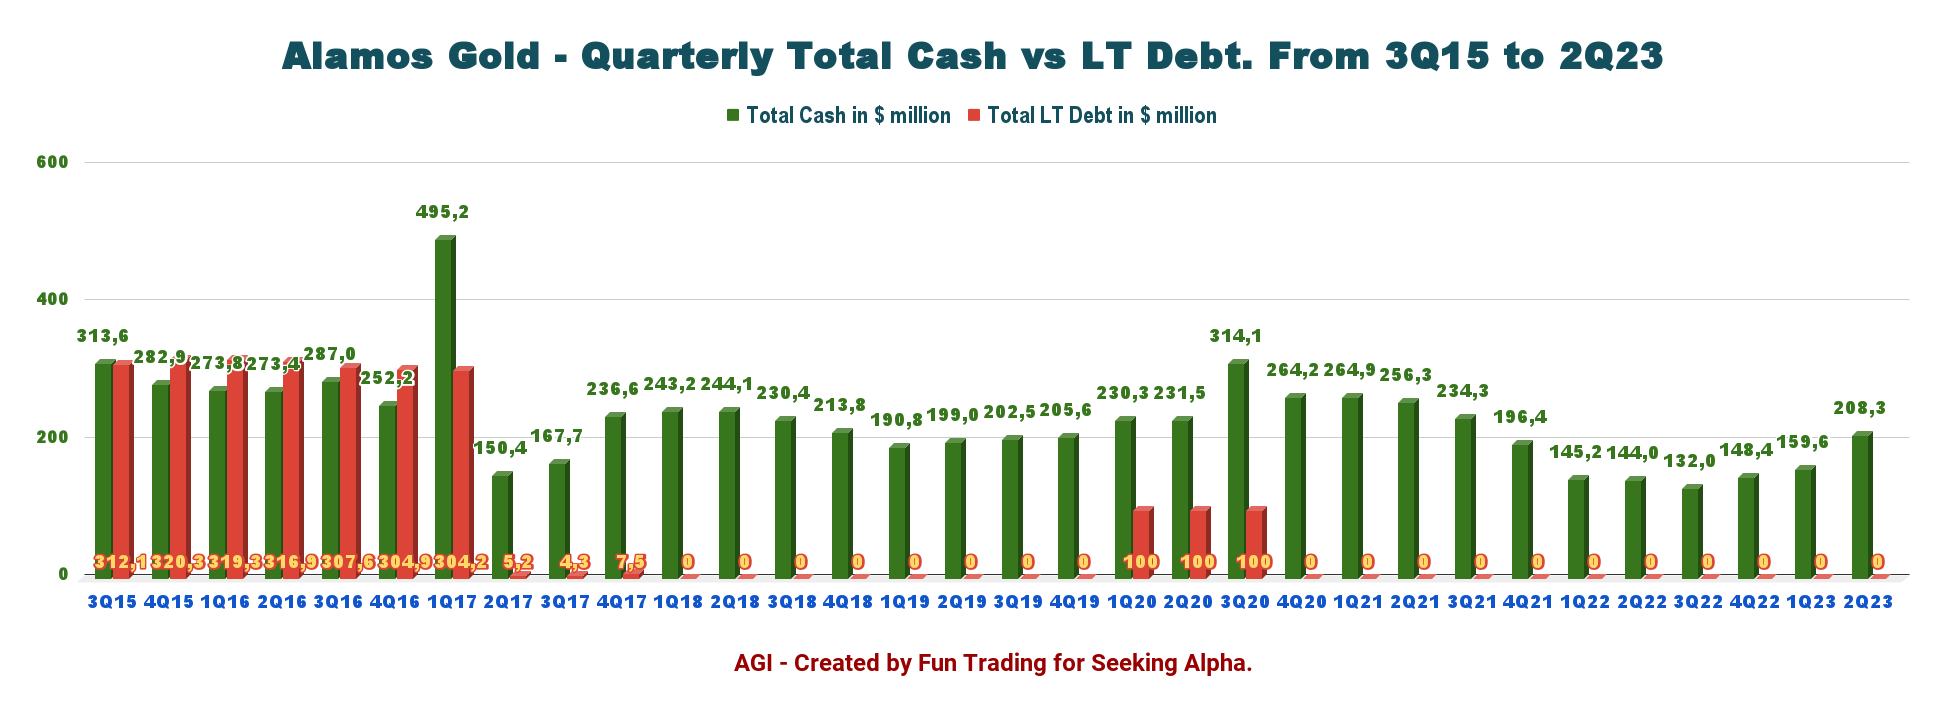
3 - The company is debt-free (net cash) and had total cash of $208.3 million in 2Q23.
AGI Quarterly Cash versus Debt History (Fun Trading)
Alamos Gold ended the second quarter with cash and cash equivalents of $208.3 million and no debt . Liquidity is $689 million .
AGI Balance Sheet details (AGI Presentation)
The only disappointment is the low dividend paid, which is less than 1% and could easily be increased to $0.05 per share, in my opinion.
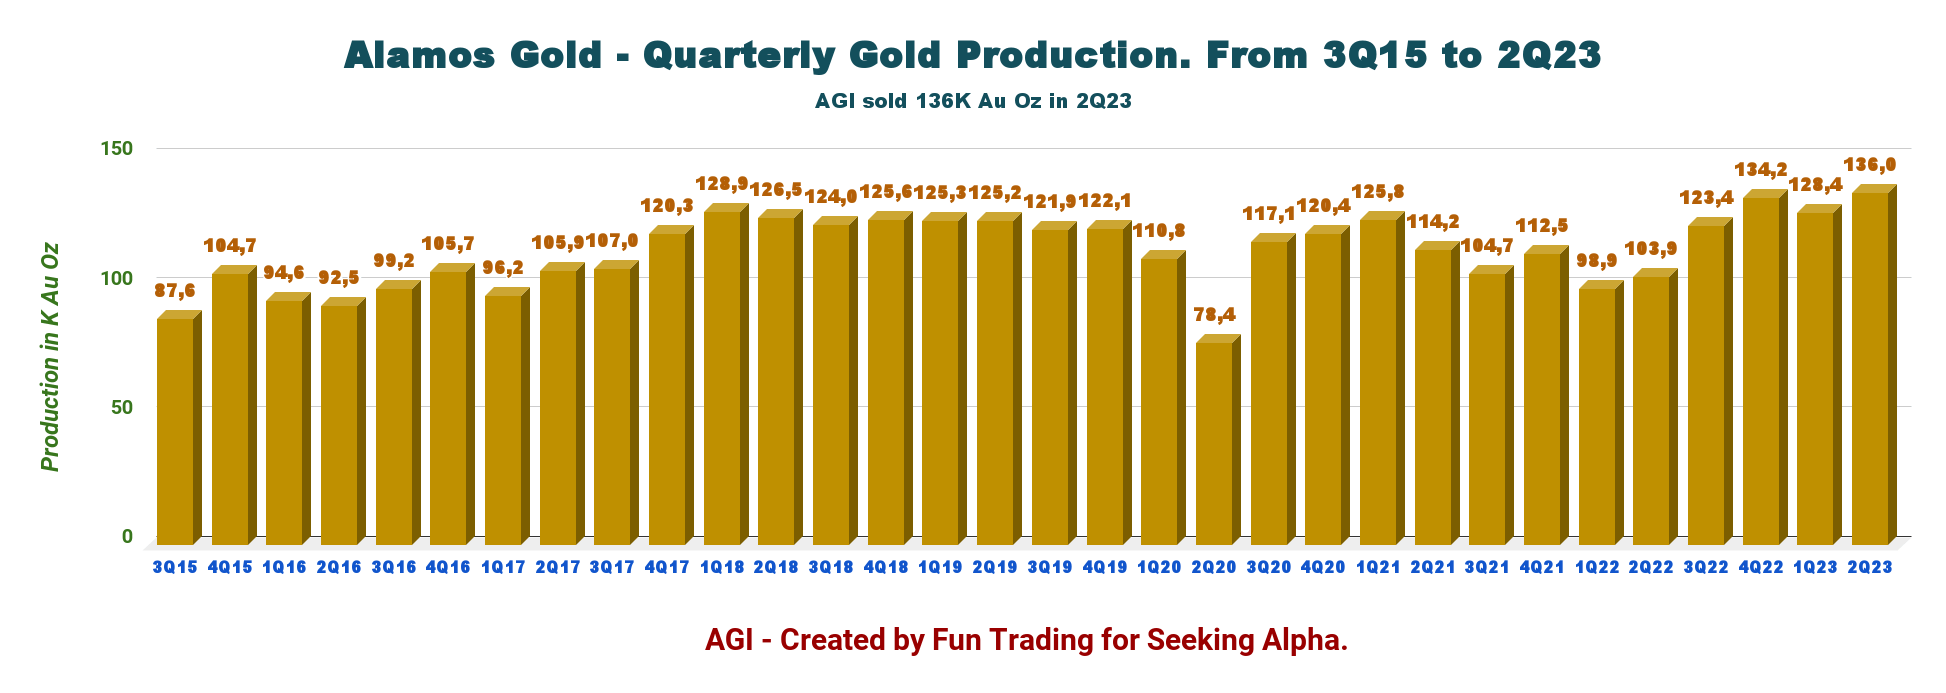
4 - Total quarterly production in 2Q23 was 136.0K Au ounces, and sold 131,952 Au ounces
AGI Quarterly Production History (Fun Trading)
Alamos Gold reported a gold production of 136,000 Au ounces in 2Q23 and sold 131,952 Au ounces .
It was a 6% increase from the first quarter of 2023 due to strong production growth from the Mulatos District.
Below is the 2Q22 production per mine:
AGI 2Q23 Production per Mine (Fun Trading)
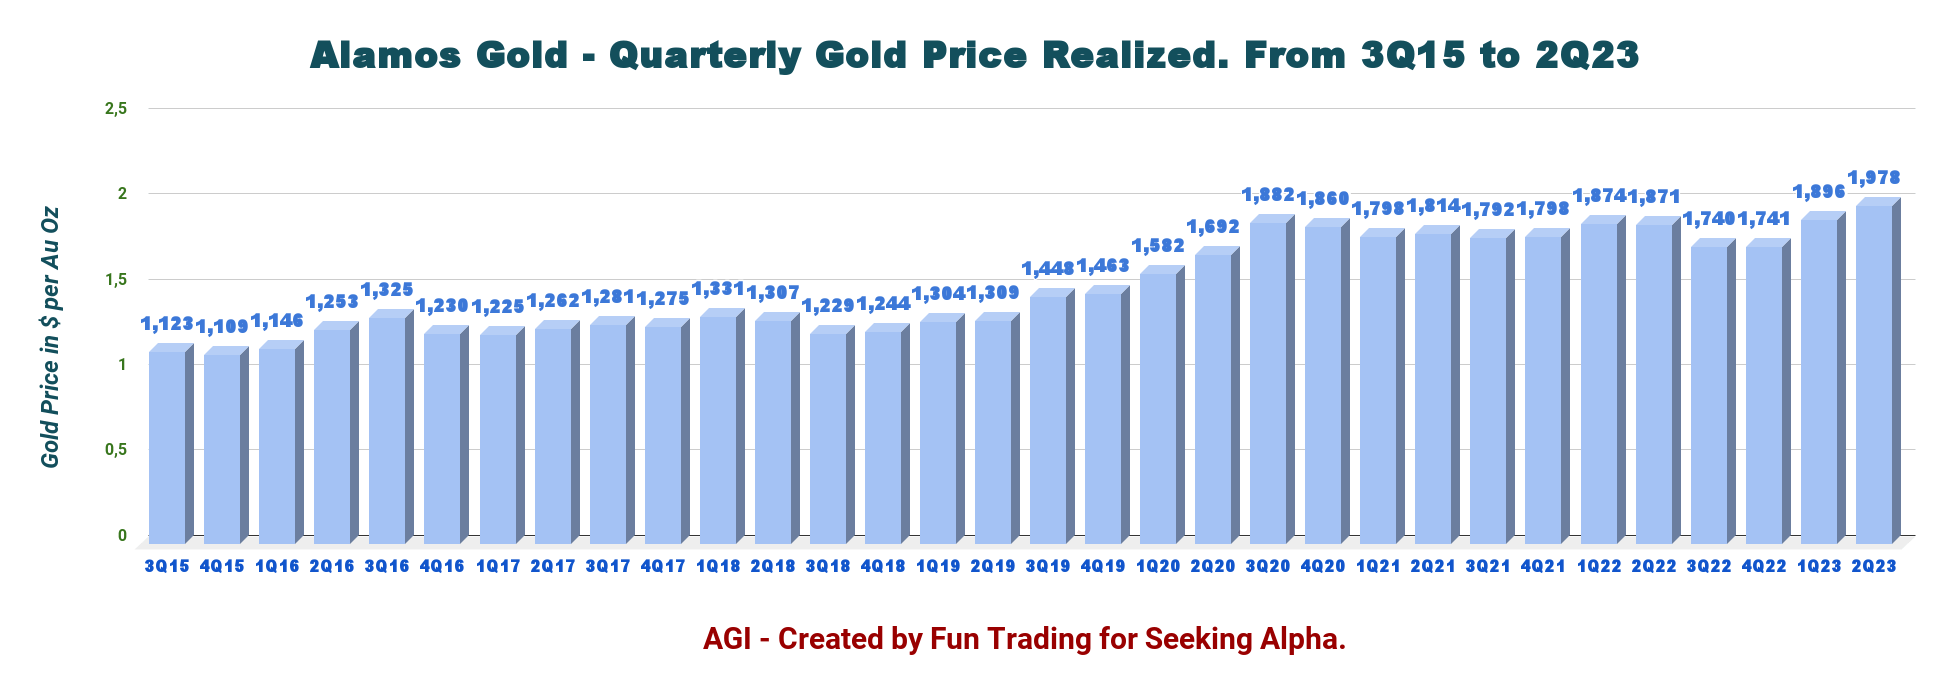
The price of gold realized for the second quarter was a record of $1,978 per ounce , up 4.3% sequentially.
AGI Quarterly Gold Price Realized History (Fun Trading)
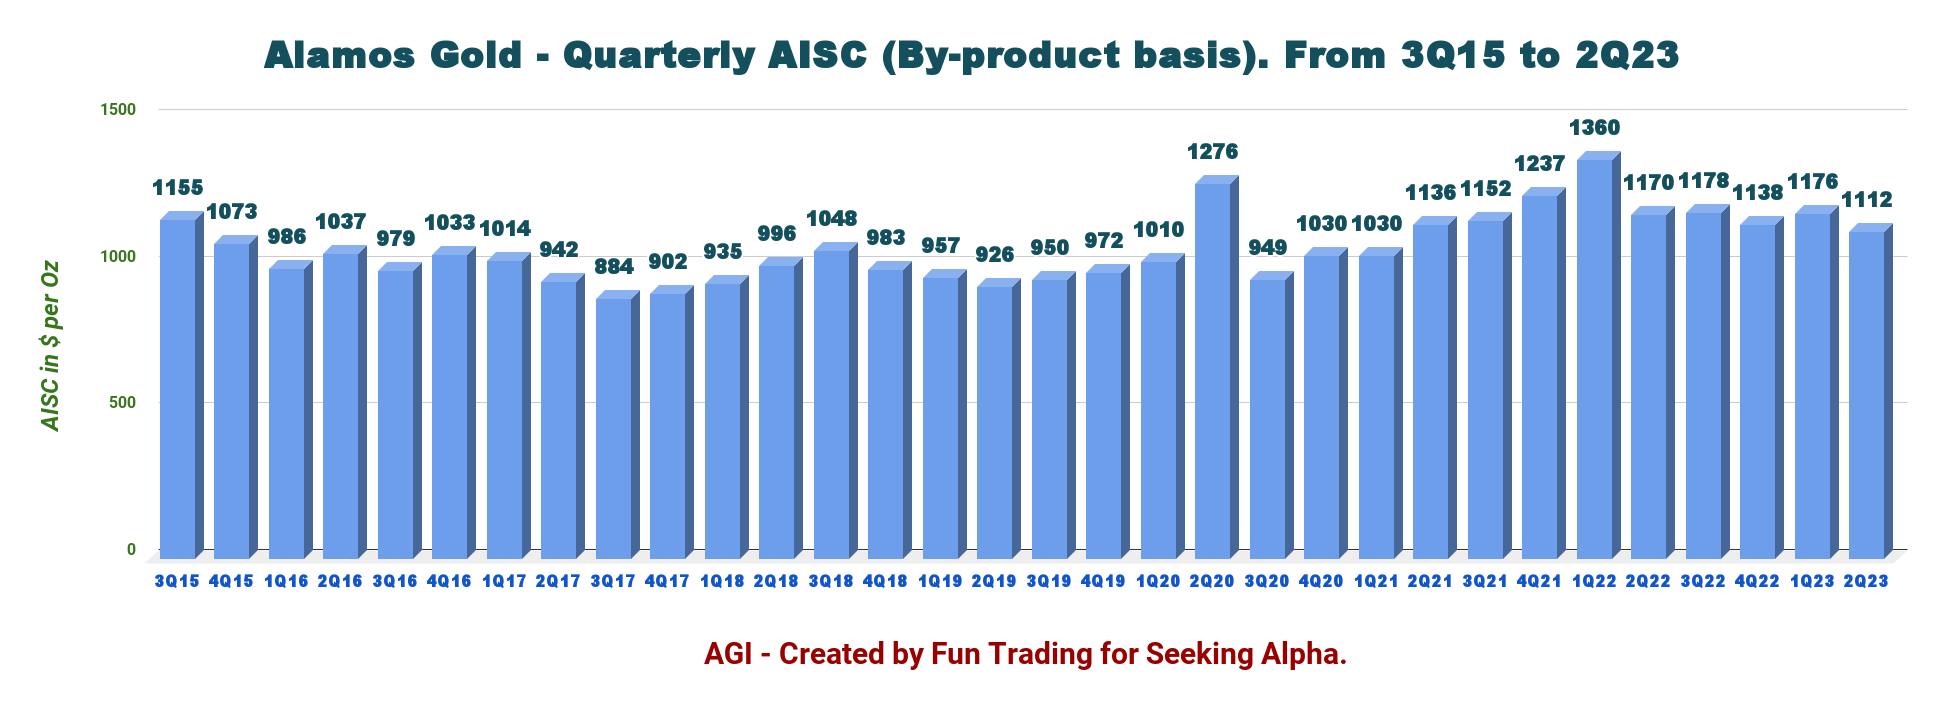
All-in-sustaining-costs, AISC, remain low this quarter at $1,112 per ounce , down sequentially from $1,176 per ounce.
AGI Quarterly AISC History (Fun Trading)
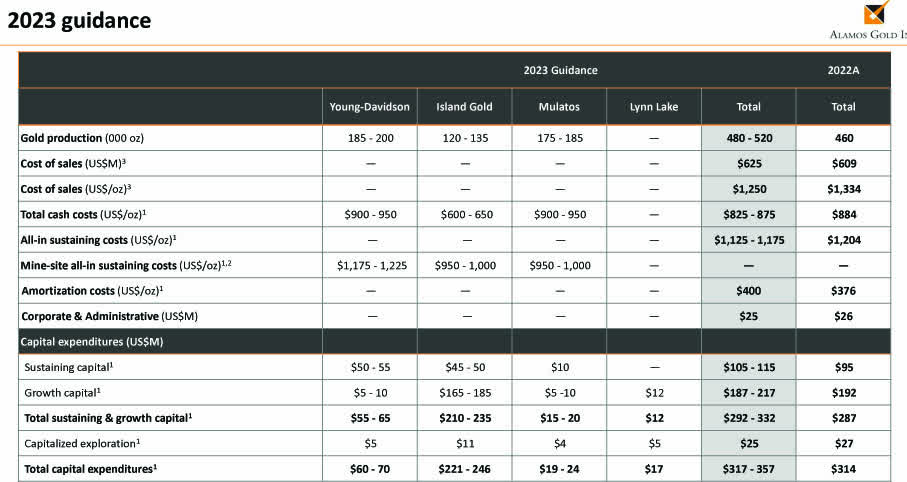
5 - 2023 Guidance
Production is expected to be between 480K oz and 520K oz in 2023, an increase of 9% YoY (mid-point of guidance). AISC is expected to be $1,125-$1,175 per ounce , improving to $950 to $1,050 per ounce in 2024.
AGI 2023 Guidance (AGI Presentation)
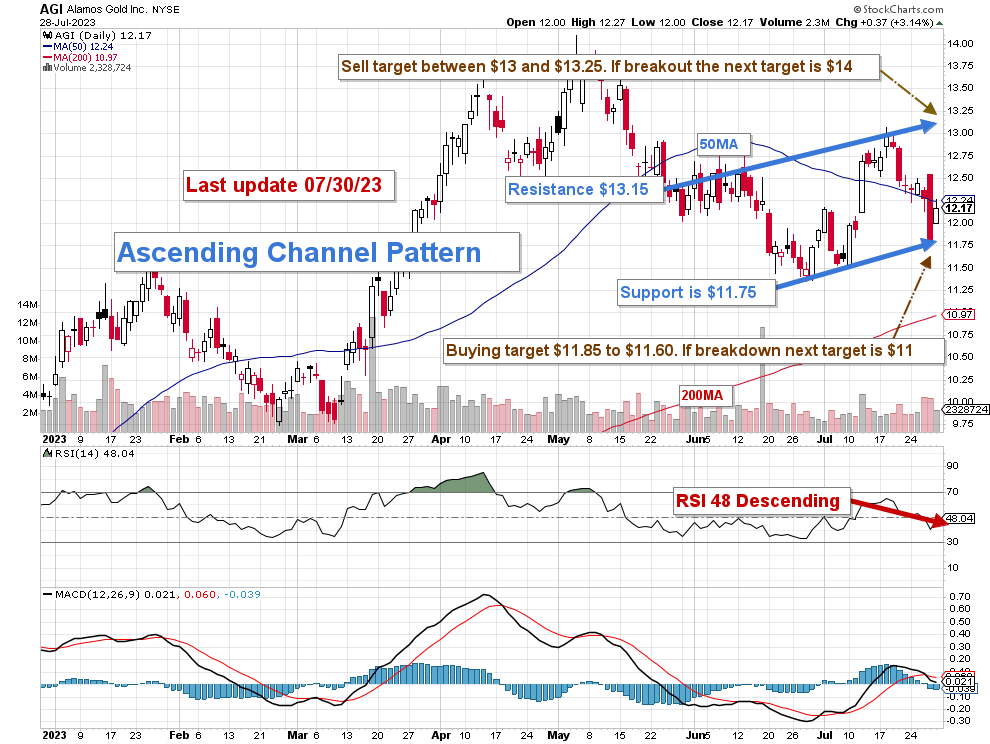
Technical Analysis (Short Term) And Commentary
AGI TA Chart Short-Term (Fun Trading StockCharts)
Note: The chart has been adjusted for the dividend.
AGI chart shows an ascending channel pattern with resistance at $13.15 and support at $11.75.
Ascending channel patterns or rising channels are short-term bullish in that a stock moves higher within an ascending channel, but these patterns often form within longer-term downtrends as continuation patterns. The ascending channel pattern is often followed by lower prices, but only after a downside penetration of the lower trend line. The stock will continue channeling upward until it is able to break either the upper or lower trend line.
The general strategy I usually promote in my investing group for AGI is to keep a core long-term position and use about 40% to trade LIFO while waiting for a higher final price target for your core position between $15 and $16.
I suggest selling about 40% of your position between $13 and $13.25 , with possible higher resistance at $14. Conversely, I recommend buying AGI between $11.85 and $11.60 , with possible lower support at $11.
Watch the gold price like a hawk.
Warning: The TA chart must be updated frequently to be relevant. It is what I am doing in my stock tracker. The chart above has a possible validity of about a week. Remember, the TA chart is a tool only to help you adopt the right strategy. It is not a way to foresee the future. No one and nothing can.
For further details see:
Alamos Gold: A Solid Quarter Again