TLT - April CPI: Numbers Not As Good As Appear On Surface
2023-05-10 10:30:50 ET
Summary
- We summarize key data and provide an in-depth analysis of the monthly Consumer Price Index report released by the U.S. Bureau of Labor Statistics.
- Both All-Items and core CPI were in line with expectations.
- Close analysis of the internals suggest that, excluding likely one-off items, core inflation trends may be worse than the aggregate figures suggest.
- Close analysis of the numbers in this report do not support bond market expectations of a Fed pivot later this year. Core inflation is showing signs of stickiness around the 5.0% level.
Summary Data and Analysis
A summary of key data and analysis for this month's CPI report is provided in Figure 1.
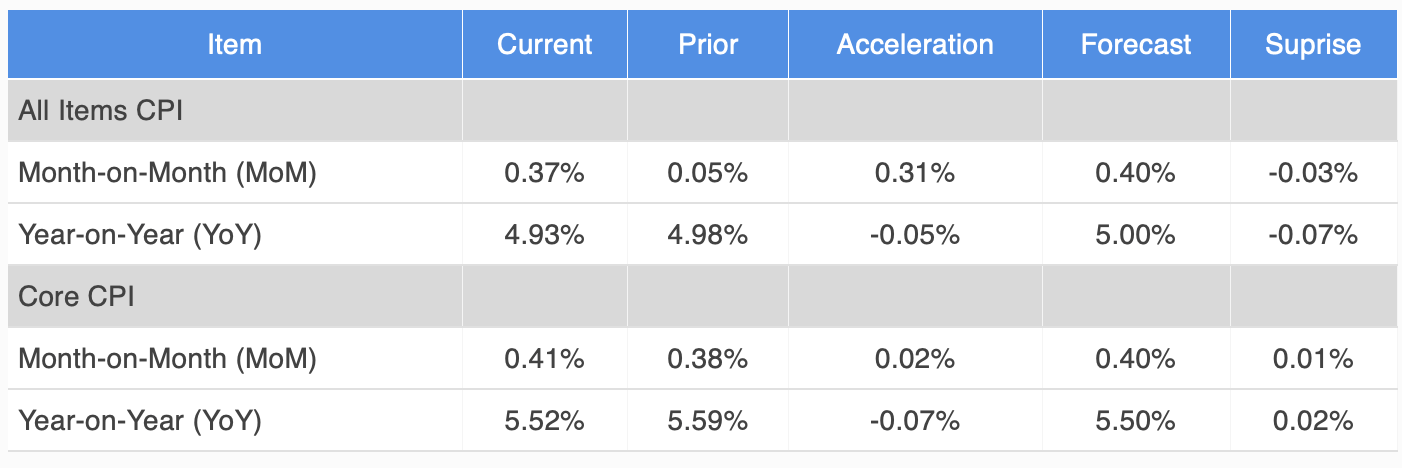
Figure 1: Change, Acceleration, Expectations, and Surprise
Core & All Items CPI (Investor Acumen)
All-Items CPI accelerated on a MoM basis and was in line with expectations. Core CPI slightly accelerated on a MoM basis and was also in line with expectations.
Analysis of Core and Non-Core Plus Key Sub-Components
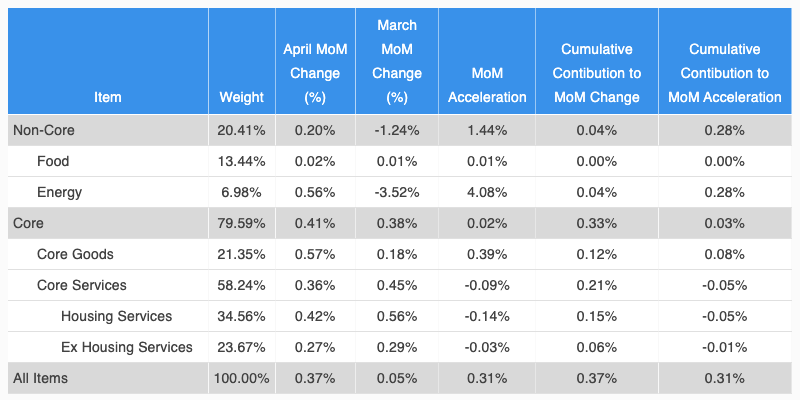
In Figure 2, we break down the analysis of change and acceleration of CPI into Non-Core and Core components. We further analyze two key subcomponents of non-core CPI and three key subcomponents of core CPI. Although all five columns in the table provide important information, we recommend that readers pay special attention to the rightmost column (Cumulative Contribution to Acceleration), as it reveals exactly what drove the MoM acceleration/deceleration in CPI during the current month compared to the prior month.
Figure 2: Analysis of Key Aggregate Components of CPI
Aggregate CPI Component Analysis (BLS, Investor Acumen)
As can be seen in the table above, Energy accelerated significantly, accounting for most of the overall acceleration in All Items CPI. Core Goods also accelerated.
Core Services except Housing - the indicator the Fed is currently paying most attention to - deaccelerated slightly for the second consecutive month. However, in digging deeper into this component there were several one-off items that brought the number down. Without those items, the change in core service except housing would have been higher and overall core might have come in higher than expected.
We now proceed to analyze the CPI report in greater depth. For more detailed information on how to read and interpret the tables and graphs in this article, please see the following Seeking Alpha blog post .
Contributions to Monthly Change in Core CPI
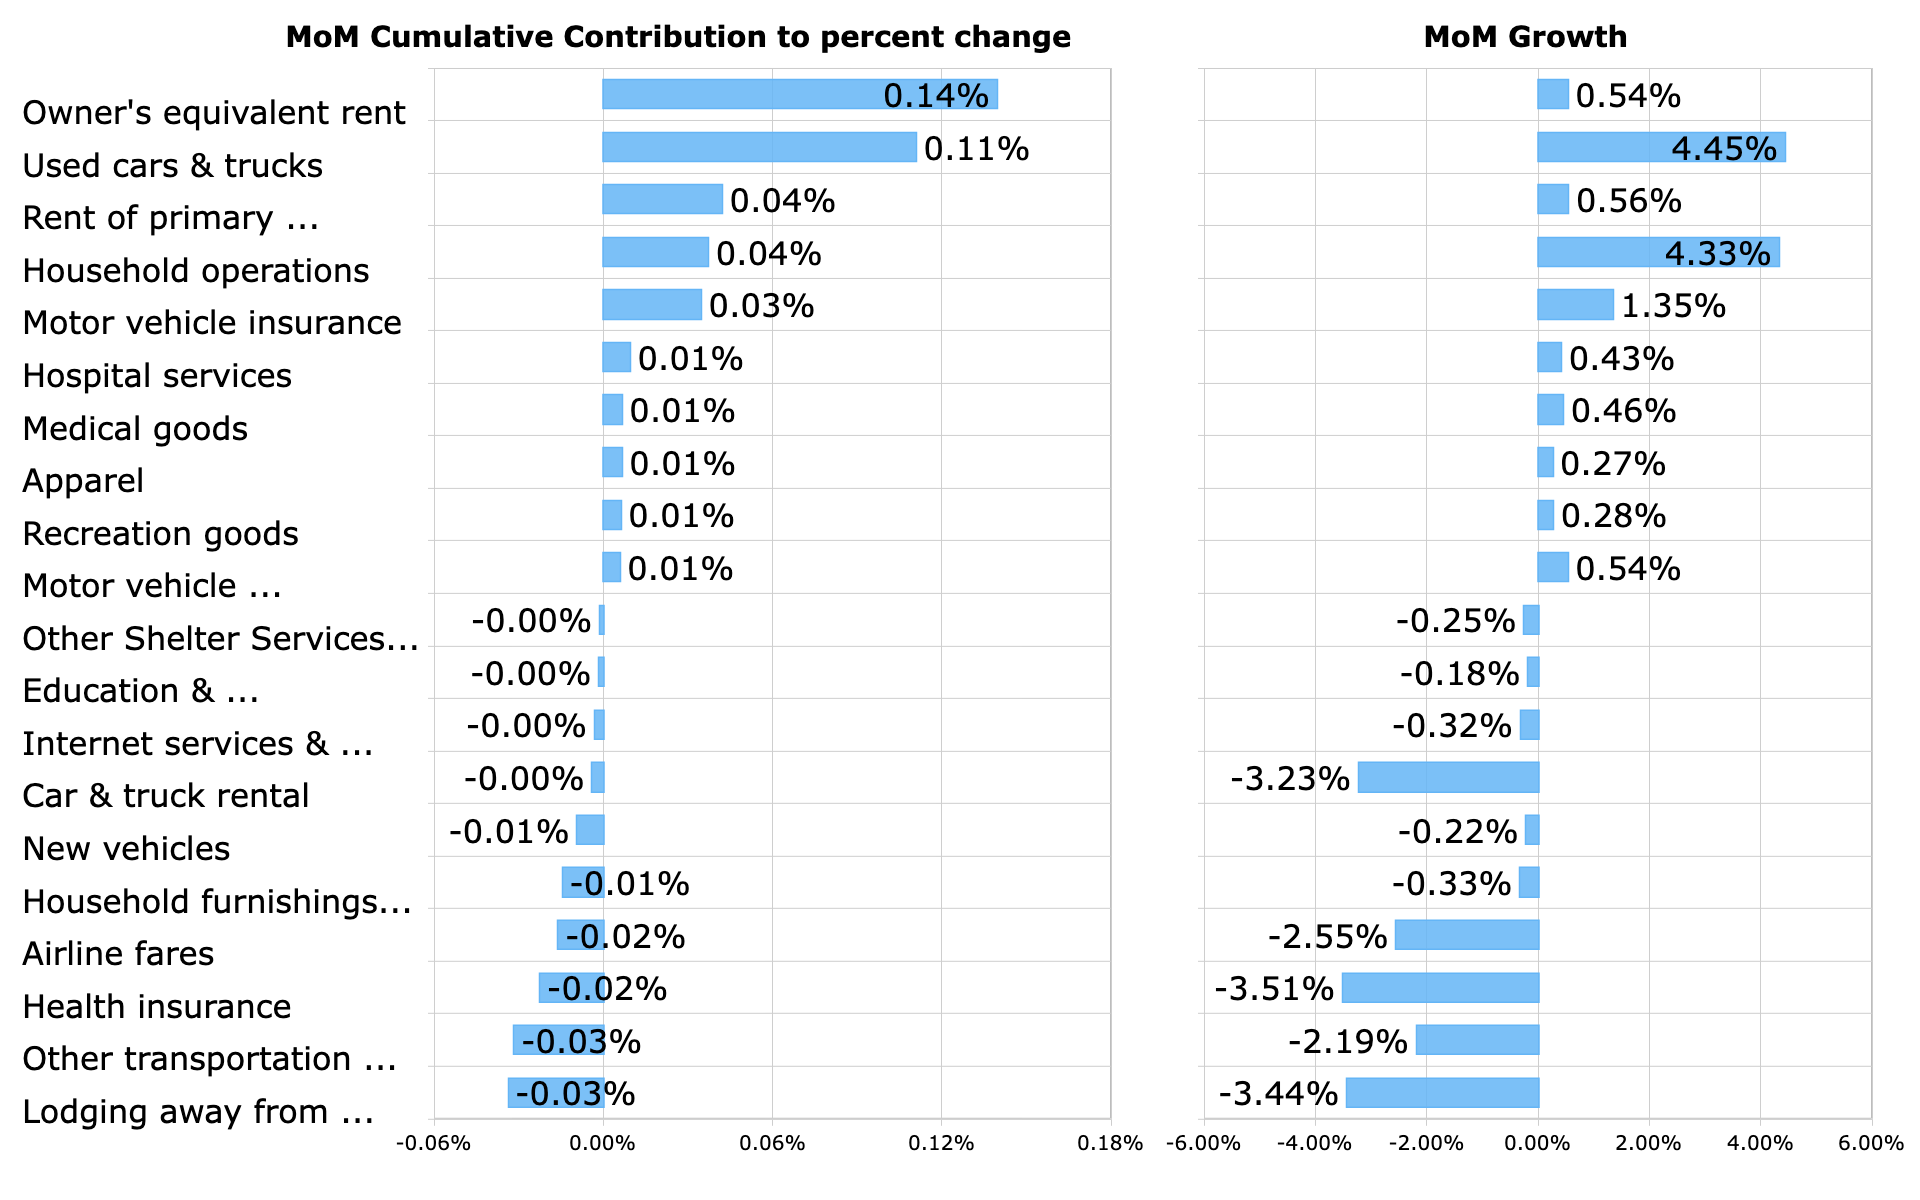
In Figure 3, we provide a bar chart that highlights the major positive and negative contributors to the MoM percent change in Core CPI. These contributions take into account both the magnitude of the MoM change in each component as well as the weight of each component in CPI.
Figure 3: Top Contributors to MoM Percent Change
Top CPI Contributors (BLS, Investor Acumen)
Owner's Equivalent Rent and Used Cars & Trucks were the most important positive contributors to the monthly change in CPI. The latter item tends to be quite volatile. Airline fares, other transportation and health insurance dragged down core services, but these items may be one-offs.
It should be noted that real-time indicators suggest that there will be significant disinflation in the housing components of CPI later this year.
Contributions to Monthly Acceleration in Core CPI
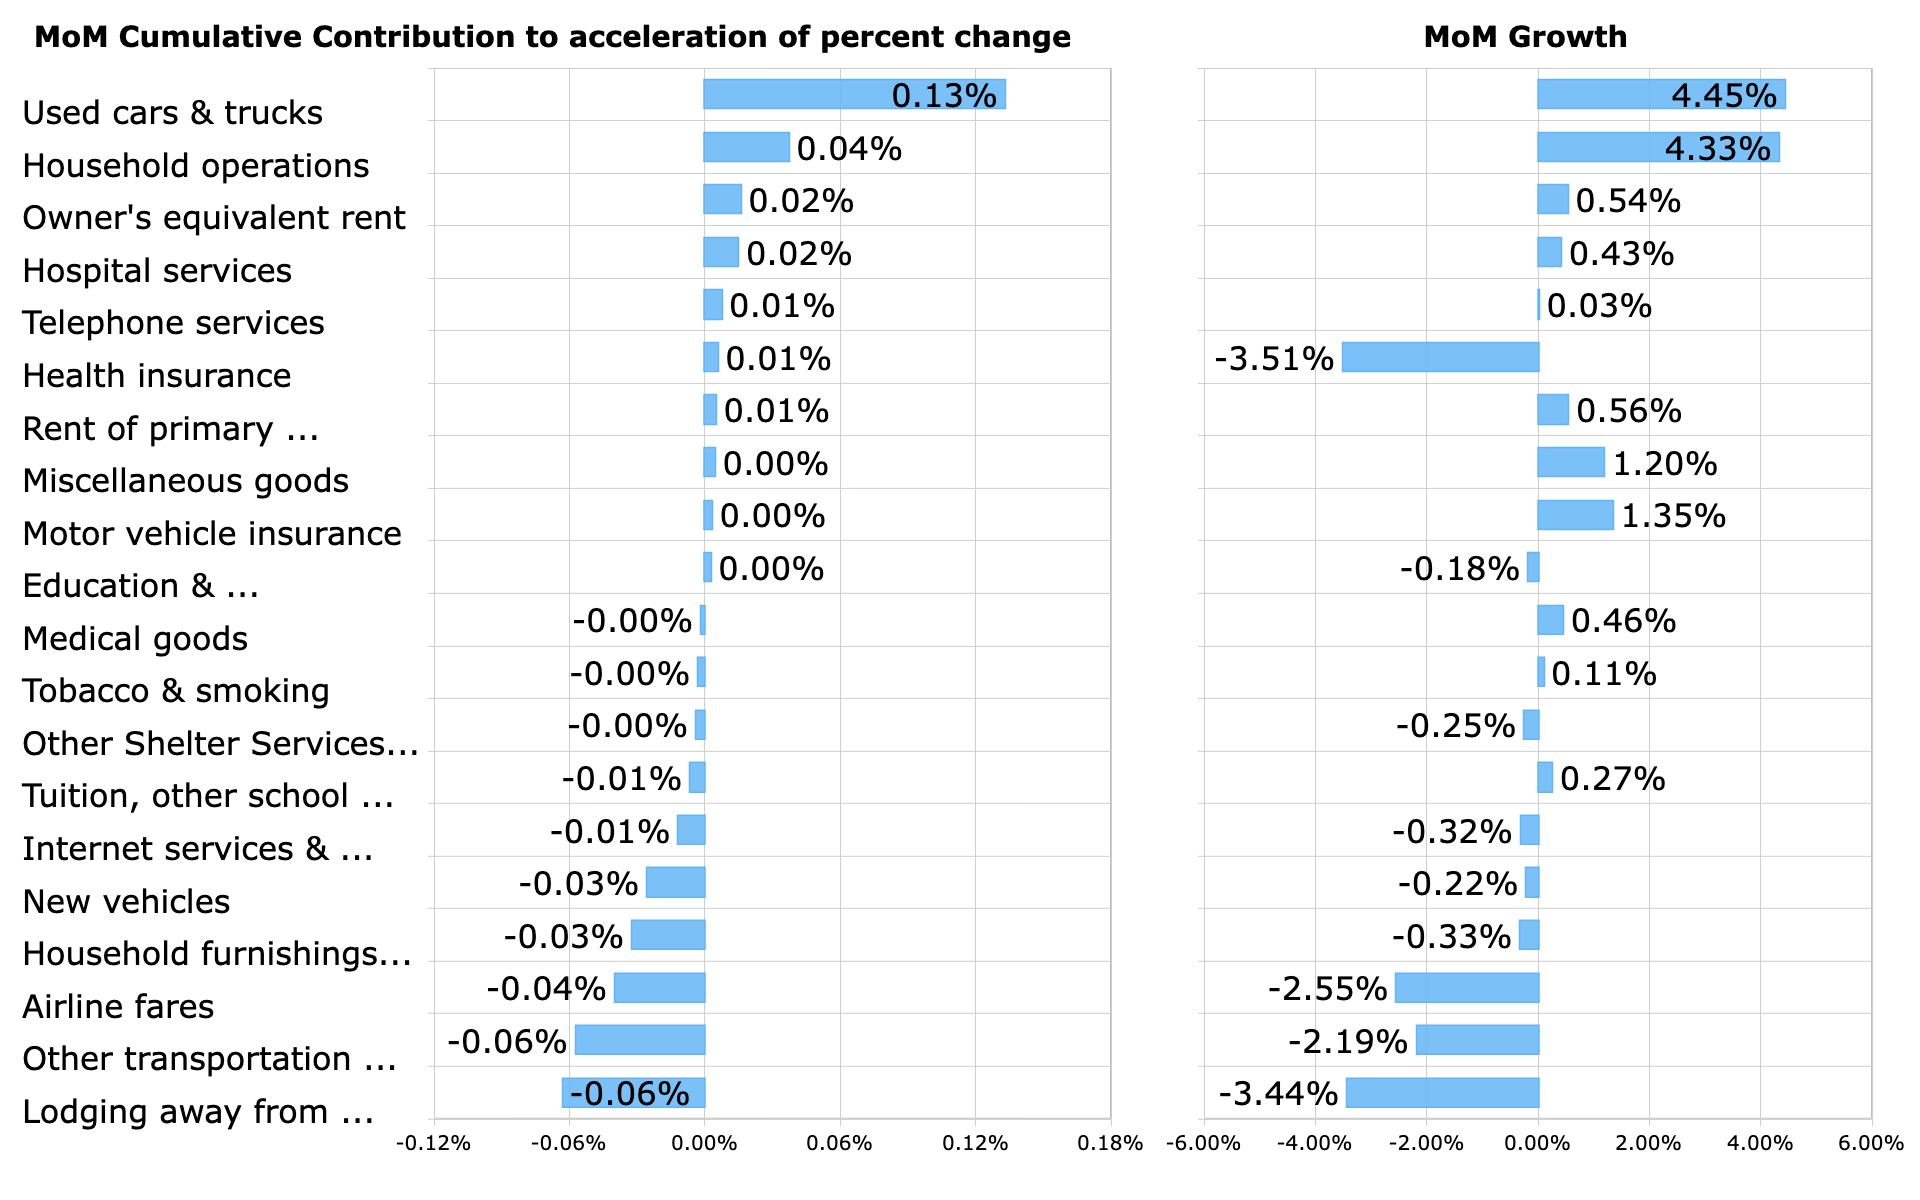
In Figure 4, we provide a bar chart that highlights the major positive and negative contributors to the MoM acceleration in Core CPI. These contributions take into account both the magnitude of the MoM accelerations in the components as well as the weight of each component in CPI.
Figure 4: Top Contributors to MoM Acceleration
Top CPI Acceleration Contributors (BLS, Investor Acumen)
It's worthwhile to examine this table carefully, as it's likely to include most or all of the items that caused deviations from forecasters' expectations of Core CPI.
Once again the most significant change from last month to this month was the strong acceleration of used car prices.
For the complete breakdown, please see the following CPI Breakdown table posted on our site each month.
Lodging away from home, which is volatile dragged down the housing component a bit. Furthermore, airline fares and other transportation dragged core services down by a full 0.10%. These later two items are volatile and are probably one-offs.
Top Movers
For general interest purposes, in Figure 5 we highlight the CPI components (most granular level) that exhibited the largest positive and negative change during the month. The YoY change in these particular components is displayed to the right.
Figure 5: Top Movers MoM Percent Change
Top CPI Movers (BLS, Investor Acumen)
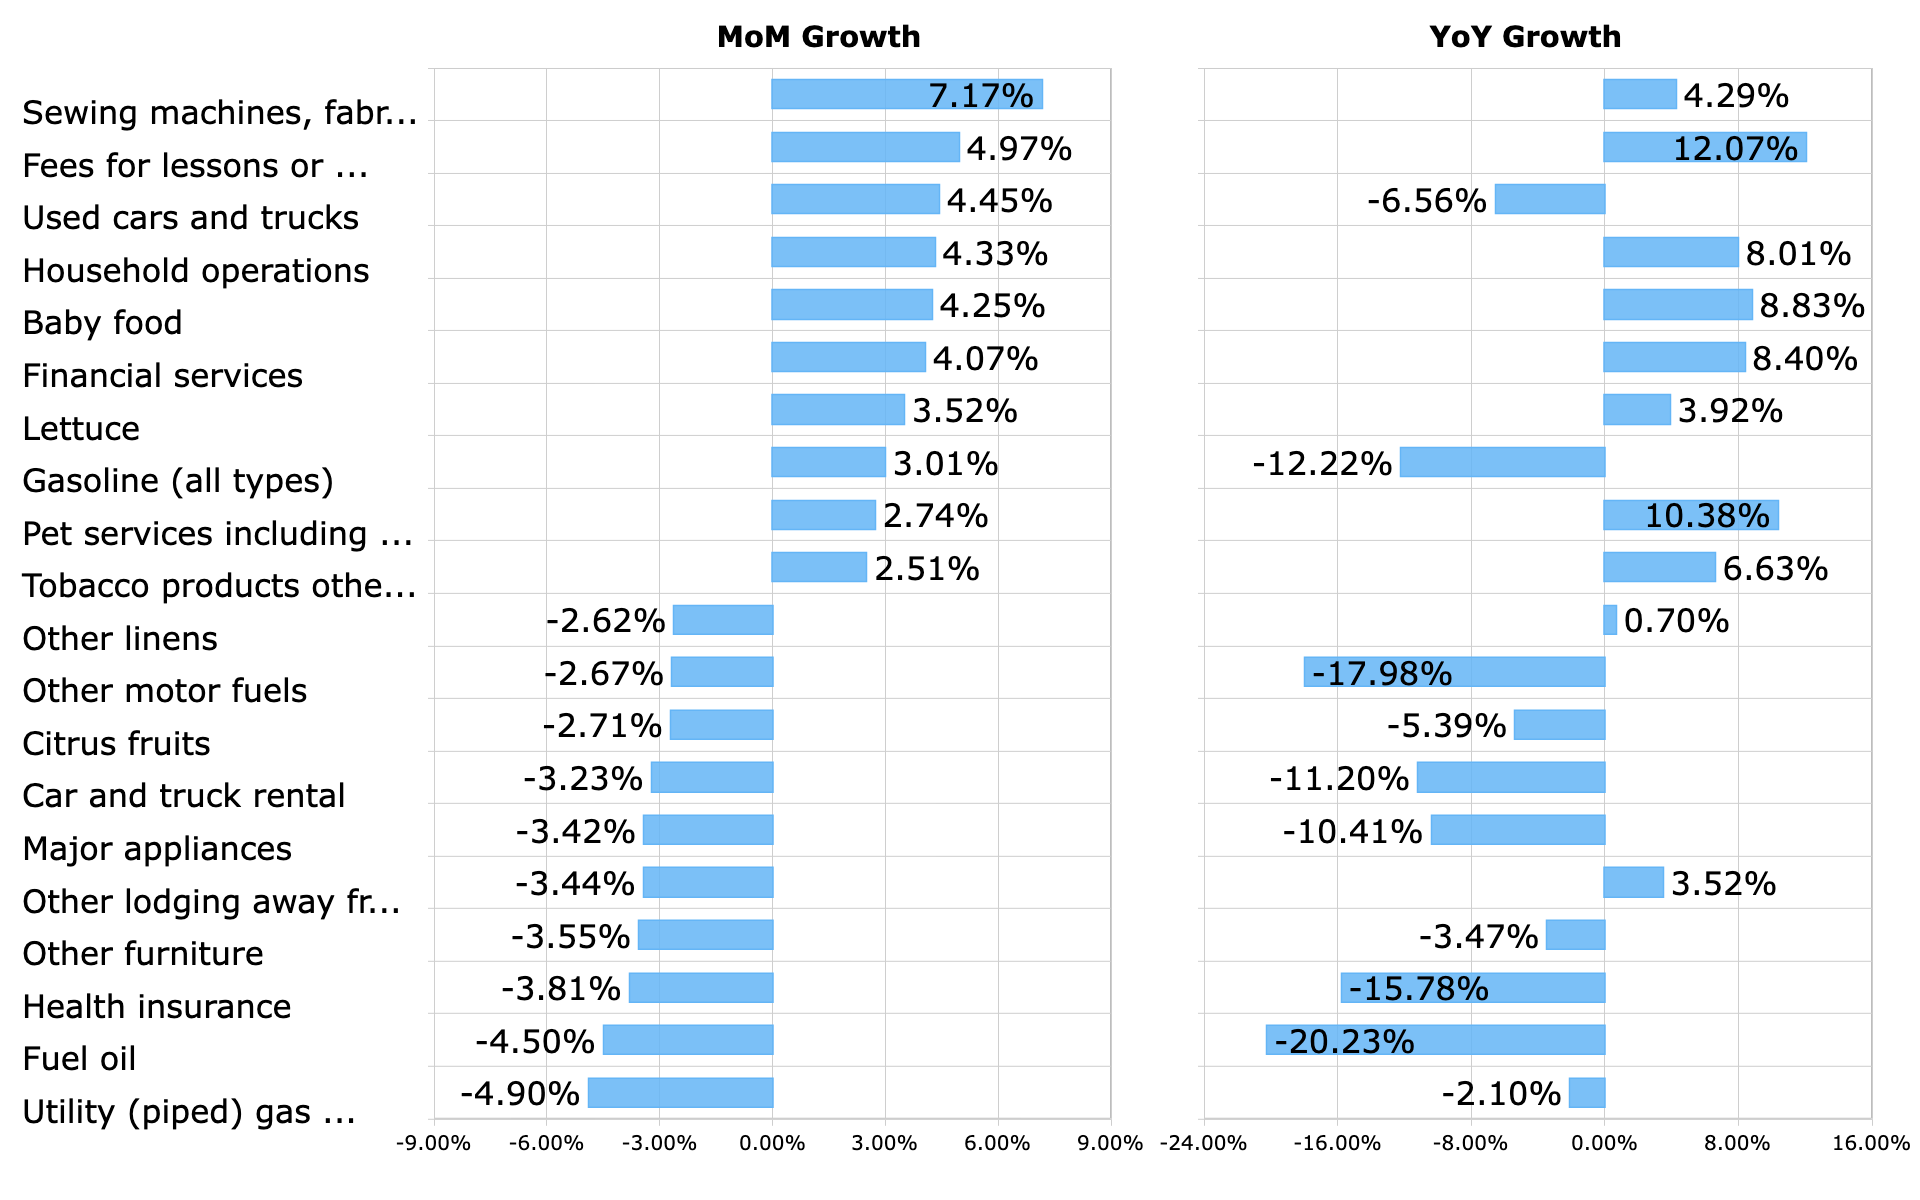
In April, Sewing machines, fabric & supplies and Fees for lessons & instructions registered the largest price increases.
Implications for the Economic Outlook
Although markets have reacted enthusiastically to the numbers, excluding several items that are probably one offs, core CPI probably surprised to the upside. In particular, core services excluding housing services -- the item the Fed is looking at most closely -- probably accelerated when excluding likely one-off items. Overall, core inflation is looking very sticky, showing little sign of decelerating decisively toward the Fed's 2.0% target.
Bond markets appear to be anticipating the Fed to cut rates later this year. There is nothing in this report which supports that outlook. Core CPI is running at close to 5.0% on both a YoY basis and on a 3-month annualized basis. Furthermore, the internals of this report were not particularly good.
There are upside risks going forward. The biggest risks to the inflation outlook, going forward, are upwards surprises in energy prices. Energy prices have most likely troughed, and going forward, if energy prices rise from current levels, they could start to exert upward pressure on inflation, including core inflation.
Implications for Financial Markets
The equity market reacted enthusiastically following today's report. As of this writing, the S&P 500 Futures (SPX) were up by roughly 0.75%. Bond markets and the Fed Funds futures markets also responded bullishly.
However, I would not be surprised if these gains are largely erased or even reversed, after analysts have had time to look at the numbers more closely. As alluded to earlier, a closer look at the internals of this report provides little reason for enthusiasm. Core inflation is looking very sticky.
For further details see:
April CPI: Numbers Not As Good As Appear On Surface