CA - B2Gold: I Find It Unfairly Valued By The Market
2023-09-11 13:09:40 ET
Summary
- B2Gold Corp. released its second-quarter 2023 results, showing a net income of $80.42 million and revenues of $470.85 million.
- The company's stock performance has underperformed the VanEck Vectors Gold Miners ETF and is down 13.2% in the past year.
- B2Gold is a strong mid-tier gold miner with well-diversified assets and a high-grade undeveloped gold project in the Goose Project.
- I recommend buying B2Gold Corp. between $3 and $2.90 is reasonable, with possible lower support at $2.80.
Part I - Introduction
Vancouver-based gold miner B2Gold Corp. ( BTG ) released its second-quarter 2023 results on August 2, 2023.
Note: I have followed BTG quarterly since July 2019. This new article is a quarterly update of my article published on May 10, 2023.
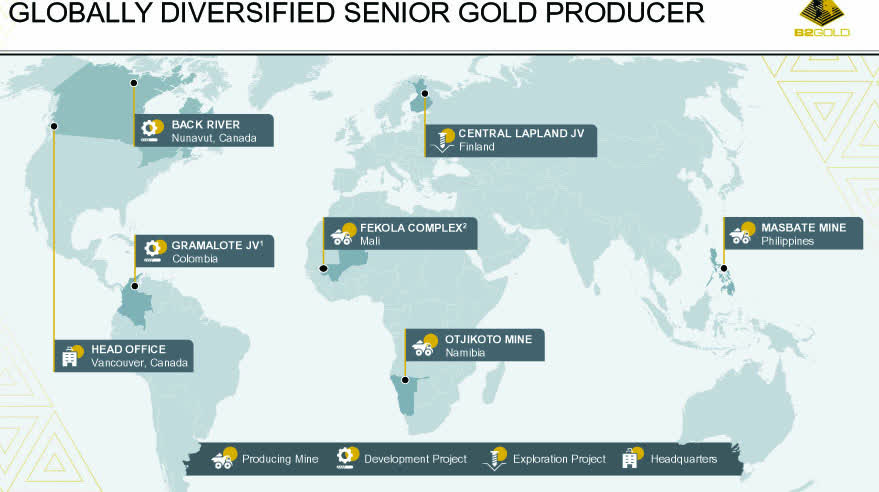
BTG owns three producing mines , one production mine in a 50/50 JV, one development project, the Goose Project in Northern Canada, and two exploration projects in Finland and the Ivory Coast (not indicated in the map).
BTG Map Assets (BTG Presentation)
1 - 2Q23 results snapshot
B2Gold posted a net income attributable to the shareholders of $80.42 million , or $0.06 per diluted share , compared with $37.80 million, or $0.04 per share, in 1Q22.
Revenues for 2Q23 were $470.85 million , down 0.6% sequentially and up 23.3% compared to the same quarter a year ago. Operating activities provided cash flow before changes in non-cash working capital was $194.98 million , up from $124.86 million made in 2Q22. CapEx was $180.73 million in 2Q23 compared with $116.51 million in 2Q22.
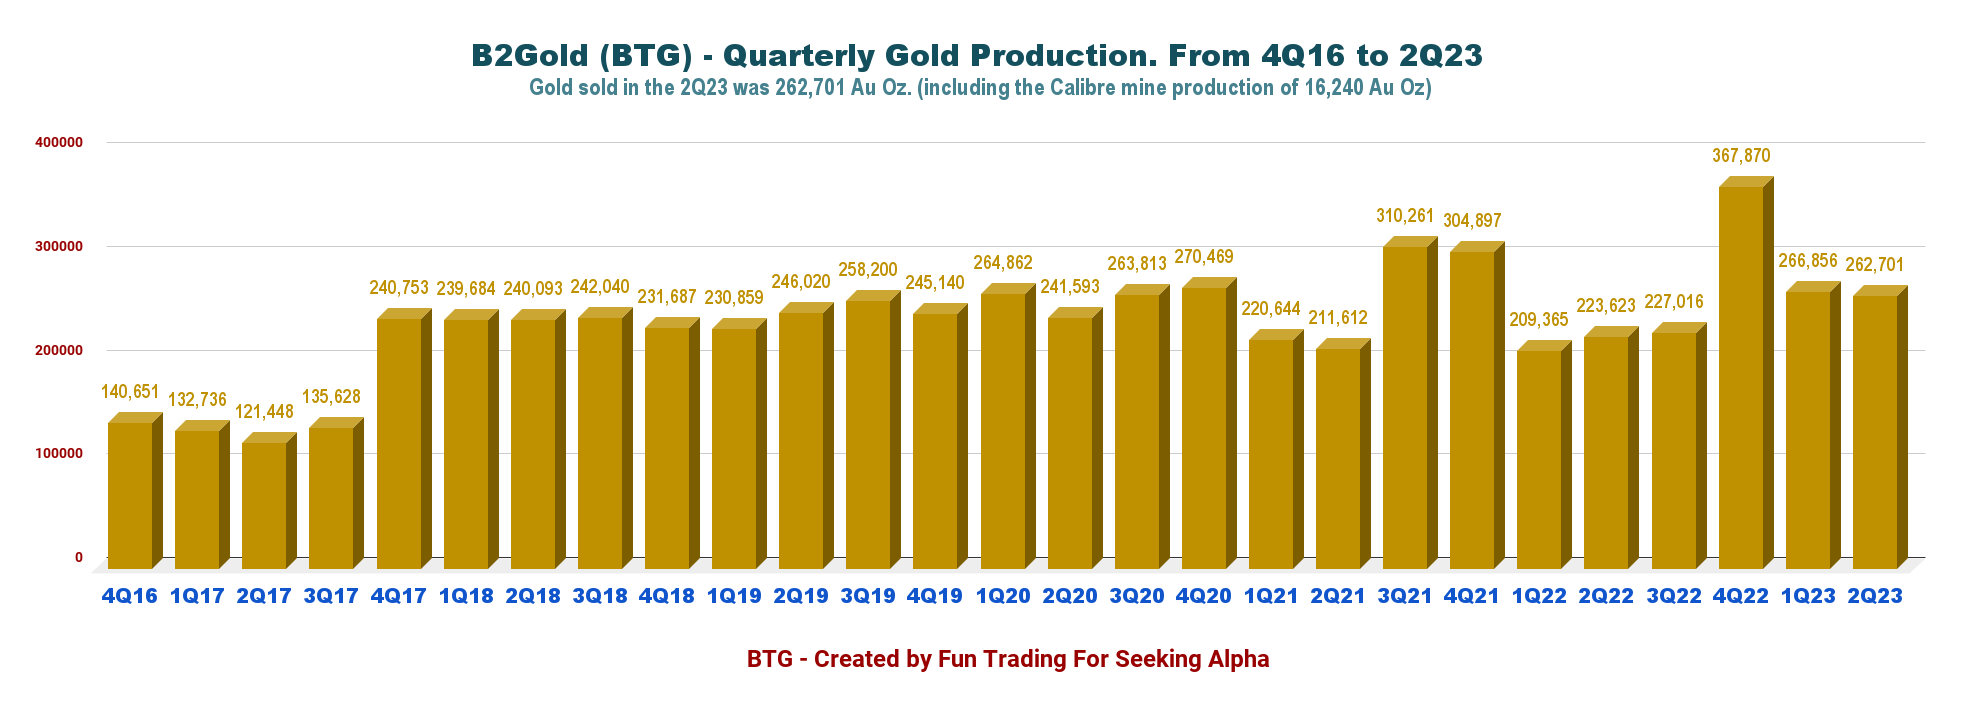
Total gold production in the second quarter of 2023 was 262,701 ounces (including 16,740 Au ounces for its 25% Calibre Mine plus 1.5% NSR).
In 2Q23, B2Gold approved a $20 million exploration budget for the balance of 2023 to complete approximately 25,000 meters of drilling. Drilling will be focused in proximity to existing deposits at the Goose Project and following up on regional targets identified at the George, Boulder, Boot, and Del projects.
2 - Stock performance
B2Gold has slightly underperformed the VanEck Vectors Gold Miners ETF ( GDX ) and is down 13.2% on a one-year basis. BTG has dropped significantly since April-May this year in correlation with the Fed's actions and the turmoil experienced in Mali, West Africa, increasing risks for the company's flagship Fekola Mine, even if operations have been normal.
3 - Investment thesis
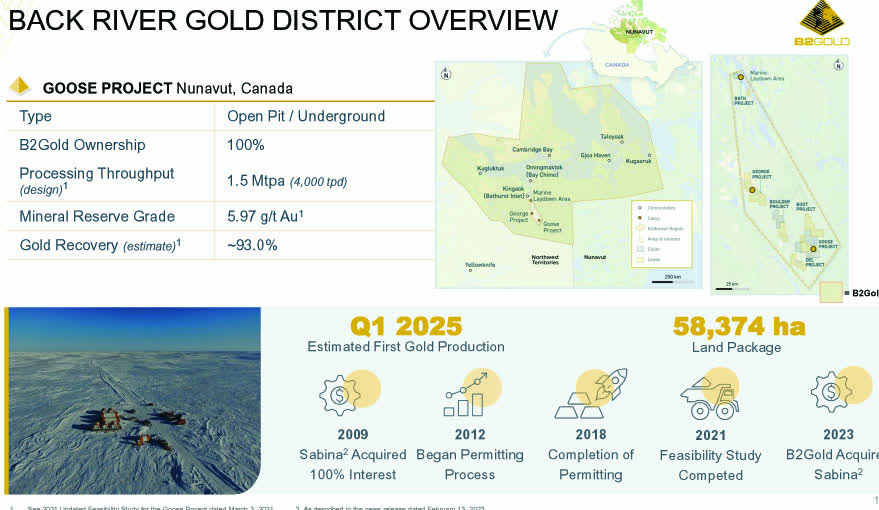
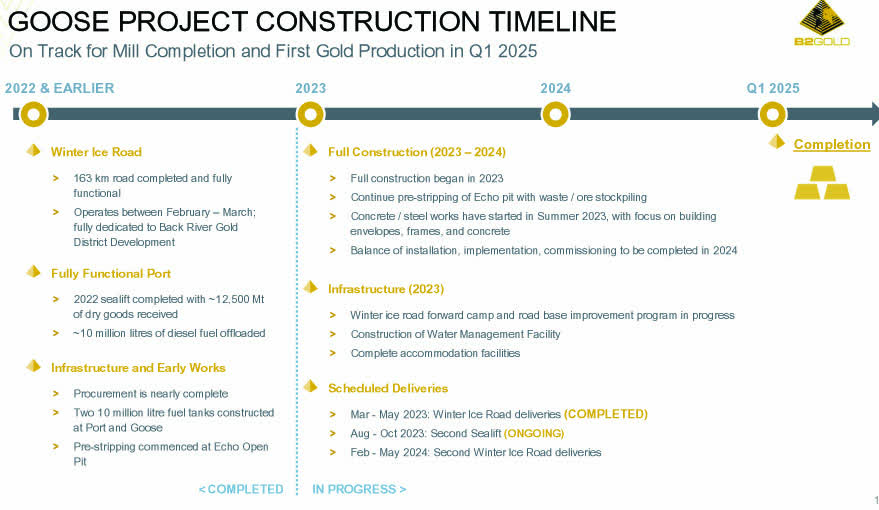
BTG is a strong mid-tier gold miner with well-diversified assets and a good growth prospect, with the Goose project (100%) on track for First Production in 1Q25. The Goose project is part of the Back River Gold district.
The Goose project ranks among the highest-grade undeveloped gold projects globally, with an estimated average head grade of ~6.0 g/t gold .
One of the highest-grade undeveloped open pits in the world with a reserve grade of 5.3 g/t Au, which makes the company an excellent acquisition for Agnico Eagle (AEM) down the road eventually.
The cost to accelerate underground mining is estimated at an additional C$90 million for a total project capital expenditure of C$890 million (approximately $676 million ) with approximately C$550 million (approximately $418 million ) expected to be spent by B2Gold up to completion of construction in the first quarter of 2025. (Press release).
BTG Goose Project Nunavut (BTG August Presentation)
BTG Goose Project Timeline (BTG Presentation)
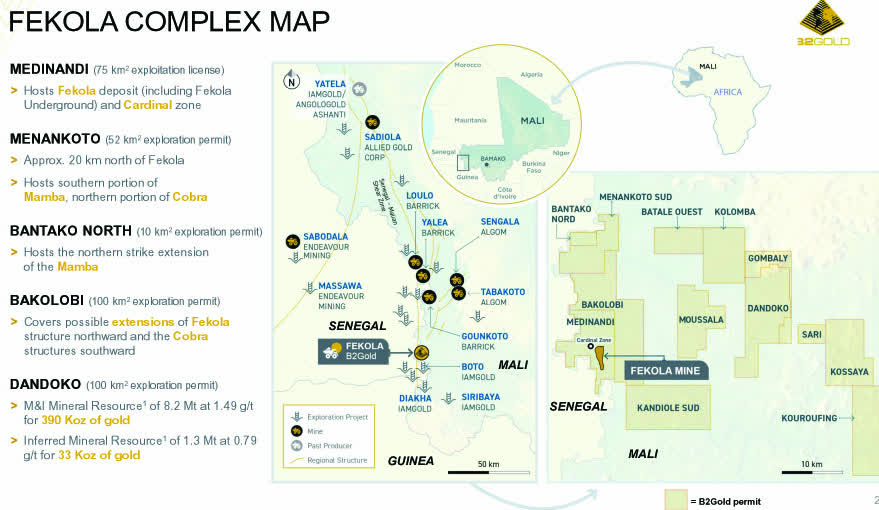
However, despite all this fundamental strength, the stock price remains weak due to the political instability in Mali, West Africa, where its Fekola Mine is located.
Hence, even if the stock price looks heavily discounted now, I can understand why some investors are reticent to commit more cash to this company.
Is it justified? I would say, of course not, because Fekola is located close to the border of Senegal and is safer than many think. Also, any new government in Mali will probably protect the mining industry, which provides crucial financial support to the Country.
BTG Fekola Complex (BTG Presentation)
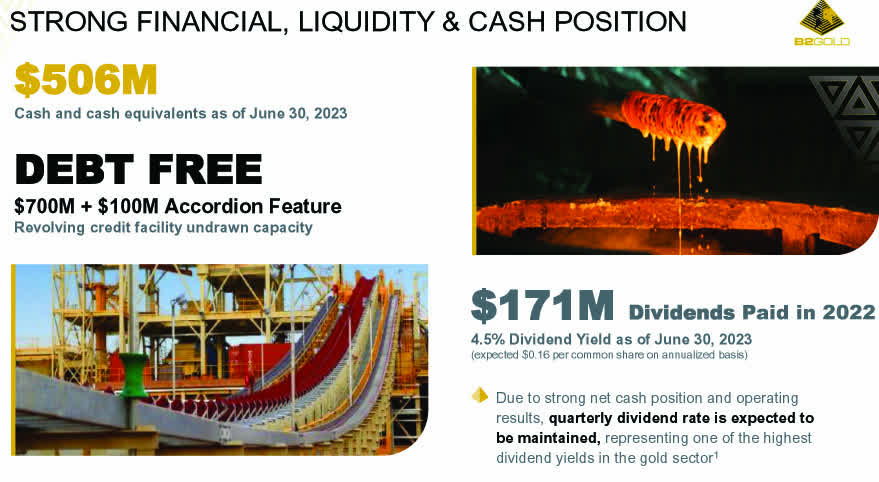
One important positive: BTG pays a quarterly dividend of $0.04 per share or a yield of 5.25% (3.94% net after Canadian Tax) .
Thus, one winning strategy I often recommend is trading about 50%-60% LIFO of your BTG position and keeping a core long-term position for an eventual higher stock price.
It is the best strategy to protect you from "surprises" and reward you with a sizeable profit without touching your long position.
Part II - B2Gold - Historical balance sheet until 2Q23 - The Raw Numbers
All numbers are in .
| B2Gold |
| 2Q22 |
| 3Q22 |
| 4Q22 |
| 1Q23 |
| 2Q23 |
| Total Revenues in $ Million |
| 381.99 |
| 392.55 |
| 592.47 |
| 473.56 |
| 470.85 |
| Net Income in $ Million |
| 37.80 |
| -23.41 |
| 157.76 |
| 85.97 |
| 80.42 |
| EBITDA $ Million |
| 188.78 |
| 143.60 |
| 368.92 |
| 179.78 |
| 257.00 |
| EPS Diluted in $/share |
| 0.04 |
| -0.02 |
| 0.15 |
| 0.08 |
| 0.06 |
| Cash from Operations in $ Million |
| 124.88 |
| 93.12 |
| 270.49 |
| 203.82 |
| 194.98 |
| Capital Expenditure in $ Million |
| 132.49 |
| 76.50 |
| 87.10 |
| 111.37 |
| 180.73 |
| Free Cash Flow in $ Million |
| 8.37 |
| 16.62 |
| 183.39 |
| 92.45 |
| 14.25 |
| Total Cash $ Million |
| 586.70 |
| 549.46 |
| 651.95 |
| 673.74 |
| 506.21 |
| Total Long-term Debt in $ Million (including current) |
| 47.32 |
| 14.32 |
| 28.88 |
| 49.31 |
| 55.60 |
| Dividend $/share |
| 0.04 |
| 0.04 |
| 0.04 |
| 0.04 |
| 0.04 |
| Shares Outstanding (diluted) in Billion |
| 1,068 |
| 1,064 |
| 1,081 |
| 1,081 |
| 1,258 |
| Production |
| 2Q22 |
| 3Q22 |
| 4Q22 |
| 1Q23 |
| 2Q23 |
| Total production gold |
| 223,623 |
| 227,016 |
| 367,870 |
| 266,856 |
| 262,701 |
| AISC from continuing operations/consolidated |
| 1,111 |
| 1,169 |
| 1,030 |
| 1,060 |
| 1,214 |
| Gold Price |
| 1,861 |
| 1,711 |
| 1,746 |
| 1,901 |
| 1,969 |
Data Source: Company press release .
* Warning: Shares outstanding are expected to increase to 1,296 million shares in 2Q23 after the completion of the Sabrina acquisition.
Analysis: Revenues, And Gold Production
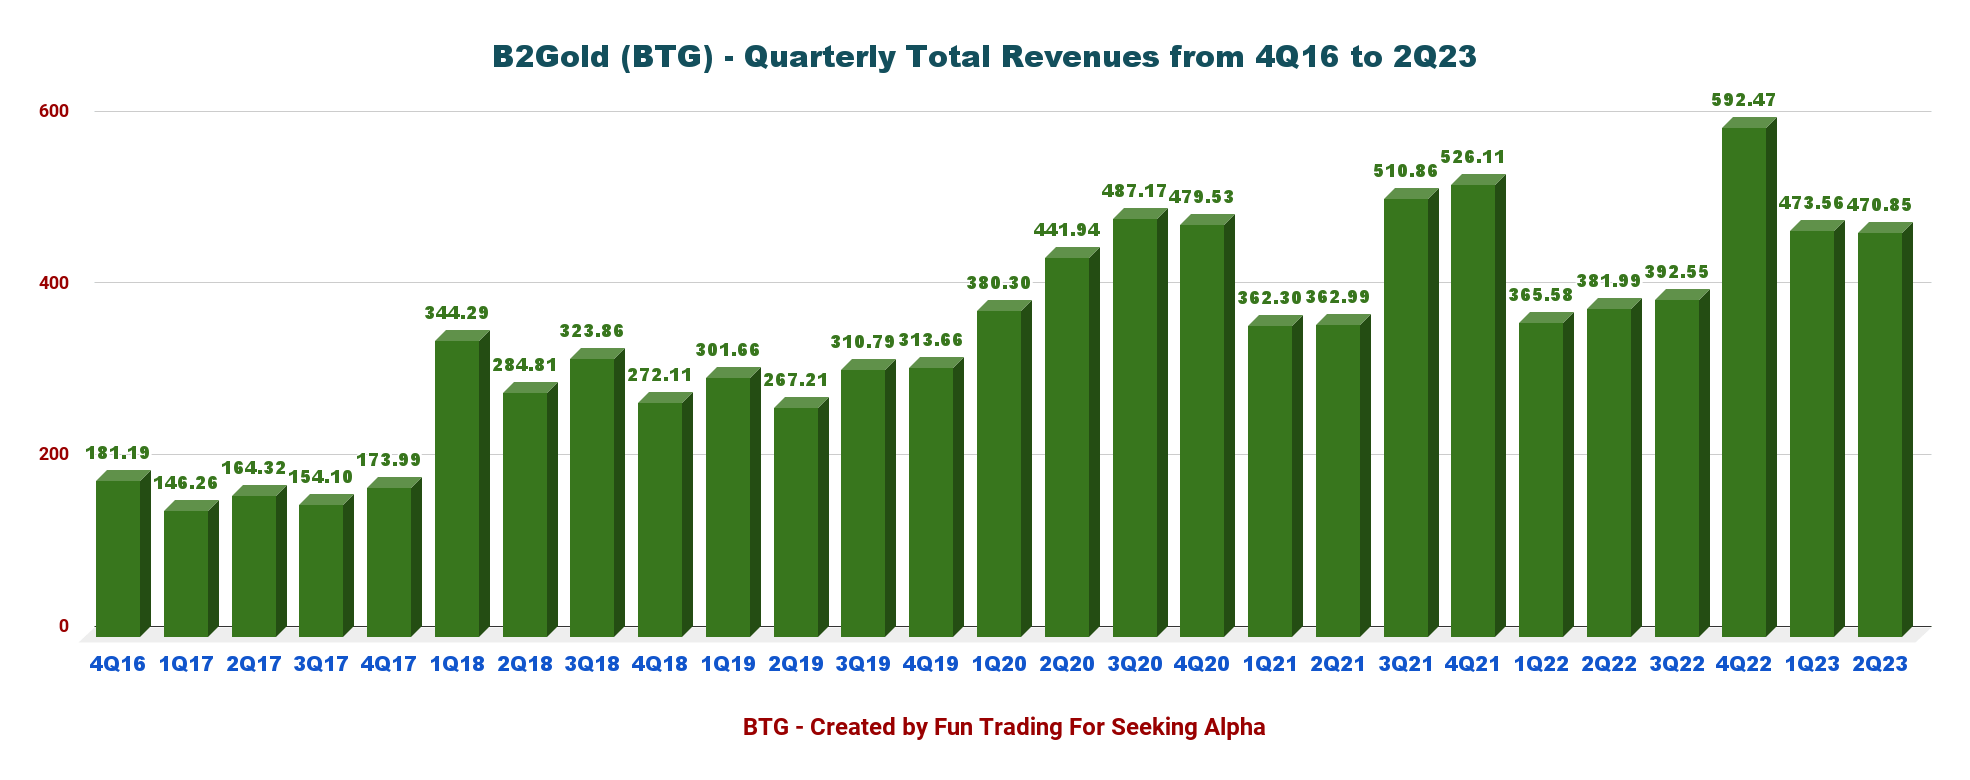
1 - Quarterly revenues were $470.85 million for 2Q23
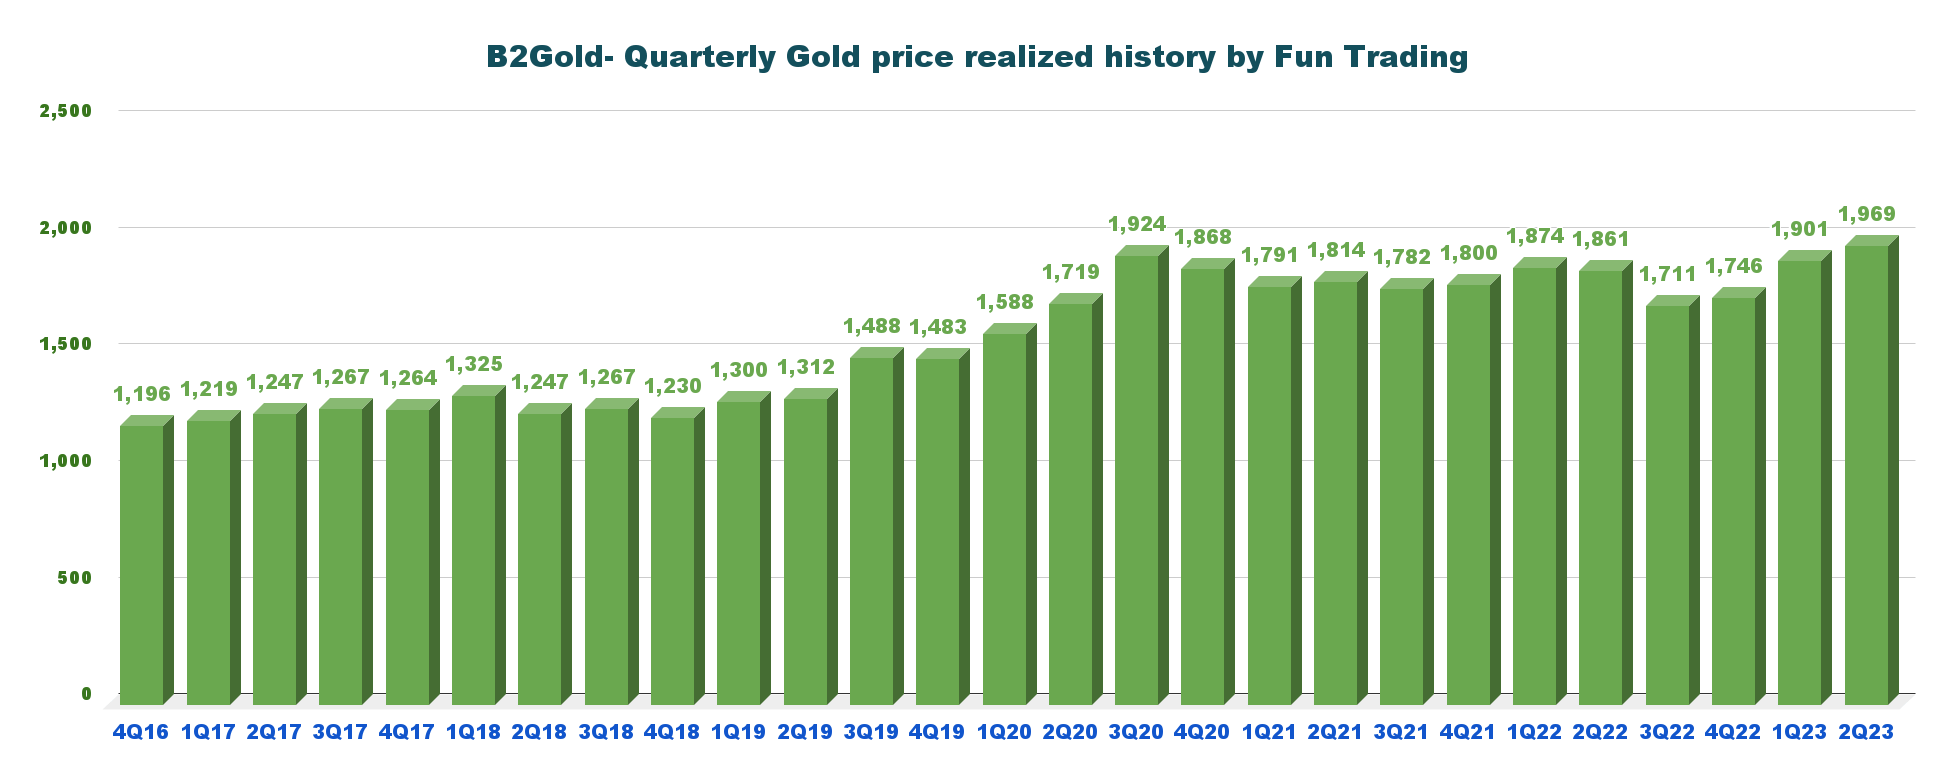
BTG Quarterly Revenue History (Fun Trading) The company announced consolidated gold revenues of $470.85 million in the second quarter of 2023, up from $381.99 million in the year-ago period and down 0.6% sequentially (see table above for details and history). The company sold its gold at a record of $1,969 per ounce this quarter. BTG Quarterly Gold Price History (Fun Trading)
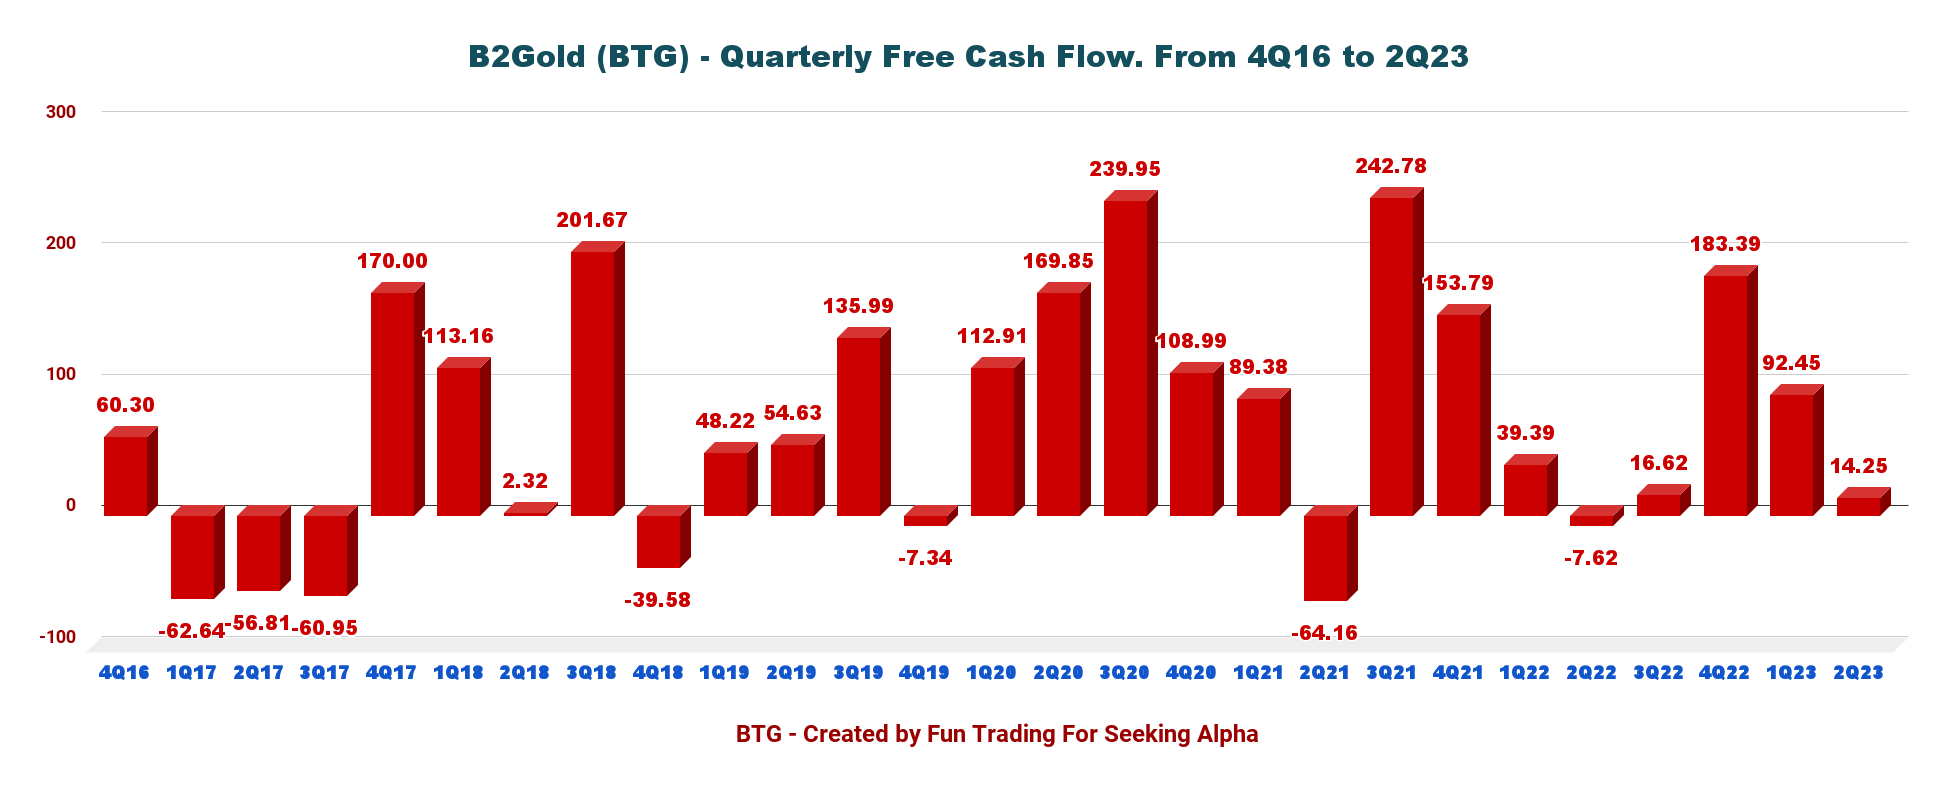
2 - The second quarter's free cash flow was $14.25 million
BTG Quarterly Free Cash Flow History (Fun Trading)
Note: Generic free cash flow is cash from operating activities minus CapEx.
B2Gold had a quarterly free cash flow of $14.25 million in 2Q23 and a trailing 12-month FCF of $306.71 million .
B2Gold pays a quarterly dividend of $0.04 per share or a yield of 5.25% , one of the best in the gold industry.
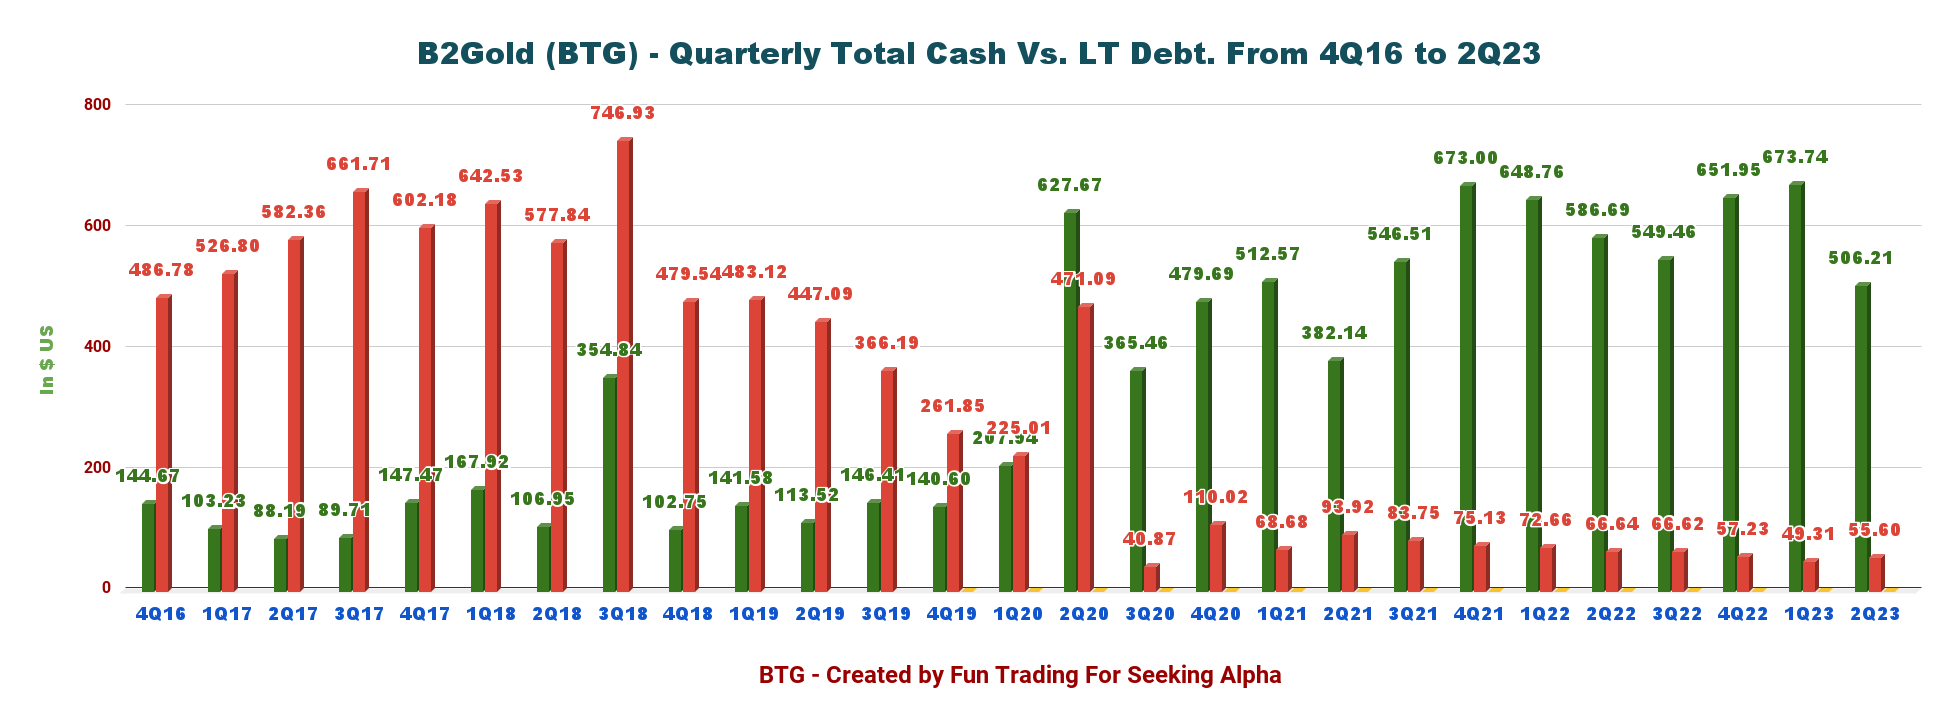
3 - B2Gold is net debt-free and has $506.21 million in total cash at the end of June 2023.
BTG Quarterly Cash versus Debt History (Fun Trading) B2Gold has a solid financial position and liquidity. As shown in the chart above, the company has a long-term debt (including current) of $55.60 million.
On June 30, 2023, the company had cash and cash equivalents of $506.21 million.
In addition, the company's $600 million Revolving Credit Facility ("RCF") remains fully undrawn and available. In July 2023, the available and undrawn capacity of the RCF was increased to $700 million under the accordion feature with the addition of the National Bank of Canada to the syndicate of lenders. The liquidity is estimated at $1,206 million in 2Q23.
BTG Balance Sheet Liquidity (BTG August Presentation)
This part is one powerful one that gives investors what they need to be patient and invest in BTG at under $3.
4 - 2Q23 Gold Production Snapshot
B2Gold posted a solid gold production of 262,701 Au ounces (including 16,740 Au ounces for its interests in Calibre Mine) in the second quarter of 2023.
All B2Gold operations are on track to meet or exceed annual production guidance ranges. BTG sold 255,897 Au Oz in 2Q23.
BTG Quarterly Gold Production History (Fun Trading)
Note: B2Gold is considered a related party by its equity interest in Calibre, as it owns approximately 25% of the company. Under an agreement with B2Gold in November 2016, B2Gold retains a 1.5% NSR on production from certain concessions.
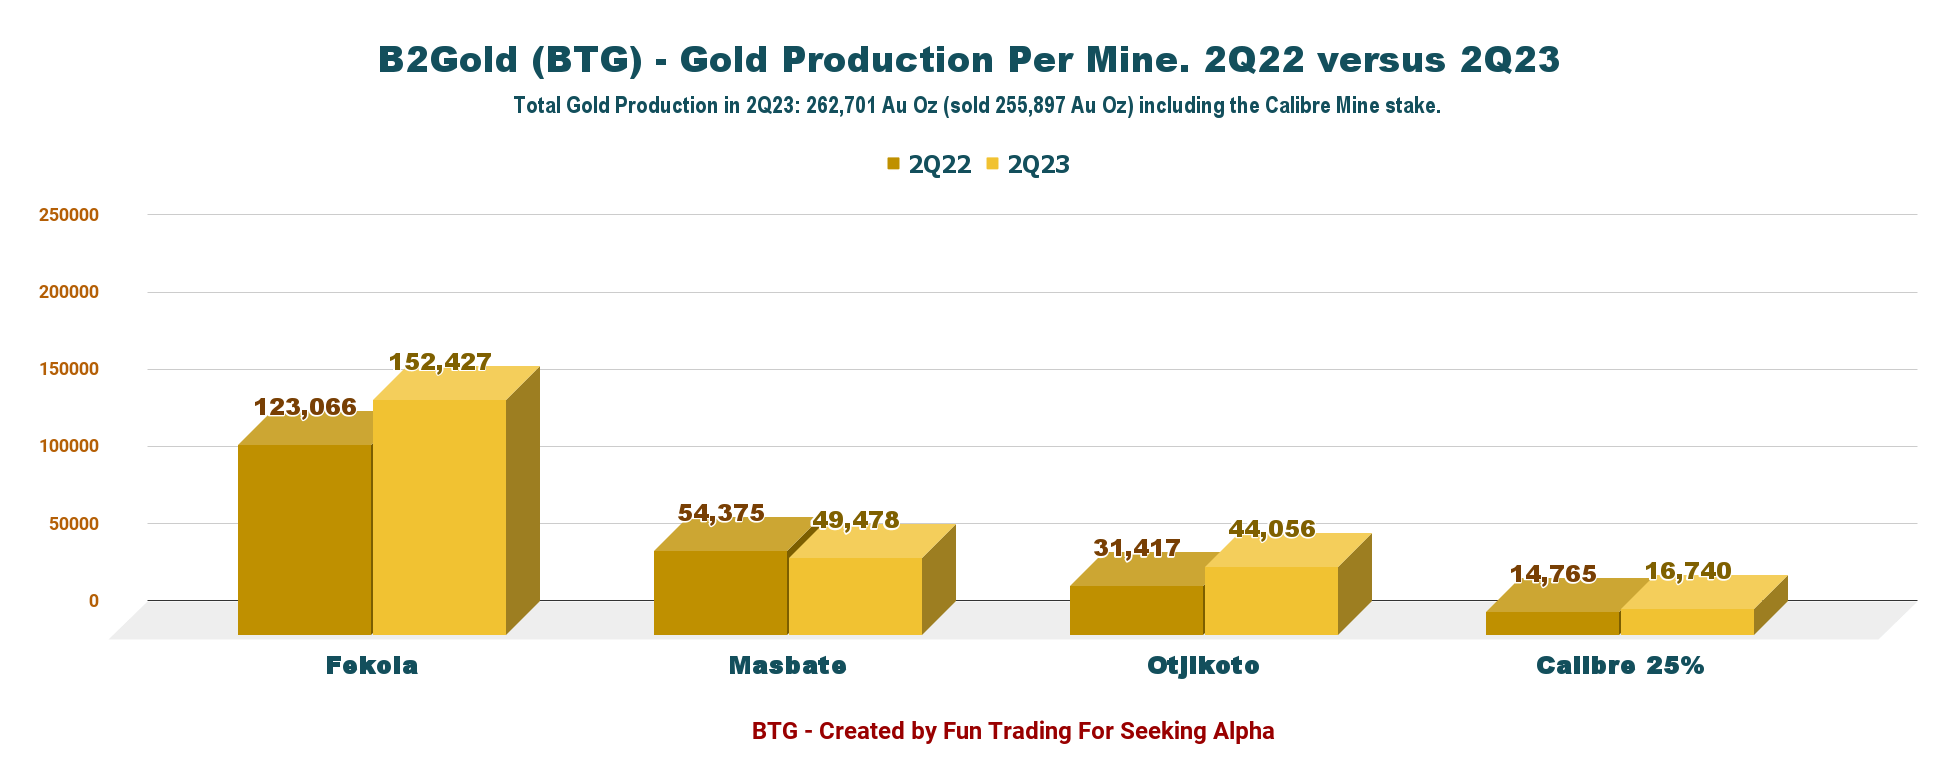
4.1 - Production detail: Production comparison 2Q22 versus 2Q23 per mine
BTG Quarterly Production per Mine 2Q22 versus 2Q23 (Fun Trading)
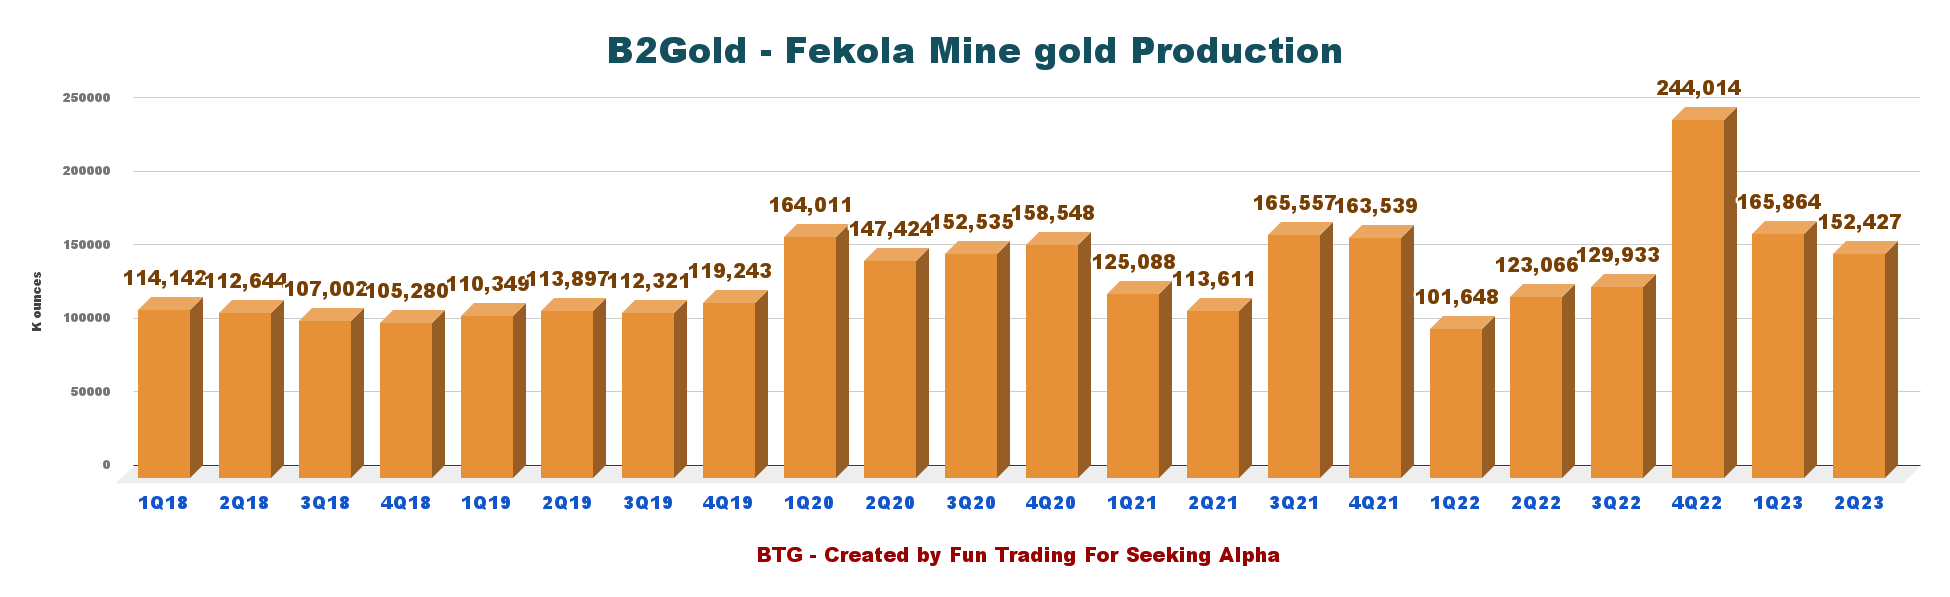
4.1.1 - The Fekola Mine In Mali:
Gold production was 152,427 ounces in the second quarter of 2023.
The Fekola Mine benefitted from a favorable mine phasing sequence in the second quarter, with Phase 6 of the Fekola pit providing high-grade ore to the process plant.
The mine has excellent potential for growth in the Anaconda Area. Mineral Resources increased substantially on June 21.
On June 21, 2023, the Company announced an updated Mineral Resource estimate that includes a significant increase in the laterite, saprolite and saprock (collectively "oxide") Mineral Resources, and an initial sulphide Indicated Mineral Resource estimate for the Anaconda Area. (press release)
The low-cost Fekola Complex in Mali is expected to produce between 580K and 610K ounces of gold in 2023 at cash operating costs of between $565 and $625 per ounce and all-in sustaining costs of between $1,085 and $1,145 per ounce.
BTG Fekola Quarterly Production History (Fun Trading)
4.1.2 - The Masbate Mine In The Philippines:
Gold production from the Masbate Mine was 49,478 Au ounces in the Second quarter of 2023. The Masbate Mine in the Philippines is expected to produce between 170K and 190K ounces of gold in 2023 at cash operating costs of between $985 and $1,045 per ounce and all-in sustaining costs of between $1,370 and $1,430 per ounce .
BTG Masbate Quarterly Gold Production (Fun Trading)
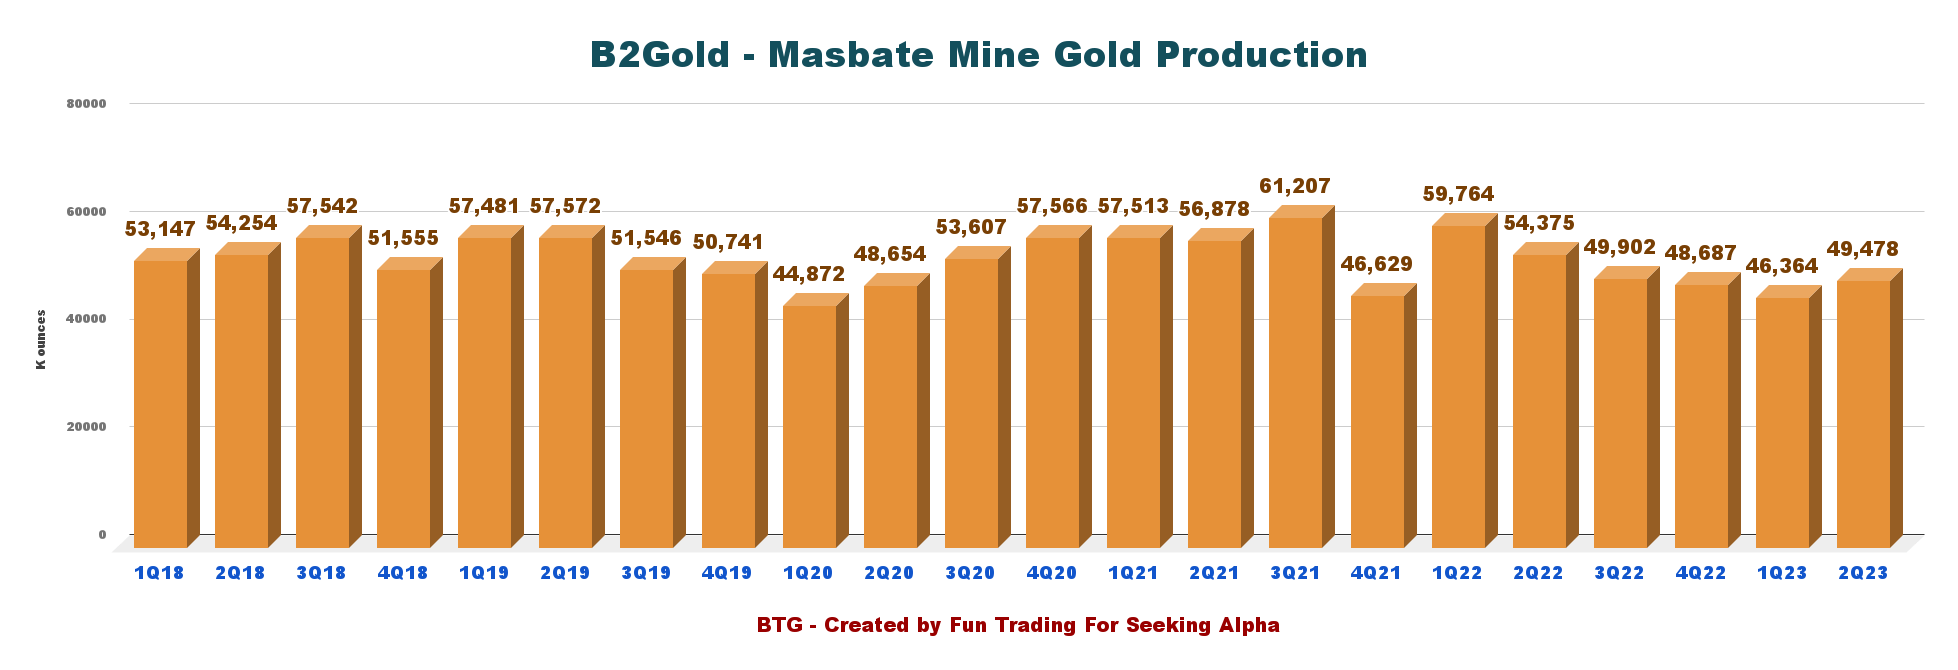
4.1.3 - The Otjikoto Mine In Namibia:
BTG Otjikoto Production History (Fun Trading)
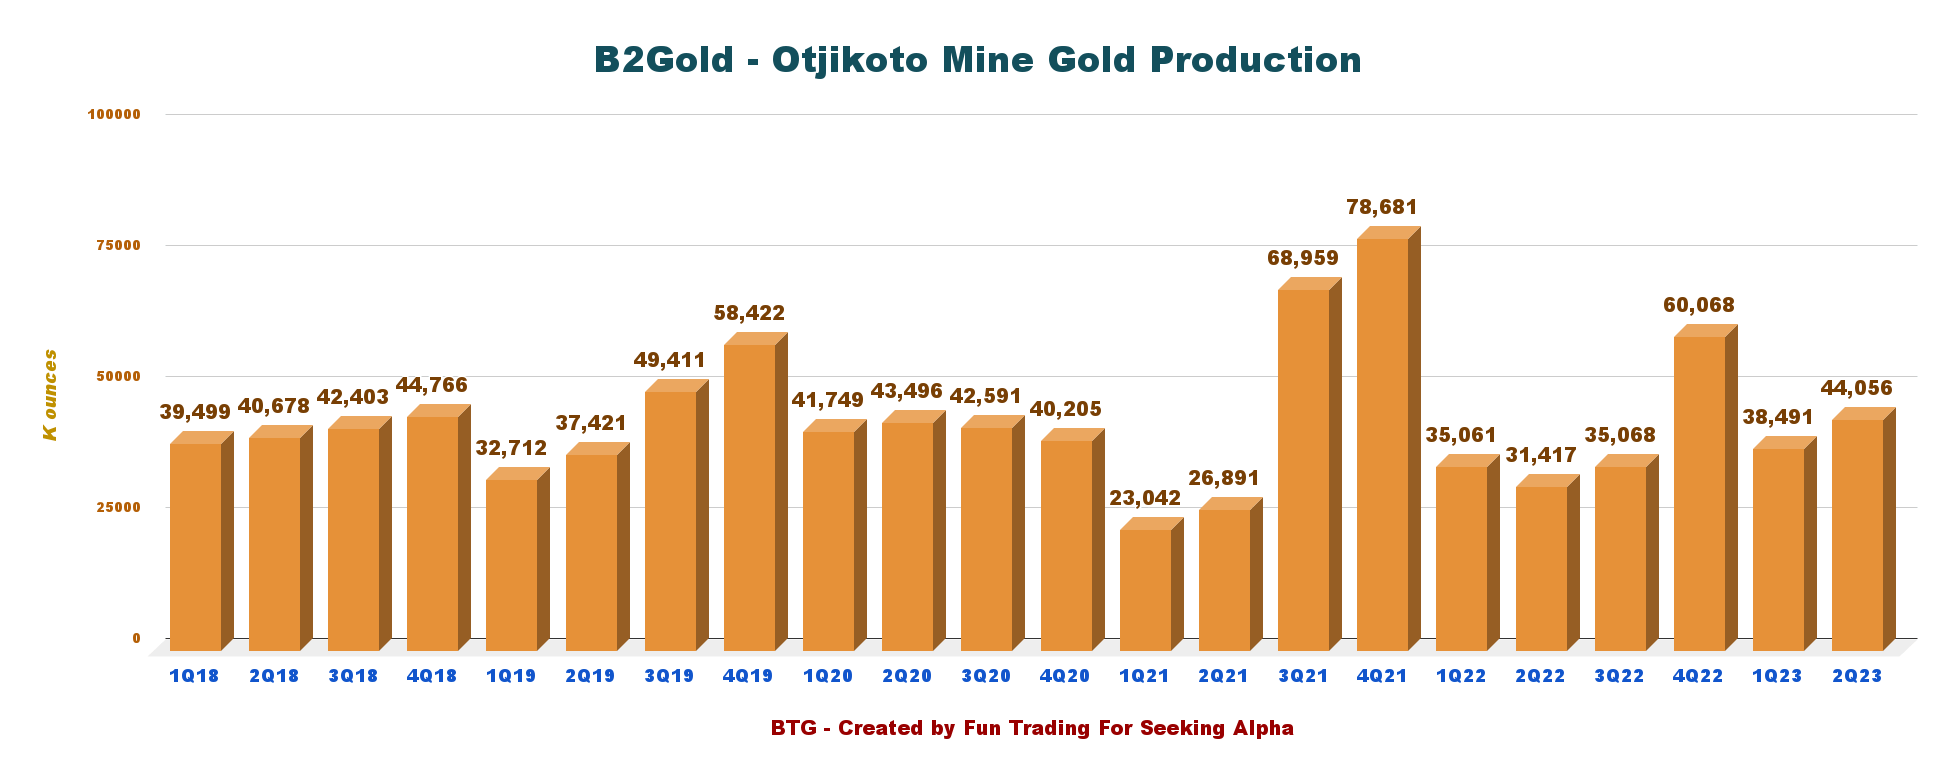
Gold production from the Otjikoto Mine was 44,056 ounces in the second quarter of 2023.
The Otjikoto Mine in Namibia is expected to produce between 190K and 210K ounces of gold in 2023 at cash operating costs of between $590 and $650 per ounce and all-in sustaining costs of between $1,080 and $1,140 per ounce.
4.2 - All-in Sustaining Costs AISC and gold price history
BTG Quarterly Gold Price and AISC History (Fun Trading)
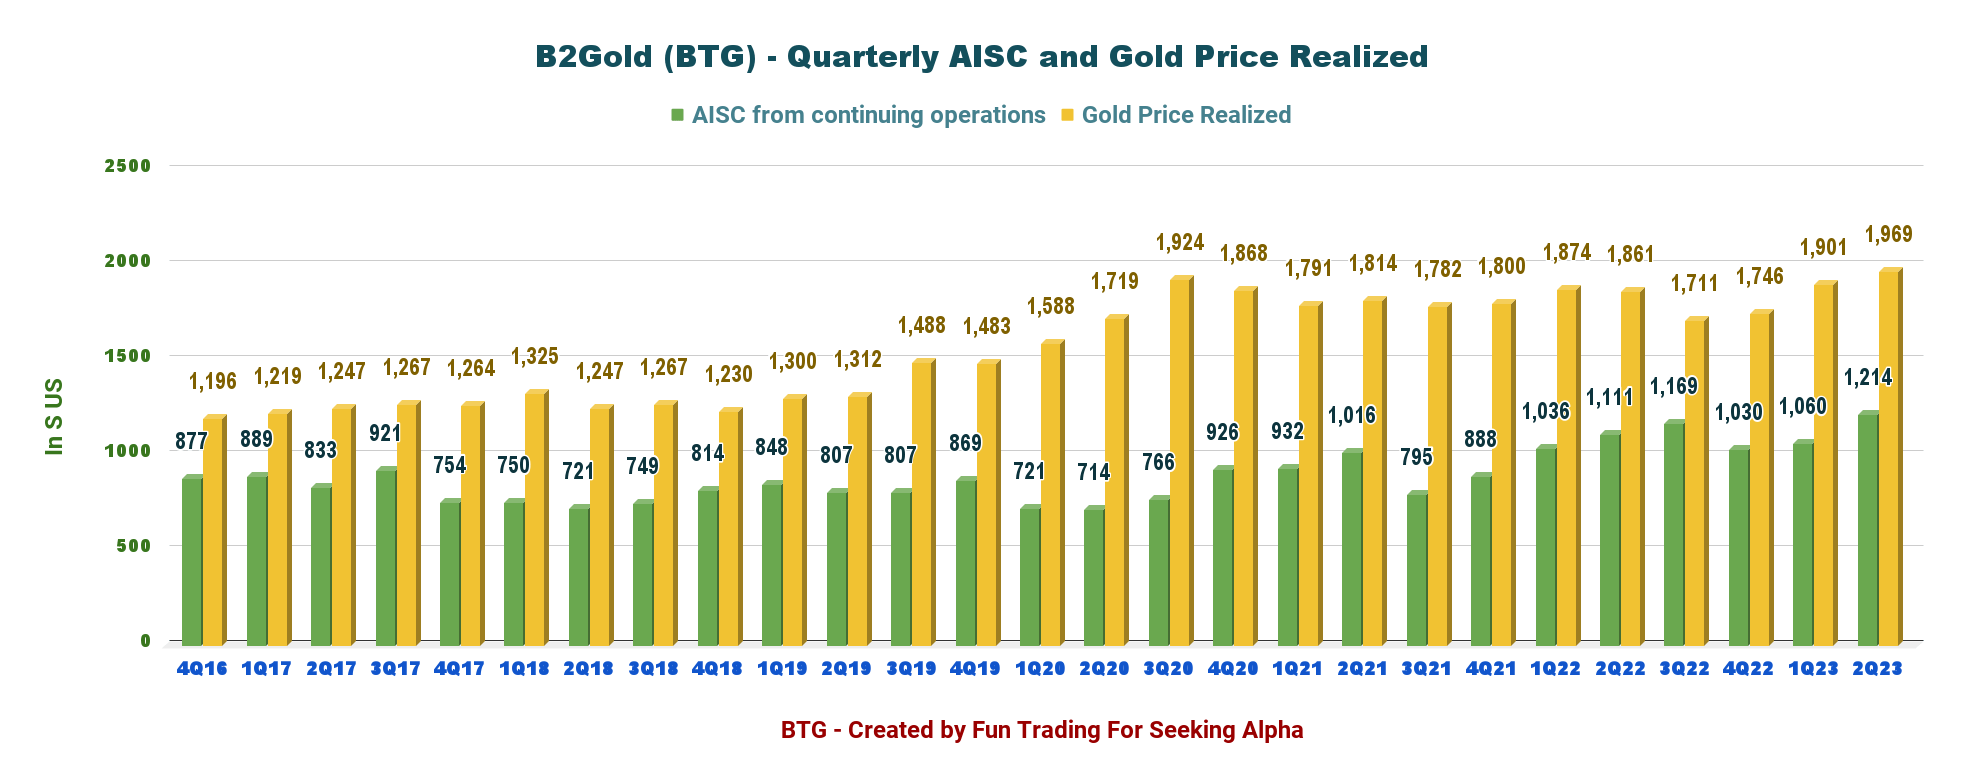
The AISC for 2Q23 increased significantly from $1,060/Oz in 1Q23 to $1,214/Oz in 2Q23.
The gold price in 2Q23 averaged $1,969 per ounce , above the $1,901 per ounce realized the previous quarter.
4.3 - 2023 Outlook (Unchanged)
B2Gold expects to continue its strong operational performance in 2023, with total gold production forecast to be between 1 Moz and 1.08 Moz (including 60K to 70K attributable ounces from Calibre).
The Company's total consolidated cash operating costs for the year (including estimated attributable results for Calibre) are expected to be between $670 and $730 per ounce , and total consolidated AISC (including estimated attributable results for Calibre) will be between $1,195 and $1,255 per ounce .
Part III - Technical Analysis And Commentary
BTG TA Chart Short-term (Fun Trading StockCharts) Note: The chart is adjusted for the dividend.
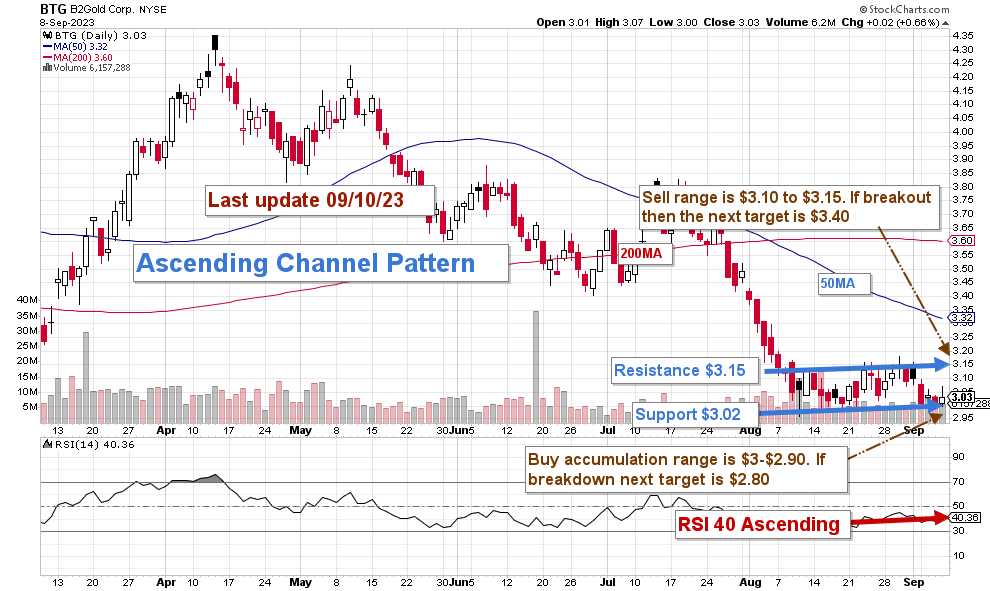
BTG forms an Ascending channel pattern with resistance at $3.15 and support at $3.02. RSI is 40 now, which starts to be slightly oversold.
An ascending channel is a technical analysis pattern comprising a series of higher highs and higher lows. It indicates a bullish market sentiment and a gradual upward price movement.
The dominant strategy is to keep a core long-term position and use about 50%-60% to trade LIFO while waiting for a higher final price target to sell your core position.
This strategy is perfectly adapted to BTG, letting you trade the short-term volatility and get a good dividend for your long-term position. I remind the readers that the dividend yield is now over 5%.
Short-term strategy: I recommend selling B2Gold Corp. partially between $3.10 and $3.15 , with higher possible resistance at $3.40 . However, waiting for another retest of the 200MA at $3.60 is more reasonable.
Conversely, buying back on any weakness between $3 and $2.90 is reasonable, with possible lower support at $2.80.
Watch gold like a hawk.
Warning: The TA chart must be updated frequently to be relevant. It is what I am doing in my stock tracker. The chart above has a possible validity of about a week. Remember, the TA chart is a tool only to help you adopt the right strategy. It is not a way to foresee the future. No one and nothing can.
For further details see:
B2Gold: I Find It Unfairly Valued By The Market