BCLYF - Barclays: Post Result Price Dip Offers Value Opportunity
Summary
- Barclays shares fell sharply following the release of a 4Q22 result that included softer numbers for the Barclays International division, driven by lower Markets income.
- Competitive forces are dampening UK net interest margin expansion, but interest rate leverage remains a positive factor for earnings.
- Management is targeting an FY23E RoTE of at least 10%.
- Trading at ~60% of NTA, Barclays offers strong upside potential.
Introduction
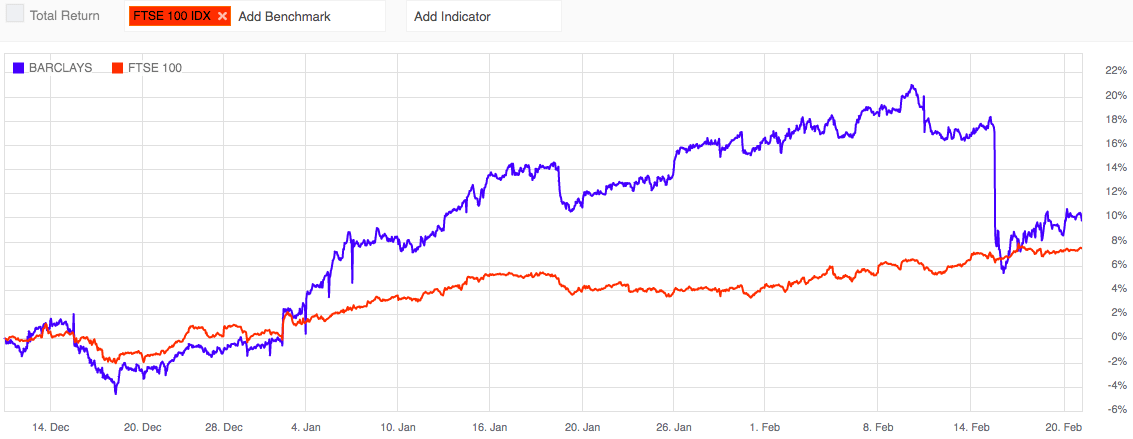
Back in December 2022, I published a strong buy call on Barclays PLC ( BCS ), with the stock at that time trading around 160p on the London Stock Exchange. The share price performed well post-publication, closing at 187.32p on 14 February 2023 (the day prior to the BCS 4Q22 result release) delivering a return of ~17%, which was around 10% above the return on the FTSE100 index over the same period. Disappointingly, the 4Q22 result erased all of the excess gains relative to the FTSE100, although it is worth pointing out that the closing price on 15 February 2023 remained 7.8% above my strong buy base price of ~160p. In this note, I will comment on aspects of the 4Q22 result materials that caught my eye, including items that may have contributed to the market's initial negative reaction (down ~8%) to the company update.
Barclays International CIB - 4Q22 Soft Versus Consensus Expectations
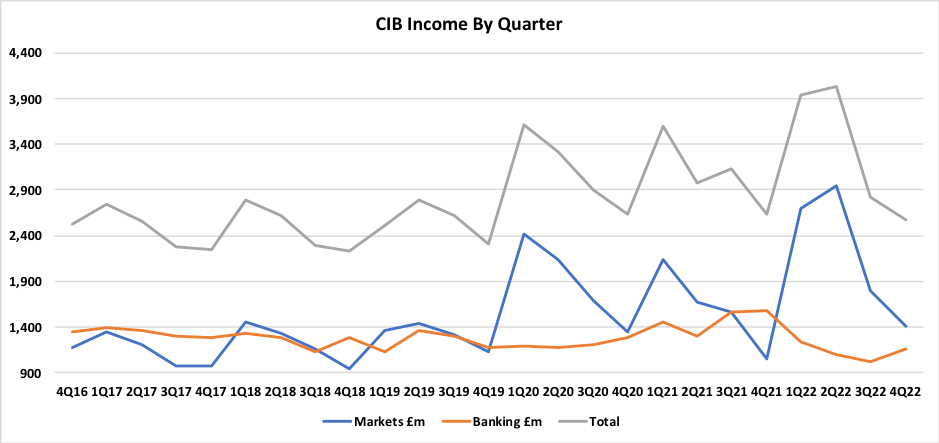
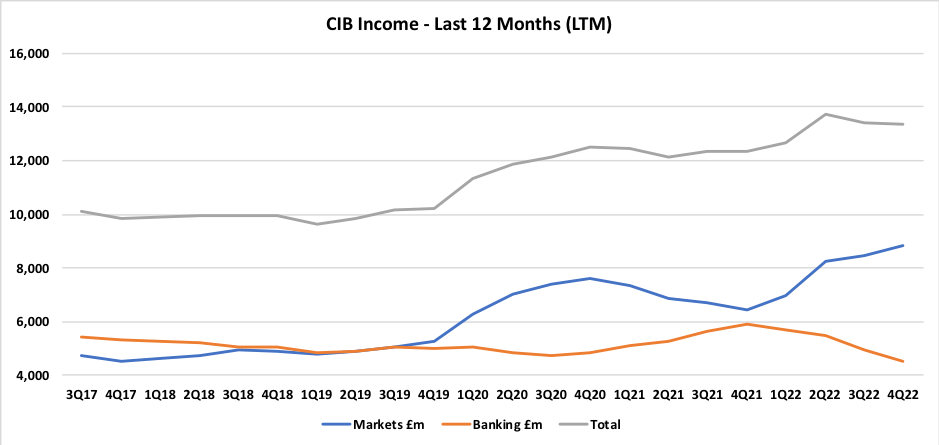
Corporate & Investment Bank, CIB, sits within the Barclays International segment. CIB's largest business line (measured by income) is Markets; over the last six years, Markets has on average generated ~54% of total CIB income. I have been writing for some time that Markets income has been running at high levels relative to historical results. Exhibit 1 plots quarterly income for CIB's Markets and Banking reporting lines. Exhibit 2 looks through some of the quarterly volatility and shows CIB income on a last-twelve-month basis. The step-up in Markets income relative to the pre-COVID-19 era is clear in both cases.
Exhibit 1:
Exhibit 2:
Markets income was exceptionally strong in 1H22; compared with the average of 1H20 and 1H21, 1H22 Markets income was 35% higher. Results for 3Q22 and 4Q22 show clear signs of moderation; compared with the average of 2H20 and 2H21, 2H22 Markets income was ~14% higher. This analysis should not be taken too negatively. The Markets business still looks to be in good shape - but I think that the slowing in Markets income in 2H22 is likely to have been a disappointment relative to market expectations. Based on the most recent consensus estimates published by BCS (analyst forecasts as at 03 February 2023), total forecast 4Q22 income for CIB was £2,821m. The actual 4Q22 CIB income of £2,576m came in ~8.7% below consensus.
Interest Rate Sensitivity Upside - Evidence of Competitive Pressures
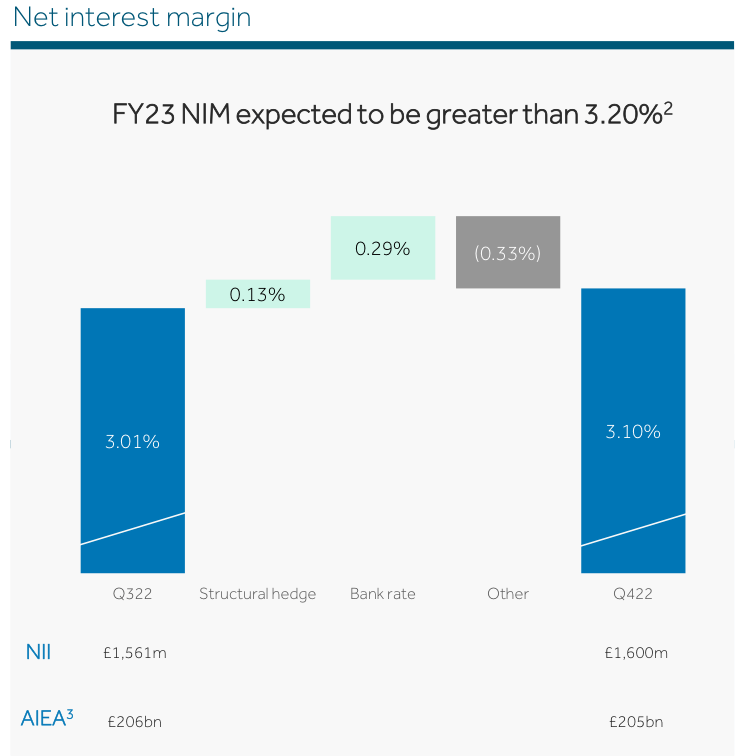
In previous Seeking Alpha notes, I have put forward a case that bulls pointing to massive anticipated future earnings growth from higher interest rates are probably being too optimistic. BCS once again provided a handy slide in the results presentation to promote the interest rate leverage bull argument (Exhibit 3).
Exhibit 3:
Barclays 4Q22 Presentation, Slide 11
Without repeating the whole argument, I remain of the view that a material chunk of the illustrative additional income highlighted in this chart will not fall to the bottom line, due to the influence of:
- Competition will drive 'reinvestment' of the ROE boost into lower product pricing in order to gain market share (or to support other growth metrics).
- Leakage from additional income into higher staff remuneration and investment spend, particularly relating to technology.
- Second order drags from the impact of higher interest rates on bad debt costs and softer system-wide credit growth.
Of these influences, I see competition as being the dominant factor. I should also add that the influence of the third bullet point (lower credit growth) can also act to increase competitive tension further, as banks will often compete more aggressively for borrowers in a slowing market.
Exhibit 4:
Exhibit 4 above summarises the quarterly change in NIM for BUK (the group's UK retail and business banking division). During the period, BUK's NIM benefitted from interest rate leverage by +42bp. That's a huge improvement when the NIM starting point was only 301bp - a win for the bull story! But what about the 'Other' movement of -33bp? BCS CFO Anna Cross provided additional detail on this -33bp drag as follows (bold, my emphasis):
The NIM for the quarter was 310bps, up 9bps on Q3, as we saw further benefits from rates. This was moderated by product margin pressure, notably in mortgages , and effects from Treasury activities, which are all included in the Other category on the NIM bridge. We would expect to see similar pressures in Q1 .
Source: Barclays 4Q22 Management Speech , page 12.
I agree with the CFO - it is sensible to expect competitive tension to continue to dampen gains from higher interest rates. The unknown factor of course is exactly how much of a dampening influence competition will ultimately deliver. Interest rate leverage remains a fair and valid bullish point for BCS, but as is almost always the case with banks - things are more complicated than they may initially appear to be.
Positioning for Higher Bad Debt Charges
In the 4Q22 management speech, CFO Anna Cross pointed to FY23E bad debt loss rate of 50bp to 60bp. This was the same range that the CFO referred to as the normal (or 'through-the-cycle') bad debt loss rate in the 3Q22 management speech. With management projecting FY23E bad debts in line with normal loss rates, is this really cause for concern? Personally speaking, I don't think so - indeed, I base my valuation on a bad debt loss rate above the CFO's range. But the FY23E guidance is well above the 30bp bad debt charge reported in FY22, and so some in the market may have been disappointed.
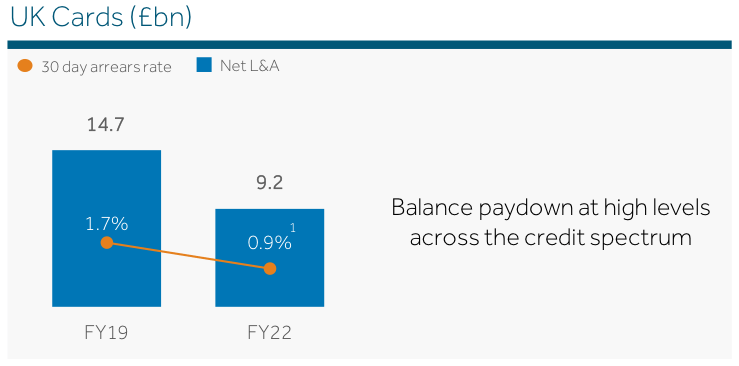
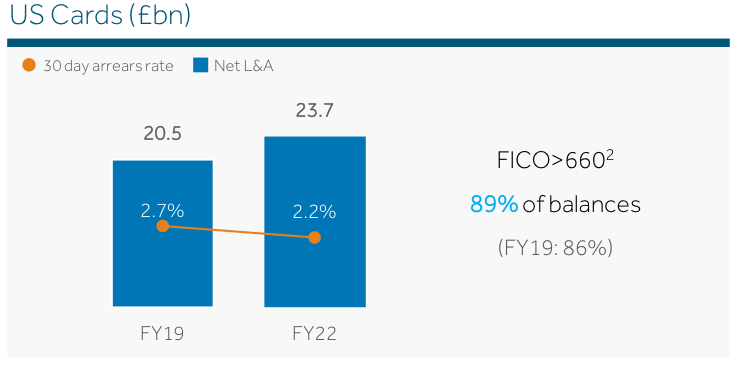
In a typical bad debt cycle, credit cards will usually be a source of significant pain for banks. When modelling for economic downturns, my base case is to allow for a peak credit card bad debt loss rate that is 2x the normal credit card loss rate. From an income perspective, the shrinking of BUK's credit card business relative to pre-COVID-19 levels has been disappointing for BCS. In contrast, looking at things through a bad debt risk lens, the smaller UK credit card loan book can be seen as a relative positive as we head into what seems likely to be turbulent economic conditions. The US credit card book has expanded relative to FY19, mainly due to the addition of £2.7bn relating to the Gap Inc portfolio acquisition. I would expect that the US cards business will incur material bad debt costs in an economic downturn scenario, but the starting point in terms of arrears offers some comfort that the portfolio currently appears to be reasonably healthy from a credit quality perspective.
Other loan book areas that cause me concern in economic recessions include commercial real estate, CRE, and leveraged finance. At the lower quality end of the CRE spectrum, peak to trough property valuations can easily fall by 50% when times are tough. Leveraged finance and other opaque, higher-risk lending buckets are prime candidates for lumpy bad debt costs. BCS won't be able to totally dodge problem loans in CRE and leveraged finance, but I am slightly comforted by the small size of the BCS loan book exposure to CRE (4% of group loans) and the fact that BCS has halved leveraged lending commitments in 2H22.
Summary & Conclusion
The market was clearly disappointed with certain aspects of the BCS 4Q22 results. The areas of 4Q22 weakness that I have identified were, for the most part, already captured in my normalised valuation framework for the stock. From my perspective, therefore, the negatives in the 4Q22 result have not materially impacted the investment case for BCS.
BCS remains well capitalised, with a CET1 ratio of 13.9%. The company has announced a £500m buyback , to commence 13 March 2023. For income-focused investors, using the FY22 total dividend of 7.25p (which has scope to increase), BCS is yielding ~4.1% pa. Note that at the time of writing, BCS is currently cum-dividend. The stock will shortly go ex-dividend, with a 5p per share dividend payable on 31 March 2023.
Based on the 20 February 2023 London Stock Exchange closing price of 175.88p, BCS is trading at ~60% of the company's reported 31 December 2022 TNAV of 295p per share. Management is targeting a RoTE of at least 10% in FY23E; should this RoTE target be achieved without the benefit of significant one-off gains, I would expect the current gap to TNAV to close materially. Although the share price has bounced nicely since my previous review, based on my fundamental analysis and valuation work, I continue to see a significant upside in the BCS share price. I am therefore comfortable with a strong buy on the stock at current levels.
For further details see:
Barclays: Post Result Price Dip Offers Value Opportunity