CA - Barrick Gold: Buy The Dips (Rating Downgrade)
Summary
- Barrick Gold Corporation suffered a second consecutive decline in its share price in 2022, ending the year down more than 40% from its 2020 highs.
- This can be attributed to a sharp decline in production and a minor guidance miss from an output standpoint combined with a significant increase in costs due to inflationary pressures.
- However, with 2022 likely to mark a trough for production and a peak year for unit costs, I see this as a margin inflection point.
- So, while I am not rushing to add exposure to my position in Barrick just yet, given that the stock is still above key support, I would view any pullbacks below US$16.70 as buying opportunities.
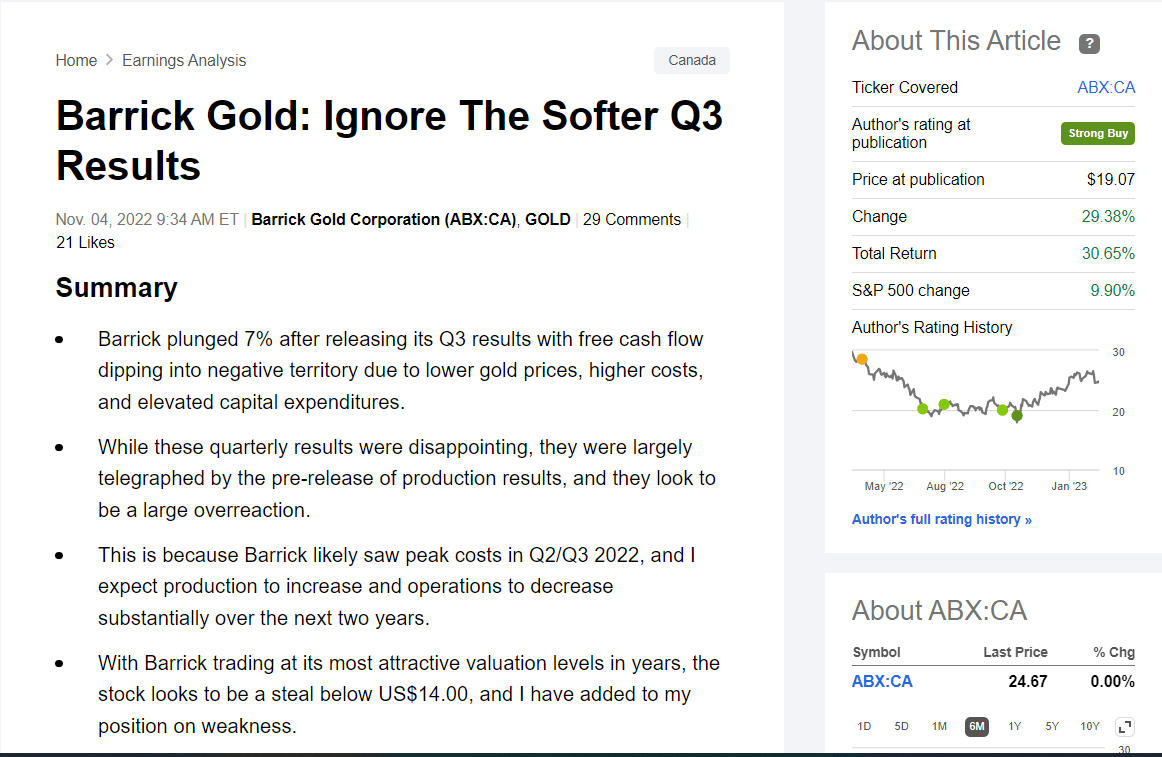
Just over three months ago, I wrote on Barrick Gold (GOLD) and gave it a Strong Buy rating, noting that although it reported disappointing Q3 numbers with a further spike in all-in-sustaining costs [AISC], this was largely priced into the stock below US$14.00. This is because the stock had found itself trading at less than 0.80x estimated P/NAV and just ~6.0x FY2023 cash flow estimates, a massive discount to its historical multiples of ~10.0x cash flow and north of 1.20x P/NAV. Besides, as highlighted in the update, 2022 was likely to mark a trough year for production and potentially peak unit costs, meaning the worst results were finally in the rearview mirror.
Barrick Gold November 2022 Article (Seeking Alpha Premium/PRO)
Most importantly, though, sentiment remained in the gutter and near its worst levels since 2018, when the gold price was below $1,300/oz. Since then, Barrick Gold has massively outperformed the market averages, up 30% even after its recent mild correction vs. a 10% gain for the S&P 500 (SP500). Unfortunately, the stock has seen a slight shift in momentum after releasing its Q4 results, but I don't see its marginal FY2022 guidance miss (~4.14 million ounces vs. ~4.2 million ounces) as a deal-breaker and believe investors should be careful not to miss the forest for the trees. Plus, the company's 2022 Investor Day update confirmed my expectations that production will trend higher post-2022 with improving costs. Let's take a closer look below:
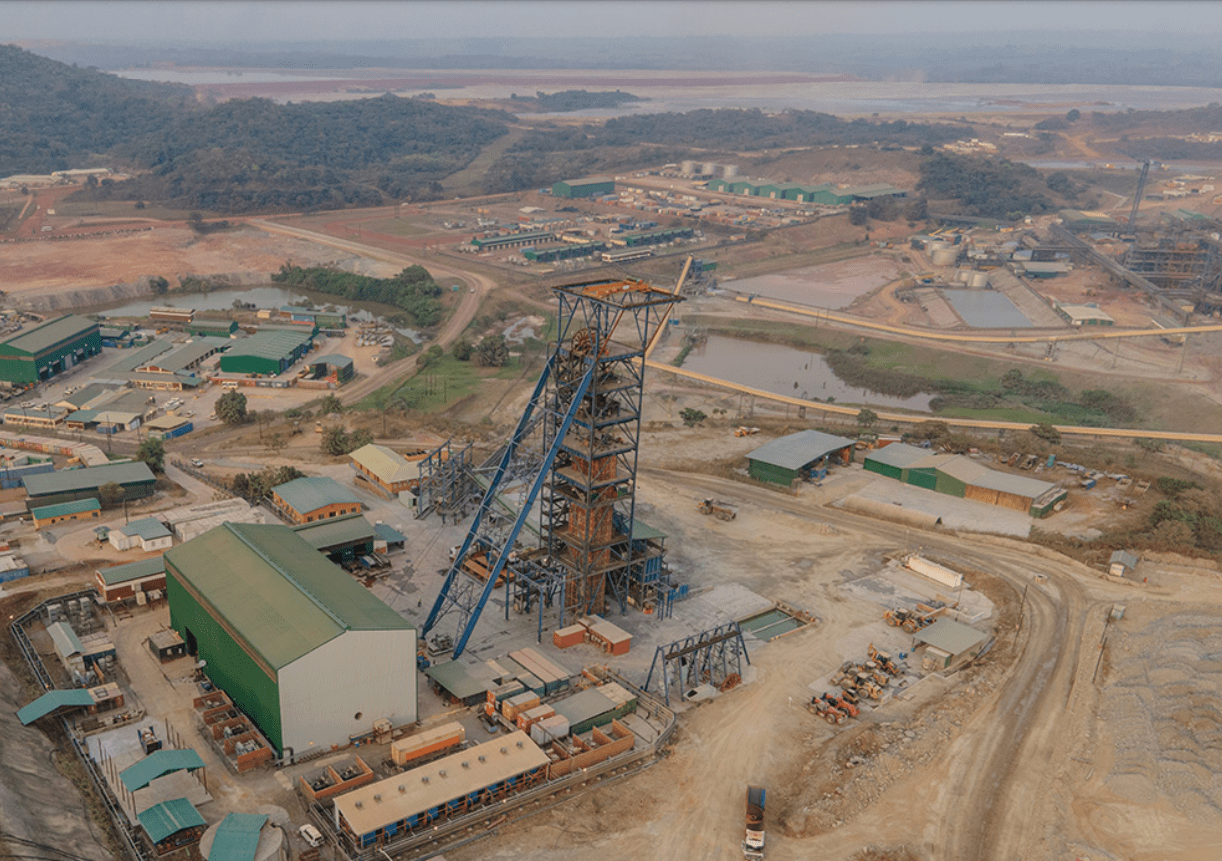
Barrick Gold Operations (Company Presentation)
Q4 and FY2022 Results
Barrick Gold released its Q4 and FY2022 preliminary results last month, reporting quarterly production of ~1.12 million ounces of gold and 96 million pounds of copper. Unfortunately, while this was the strongest quarter of the year, it resulted in Barrick coming in just below the low end of its FY2022 guidance of 4.2 to 4.6 million ounces of gold, which was a disappointment after meeting guidance for three consecutive years (2019, 2020, 2021) despite COVID-19 related headwinds in the latter two years. The good news is that copper production ended the year within guidance (420 to 470 million pounds) thanks to a solid year from Lumwana, offsetting the lower-than-planned production at Zalvidar.
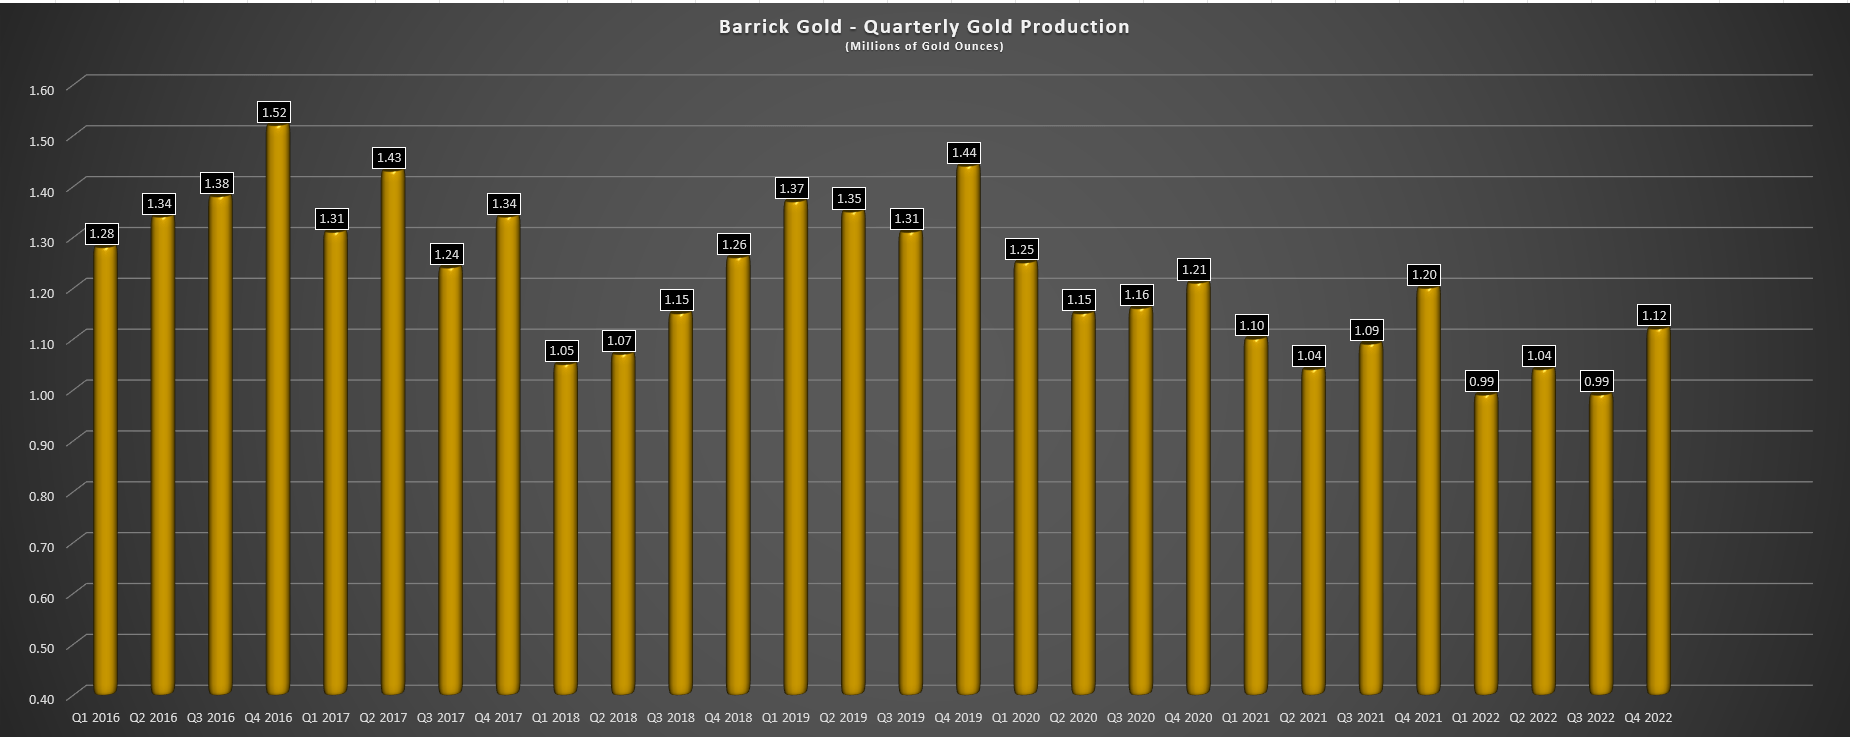
Barrick Gold - Quarterly Gold Production (Company Filings, Author's Chart)
Looking at the above chart of gold production likely doesn't inspire much confidence, with Barrick's quarterly gold production continuing to trend lower on a trailing-twelve-month basis and peak quarters (Q4) continuing to be less robust, evidenced by Q4 production down more than 20% on a three-year basis (~1.12 million ounces vs. ~1.14 million ounces). However, it's worth noting that this is partially due to Porgera being offline, operations winding down at Long Canyon, and the sale of its stake in KCGM (Australian Super Pit). After adjusting for this ~150,000-ounce headwind, production is not down nearly as much as it appears to be, and this was despite dealing with supply chain headwinds and a tighter labor market.
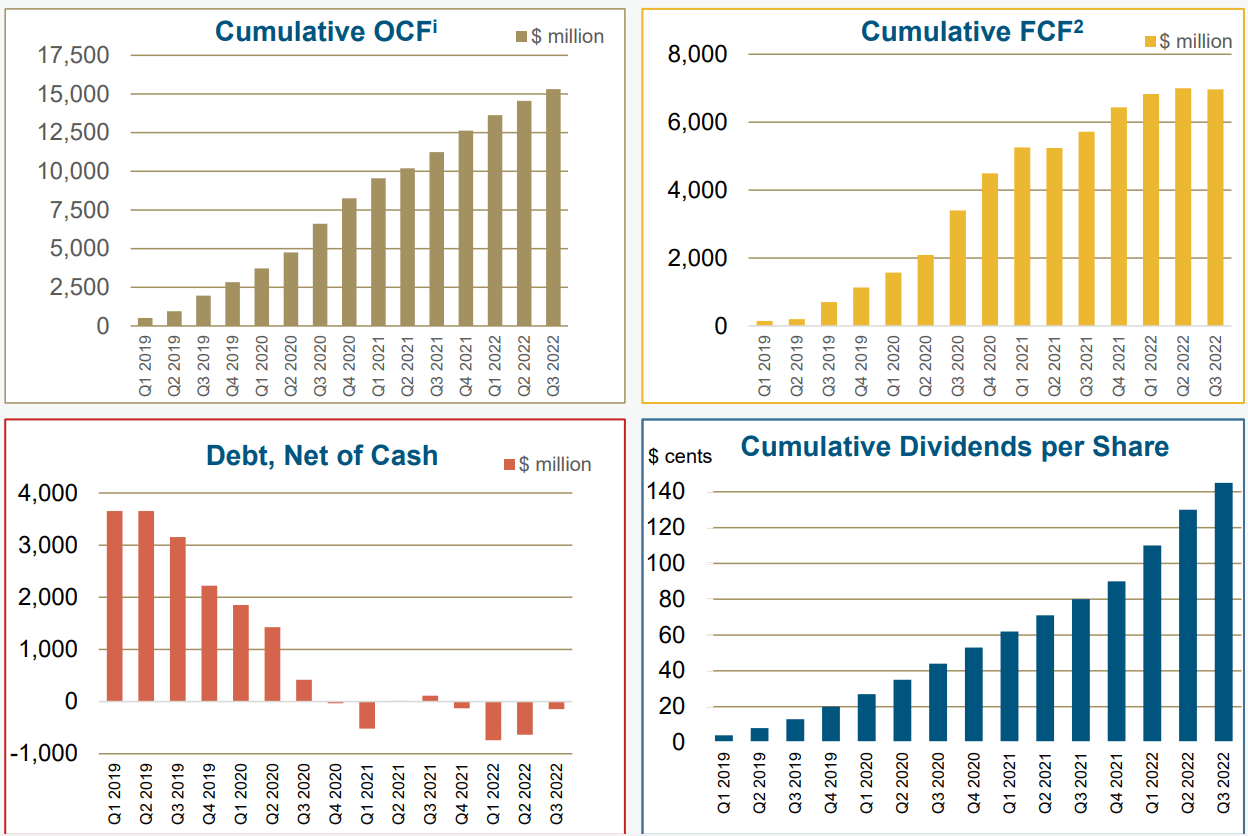
Barrick Gold - Cash Flow, Dividends & Balance Sheet (Company Presentation)
Despite the lower gold production in 2022 and the impact of much weaker gold prices in Q2 through Q4, Barrick continues to have a very profitable business model and has done a phenomenal job of strengthening its balance sheet under its new CEO, Mark Bristow. The above charts are evidence of this, with cumulative free cash flow of $6.0+ billion over the past four years despite considerable investment to position the company's portfolio for the future, allowing Barrick to move from a significant net debt position to a net cash position during 2022. Notably, the company's returns to shareholders have also increased considerably, with Barrick doing regular opportunistic buybacks last year (0.5% of float repurchased in Q3 2022 alone) and significantly increasing its dividend.
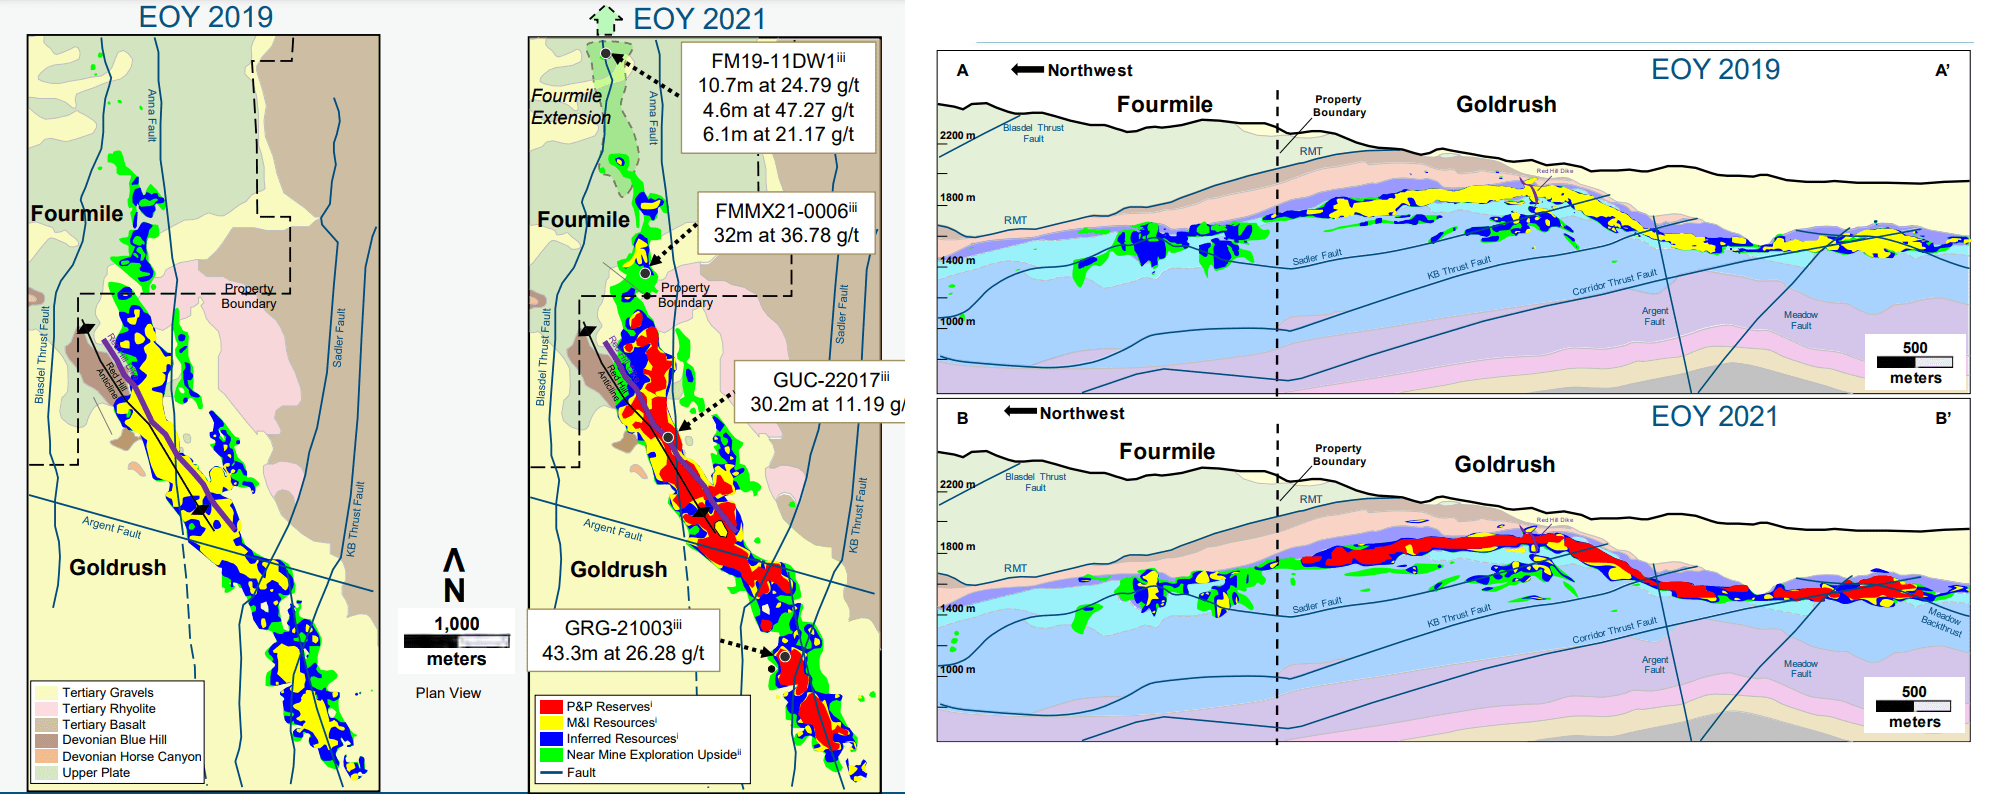
Goldrush/Fourmile 2019 vs. 2021 - Cortez Complex (Company Presentation)
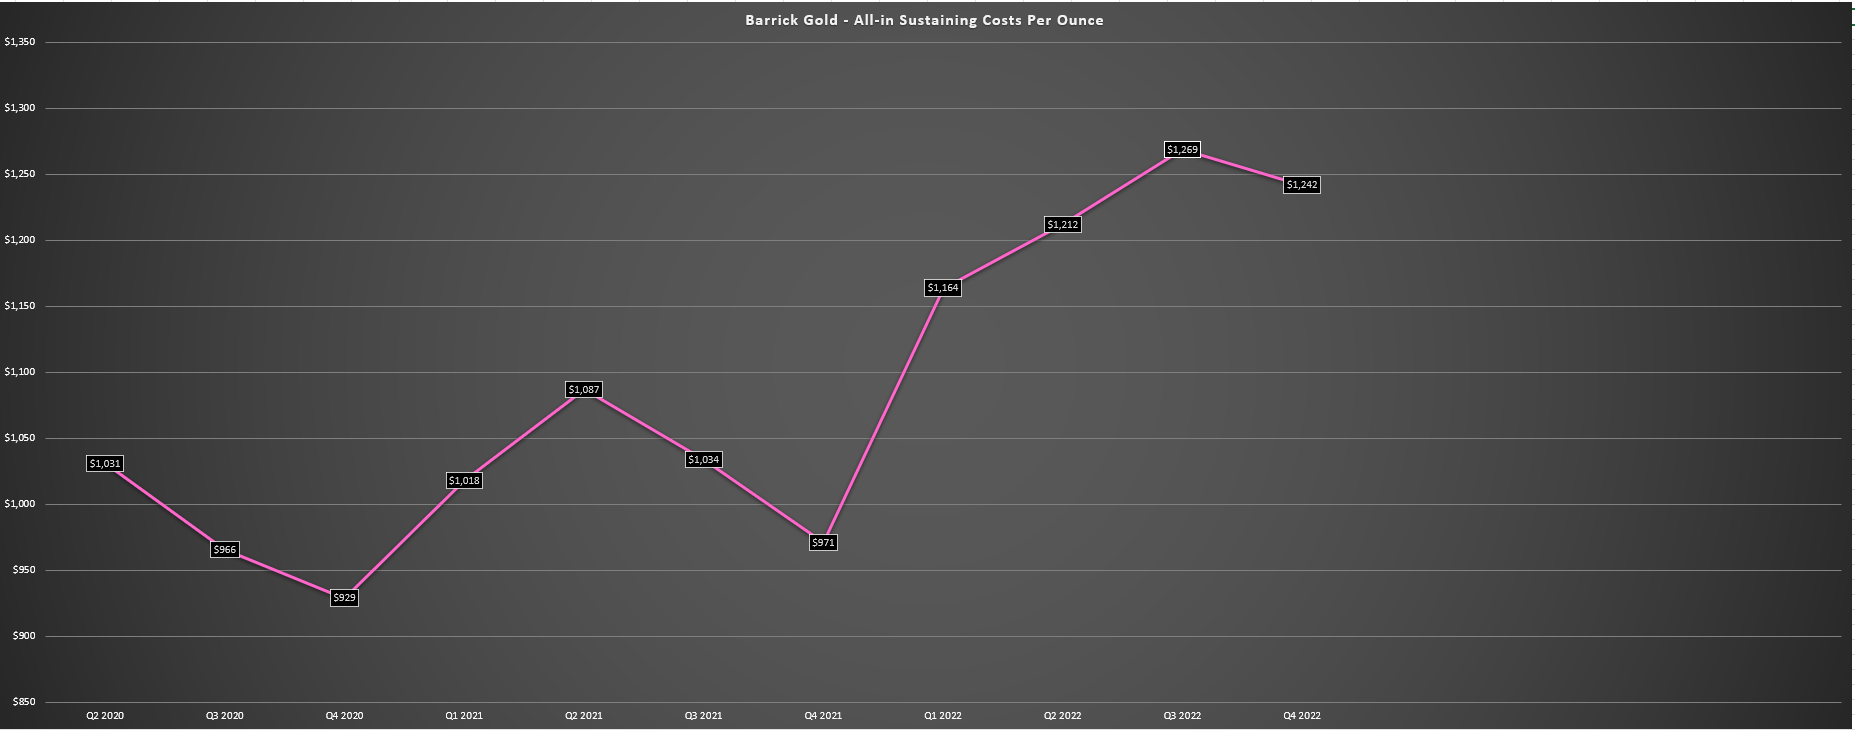
Although the consistent cash flow generation despite weaker gold prices and growth in resources/reserves plus new discoveries (Kibali 11000 Lode, Fourmile northern extensions) are encouraging, it's been overshadowed by cost performance and margin worries. This is understandable, with sector-wide AISC up more than 25% vs. 2019 levels. Plus, many companies are likely to report even higher AISC next year (2023 vs. 2022) if they haven't been able to invest in optimizing their assets like Barrick and other majors. Although Barrick is working to reverse this trend, and the rising oil price had a considerable impact on costs in 2022, the cost creep has shown up in its results as well, with Q3 2022 AISC spiking to $1,269/oz and guided to come in near $1,240/oz in Q4 2022.
Industry Average Cash Costs, AISC, AISC Margins (Company Filings, Author's Chart & Estimates)
Looking at the below chart of Barrick's unit costs, one wouldn't be faulted for being pessimistic about the company, given that a combination of declining output and rising costs is the opposite of what investors want to see when it comes to growing cash flow and earnings per share. However, as I've noted in past updates, Barrick's AISC was elevated in FY2022 due to elevated sustaining capital spending. Adding insult to injury, its costs looked even worse due to a brief parabolic rise in oil prices, higher steel, cyanide, and reagents costs, and supply chain headwinds. Finally, this was exacerbated by elevated sustaining capital and cost of sales being divided by a lower denominator and the company's lowest annual production in two decades.
Barrick Gold - All-in Sustaining Costs (Company Filings, Author's Chart)
This triple-whammy (elevated sustaining capital of ~$1.52 billion in Q1-Q3 vs. ~$1.24 billion in the same period in 2021), plus inflationary pressures combined with a lower denominator has led to a temporary blow-out in Barrick's operating costs and them looking artificially worse than they truly are. However, with the benefit of increased production in 2023 (Porgera, Pueblo Viejo, Hemlo, Cortez Complex, Turquoise Ridge), lower energy prices, an improved supply chain, and the possibility of a slight dip in sustaining capital, I would expect all-in-sustaining costs to drop at least 2% to ~$1,190/oz (FY2022 estimates: $1,215/oz), and continue to decline over the next several years. Let's take a look at the company's mid-term and long-term outlook provided in its recent Investor Day Presentation:
Mid-Term & Long-Term Outlook
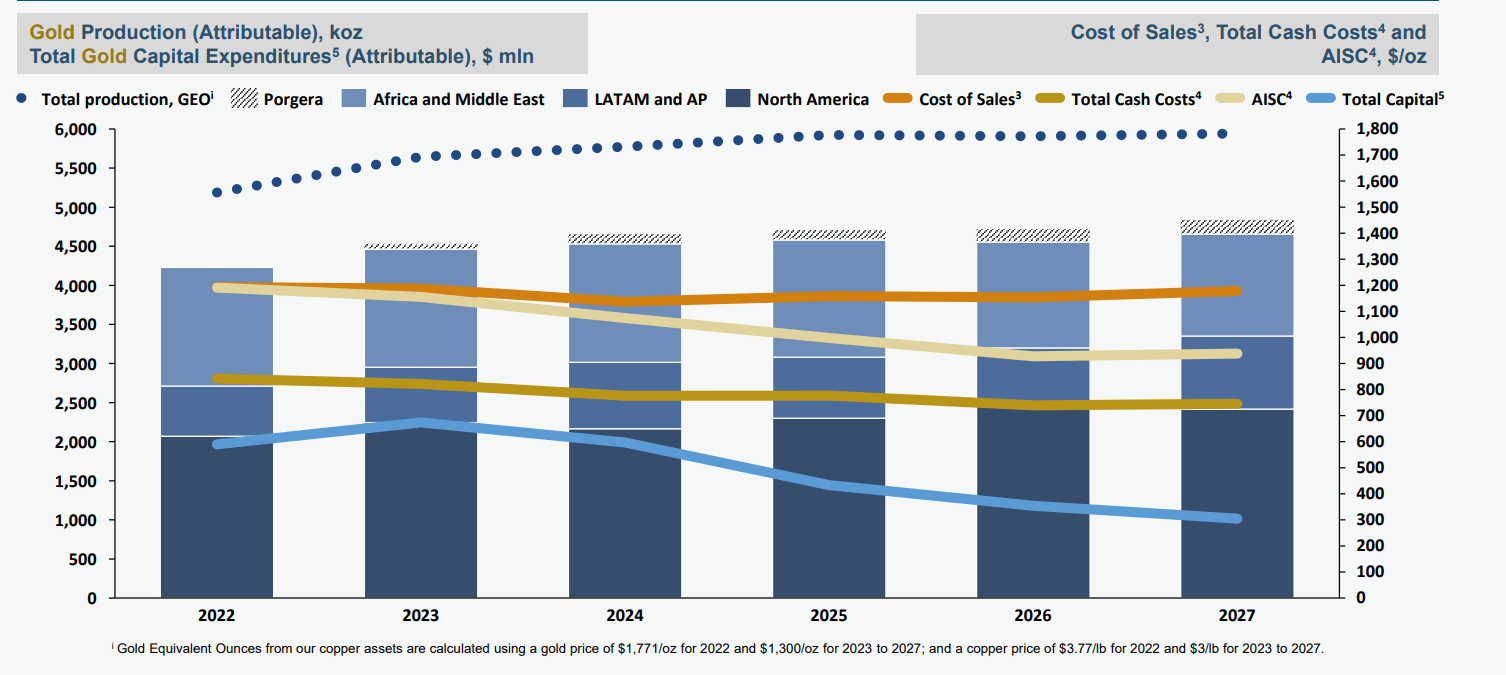
As the chart below shows, Barrick's attributable 2022 gold production of ~4.14 million ounces is expected to mark a trough based on its most recent 5-year outlook, with gold production expected to increase to ~4.4 million ounces in 2023, ~4.5 million ounces in 2024, and closer to ~4.6 million ounces in FY2025. This will be driven by increased production from the Cortez Complex with Goldrush (assuming the timely receipt of the Record of Decision), its Pueblo Viejo Expansion, its third shaft completion at Turquoise Ridge, and a better outlook at Hemlo, which has had two tough years. Hence, even if sustaining capital and costs remained constant, unit costs would already decline due to the higher denominator.
Barrick Gold - 5-Year Outlook (Company Presentation)
However, Barrick has the benefit of bringing on lower-cost production from its ultra-high grade Goldrush ore body at its Cortez Complex, and I would expect 2022/2023 to mark peak capital spending and, importantly, sustaining capital spending based on the above chart, with sustaining capital likely to decline slightly year-over-year and fall further in 2024. Of course, this assumes that inflationary pressures don't worsen, and we see some relief from a cost standpoint on fuel and consumables costs. Based on commentary from some companies, this doesn't appear to be a stretch, and it looks like we're past the worst of the inflationary pressures. One example was on the Agnico Eagle ( AEM ) Q3 Earnings in November (with this coming from a company that is typically quite conservative), where CEO Ammar Al-Joundi stated the following:
Question:
"Can I just ask on - sorry, consumables, we've seen any relief on consumables, obviously, not fuel we are, but any other consumables that you're seeing relief on that's not oil based?"
Ammar Al-Joundi
Well, I can make a quick comment. We - I get these updates all the time. Tanya, I can tell you, that over the last week are the first time I've seen emails where people are saying, look, there's a little bit of relief. So, for example, in Finland, which has always been our highest inflation environment, they are actually seeing some relief on cyanide, on steel, and other consumables. They - to be fair, they had the biggest spike. So it's not surprising that they'd be at the vanguard of a possible relief. But we are starting to see it. I again, I just, so we are seeing some relief, but we are - our job is to hope for the best, but plan for the worst, and we're still all over it.
- Q3 Earnings Call, Agnico Eagle Mines
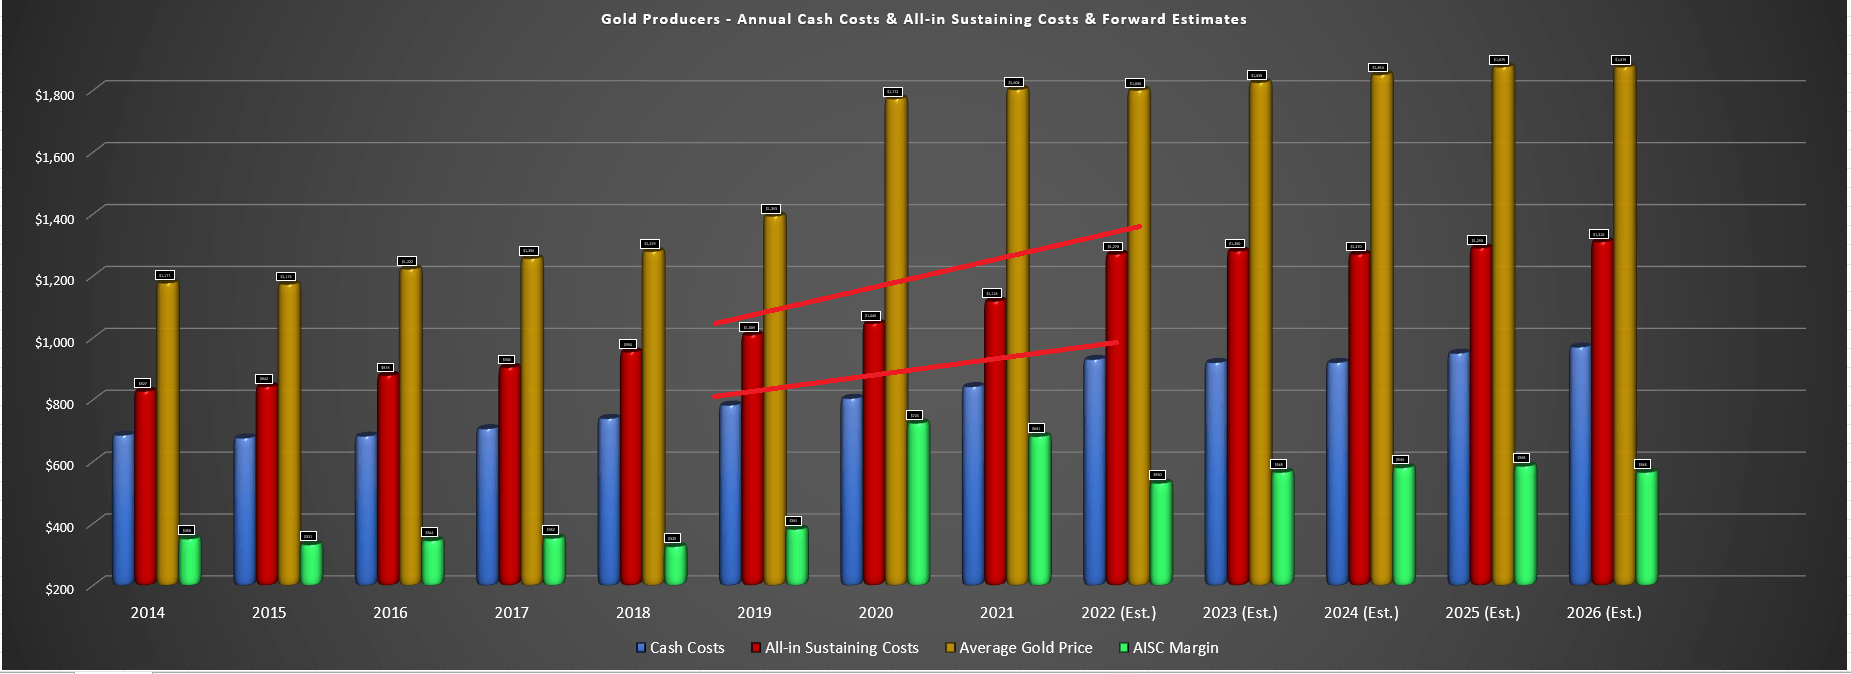
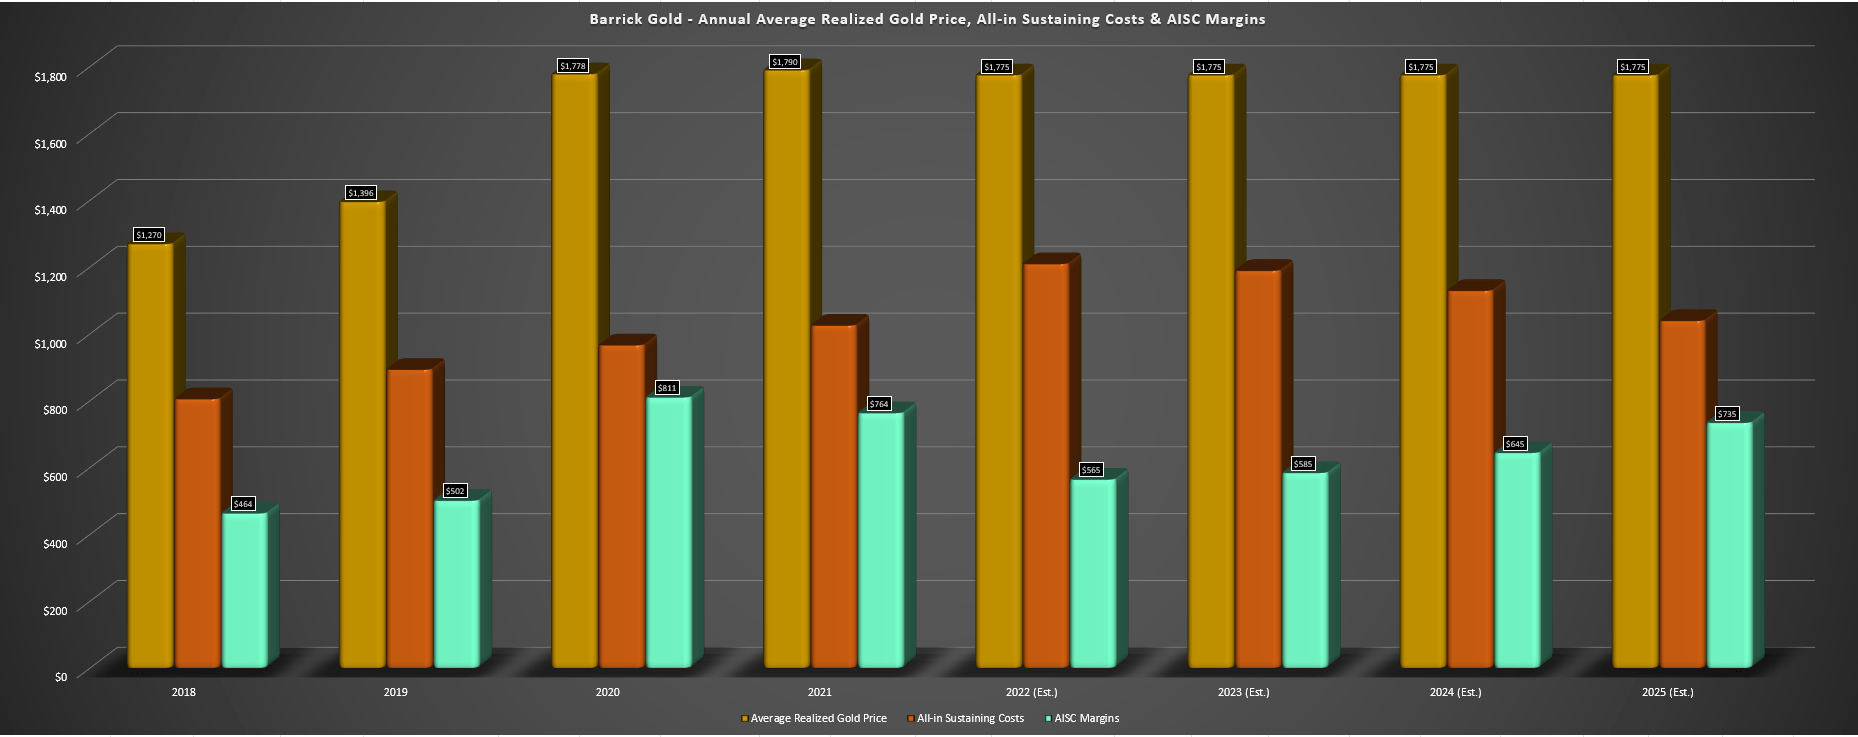
Given the combination of some relief in steel and fuel prices plus improved inventory levels for suppliers and higher production for Barrick, the below chart highlights what we could see for the company from a margin/cost standpoint directionally, with the caveat being that these estimates could be incorrect given that much depends on energy prices. As the chart below shows, Barrick's AISC margins are likely to improve from ~$550/oz to $570/oz in FY2022 (assuming a $1,775/oz gold price) to ~$585/oz in FY2023, ~$645/oz in FY2024, and $735/oz in FY2025, even if we assume a static gold price of $1,775/oz. This is based on the reasons noted above, with the company benefiting from the increased output, lower sustaining capital, and easing inflationary pressures/supply chain headwinds.
Barrick - Gold Price, All-in Sustaining Costs, AISC Margins & Forward Estimates (Company Filings, Author's Chart & Estimates)
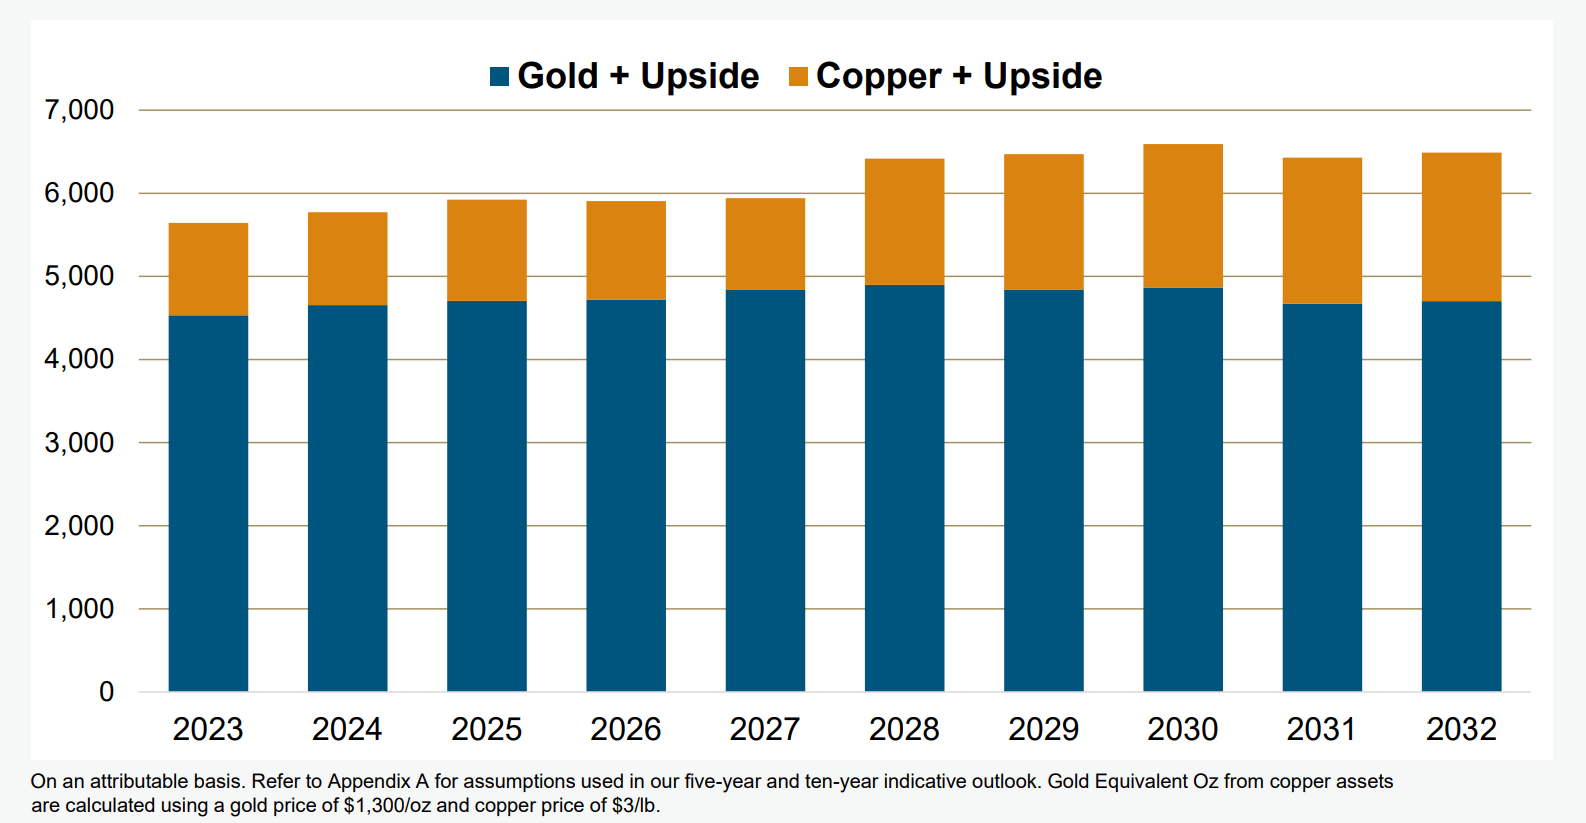
Assuming this view is correct, this would translate to a massive improvement in costs and margins, with AISC margins having the potential to rise 30% from FY2022 to FY2025 in a static gold price scenario or well over 40% if the gold price cooperates. I expect this to translate to a continued share price recovery after a brutal 12-year bear market for Barrick Gold, with the stock well off its 2018 lows at US$9.50 but still well below its recent highs of $31.20 per share. Given this outlook and the fact that Barrick's pipeline looks the best that it has in years, with Reko Diq alone having the potential to add ~140,000 ounces of gold and ~215 million pounds of copper (2028-2032) in what could end up being a very modest Phase 1 relative to the potential for 80 to 120 million tonnes per annum (~1.2 billion pounds of copper per annum on a 100% basis in the latter scenario).
Barrick - Long-Term Outlook & Upside (Company Presentation)
Finally, if we look at one of Barrick's most important charts that it provided in its recent Investor Day Presentation, we can see why the company has been so disciplined regarding M&A and hasn't rushed out to pay up for assets like Newcrest ( NCMGF ) did with Pretium (PVG), and Kinross ( KGC ) did with Great Bear. The reason is that, as highlighted above, Barrick has the potential to increase production to ~6.5 million GEOs by the end of the decade, all from within its portfolio, with this not even including the massive upside if it were to green-light the company's 50% owned Donlin Project in Alaska. Under the current study, I don't see Barrick rushing to develop Donlin. However, if it can be optimized and gold prices remain strong, there's a possibility that it could push total production north of the 7.0+ million GEO mark early next decade.
Barrick may not seem very exciting to investors with declining production and only one major new greenfield development project in the wings (Reko Diq). However, the production growth at existing assets is significant and adds up across the portfolio. This includes new satellite deposits helping to maintain production at its Carlin Complex, growth from Robertson and Goldrush (and possibly Fourmile) at Cortez, the massive Pueblo Viejo expansion that is near completion, and a much better outlook at Hemlo, which has been a drag on costs, but with studies underway on a potential larger open pit with first production by 2027. So, although Barrick may not be a growth story per se (given that production will return to previous levels vs. hitting new highs), it's certainly a recovery story and one where we could see meaningful growth in margins and output over the next several years.
Barrick - Historical Reserve Growth Through Exploration (Company Presentation)
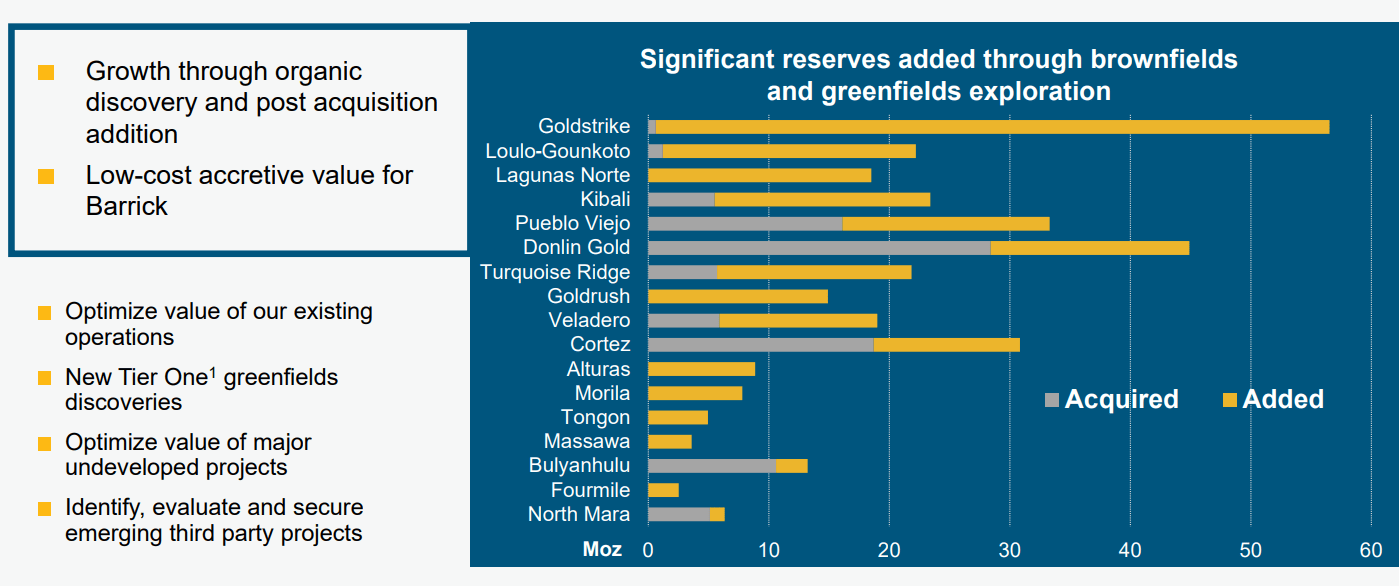
Finally, it's worth noting that in addition to cash flow per share growth due to the trend in rising production and margins (assuming gold prices stay above $1,750/oz), the company should also enjoy growth in net asset value per share and reserves per share. This is due to the company's share repurchase program consistently retiring shares combined with optimization work and exploration success across the portfolio and targeted greenfield exploration in new prospective regions (Japan, Egypt, Guiana Shield, Canada). So, although the Barrick of the past decade (pre-Randgold merger) left a lot to be desired, the Barrick of today is a much stronger and more agile company and is armed with a strong balance sheet to develop its pipeline without stretching itself as we have seen from other smaller producers.
Valuation
Based on an estimated 1756 million shares at year-end and a share price of US$18.50, Barrick trades at a market cap of $32.5 billion, which continues to be a very reasonable valuation for a company producing well over 4.0 million ounces of gold per annum and ~400 million pounds of copper, with upside to 700+ million pounds of copper and ~4.6+ million ounces of gold by 2030 (even without the massive 50% owned Donlin Project in Alaska). This places Barrick firmly in the position as the #2 gold producer globally, just ahead of Agnico Eagle ( AEM ) and behind Newmont ( NEM ) if we don't adjust for the fact that Barrick operates two of Newmont's larger contributors (Nevada Gold Mines and Pueblo Viejo).
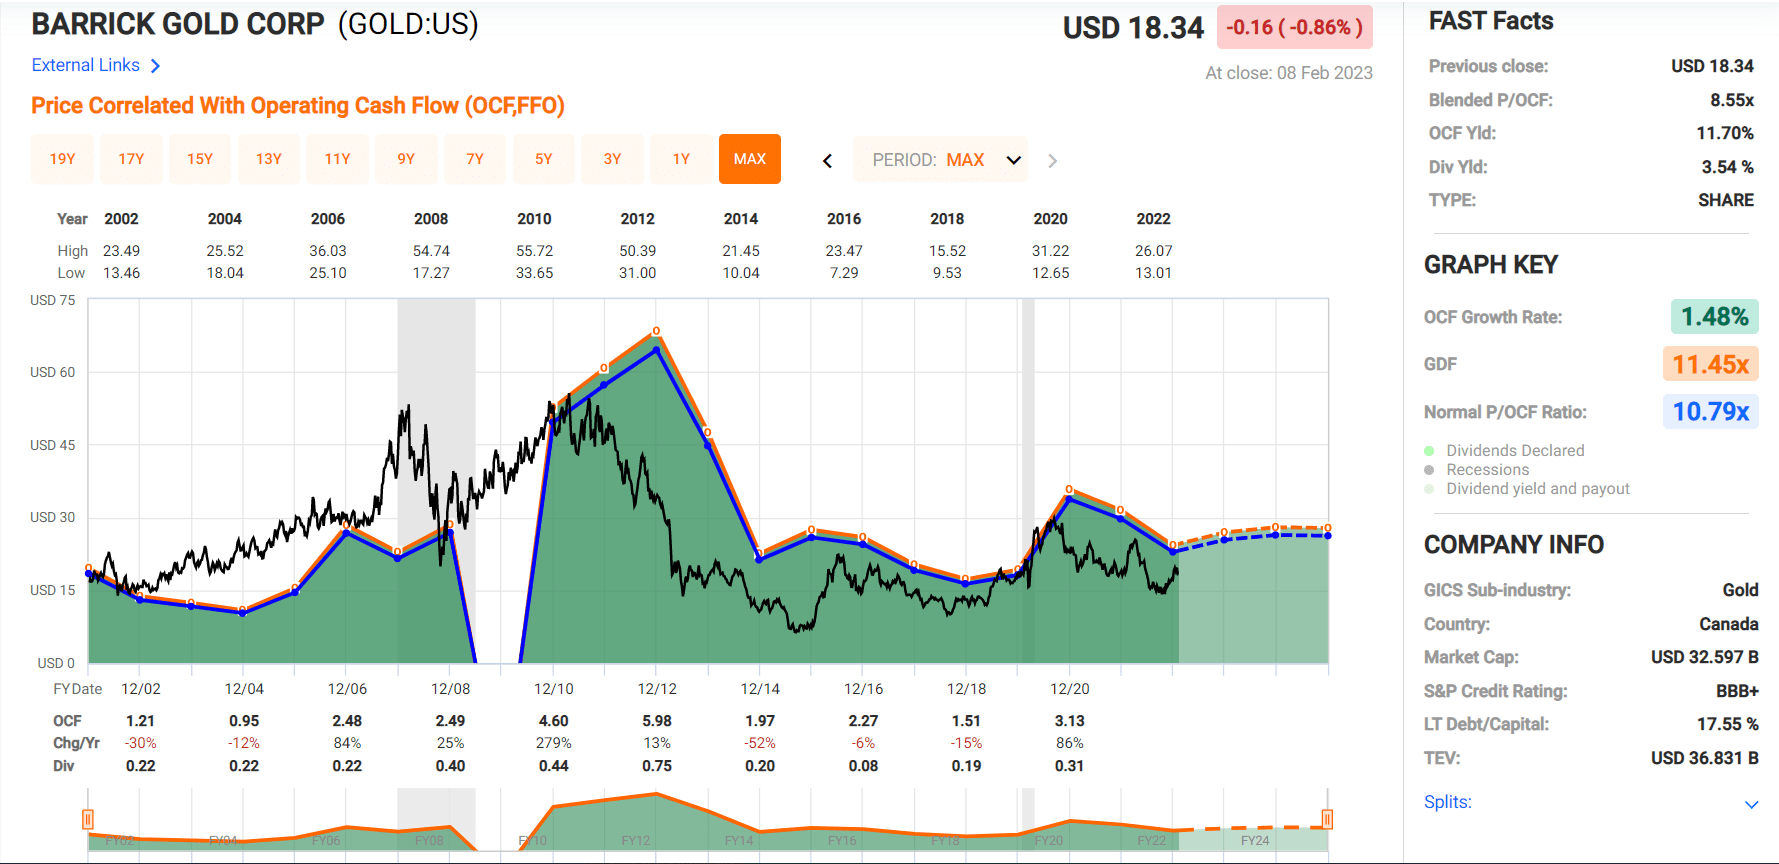
Barrick Gold - Historical Cash Flow Multiple (FASTGraphs.com)
Although Barrick is no longer sitting at the massive discount to fair value when I highlighted the stock as a Strong Buy at US$14.00 per share following its Q3 Earnings, Barrick continues to trade at a deep discount to its historical multiple (~10.8x cash flow). This is based on the stock currently trading at ~7.2x FY2023 cash flow estimates ($2.56), a 32% discount to its long-term multiple, and a 10% discount to its 10-year average (8.0x cash flow). Using what I believe to be a fair multiple of 10.0x cash flow to reflect the much stronger business today post-Randgold combination (increased diversification, stronger balance sheet, robust pipeline), I see a fair value for Barrick of $25.60, representing a 38% upside from current levels (~41% on a total return basis).
Although this represents a meaningful upside for a large-cap name, plus there is further upside to this price target given that these cash flow estimates are based on gold prices below spot levels, I prefer to buy at a minimum 35% discount to fair value. I do this to ensure an adequate margin of safety when owning cyclical names, which can be more volatile and where commodity prices can be unpredictable over the short term. After applying this discount to Barrick, the ideal buy zone for the stock is US$16.70 or lower. Hence, I do not see the stock in a low-risk buy zone. That does not mean the stock can't head higher, and that's just my own rigid criteria, given that I prefer to buy only when stocks are hated, not after 35% rallies.
Summary
Barrick Gold's transformation from a debt-heavy producer pre-Randgold merger continues to see immense progress. It is now one of the producers with the most generous capital returns to shareholders and a pristine balance sheet. However, perhaps most encouraging is that it continues to make new discoveries and optimize assets that should carry production well into the 2030s, and unlike some peers, Barrick has shown rigid discipline not to overpay for assets or stoop to buy mediocre assets simply because they're on sale and can lift overall production. This means that investors can sleep well at night, knowing that if they do wake up to the news of an acquisition by Barrick, it will likely be at the right price and counter-cyclical, and any deal is likely to be embraced by the market.
Unfortunately, many of the little things (supply chain optimization, increased productivity, resource/reserve growth, improved safety performance) have not shown up in the headline numbers, impacted by multi-decade highs for inflation, severe supply chain headwinds, and softness in the gold price. These are all out of Barrick's control, but as discussed, 2022 will likely mark a peak year for unit costs and a trough year for production, with headline numbers expected to improve meaningfully going forward. So, with Barrick Gold Corporation up against easy comps, and its worst year in the rearview mirror, I would expect any pullbacks below $16.70 to provide buying opportunities.
For further details see:
Barrick Gold: Buy The Dips (Rating Downgrade)