CA - Barrick Gold: Improving Value And Sound Trading Pattern
Summary
- Barrick Gold has been picking up buyers as gold, silver, and copper have rebounded in value since the summertime.
- I am forecasting a recession and rapidly declining interest rates during 2023 will send investors into a frenzy looking for defensive picks that benefit from new central bank money printing.
- Barrick today represents nice leverage to further gains in bullion quotes, propelled by steady and intelligent management of its diverse reserve/resource base located across the globe.
Barrick Gold ( GOLD ) has morphed from a so-so pick in the major gold/silver/copper mining sector into one of my favorites over the past year. Just today (February 9th), the company reported a material (and uncommon in the industry) 9% increase in proven reserves to 76 million ounces at a lowballed economic price assumption of US$1300 per ounce. According to the press release,
Barrick Gold Corporation grew attributable proven and probable gold mineral reserves by 6.7 million ounces net of depletion in 2022, while maintaining grade despite an increase in the reserve price assumption. Reported at $1,300/oz 1, attributable proven and probable mineral reserves now stand at 76 million ounces 2 at 1.67g/t, increasing from 69 million ounces 3 at 1.71g/t reported at $1,200/oz 1 in 2021. Led by Pueblo Viejo and the Africa & Middle East region, Barrick has now delivered a second consecutive year of gold reserve growth over and above annual depletion, with nearly 12 million ounces of attributable proven and probable reserve gains in 2022 before depletion.
Successful exploration at both the Lumwana and Jabal Sayid mines drove the growth of attributable proven and probable copper reserves by 640 million pounds, notwithstanding an increase in the annual reserve price assumption to $3.00/lb. As a result, Barrick replaced 103% of annual global depletion at consistent quality, effectively maintaining attributable proven and probable copper mineral reserves of 12 billion pounds at 0.38% in 2022.
President and CEO Mark Bristow has done a wonderful job of guiding all of Barrick's mines around the world in a constructive and conservative fashion. Passing on making a rival offer to this week’s Newmont ( NEM ) bid for Australian giant Newcrest Mining ( NCMGF ) ( NCMGY ) shows a level of financial discipline few others in the industry are able to exhibit. The good news is the company is growing organically with small deals and lots of drilling/exploration success.
In terms of a large deal waiting to be made that will significantly jump reserves and resources in America, Barrick could easily (and smartly) purchase the other half of the Donlin Gold project in Alaska from NovaGold ( NG ), not already owned. I mentioned the upside of doing so in a May article linked here . Given Donlin is only counted as a resource to date, purchasing NovaGold and making a decision to build a long-term mine could add 39 million ounces in total to proven gold reserves quickly.
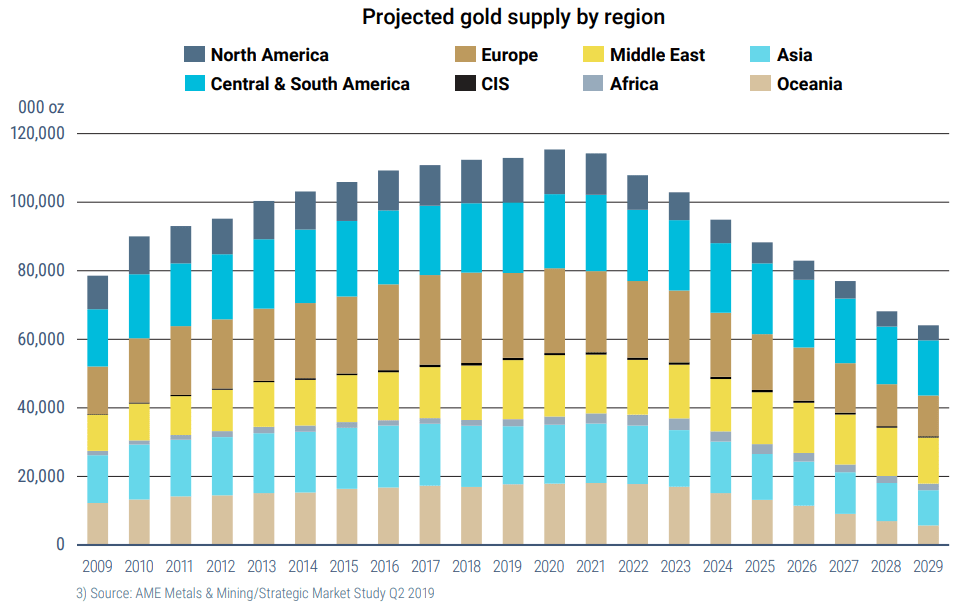
To be honest, gold prices are just not high enough around US$2000 per ounce to encourage new mining development worldwide. Below is a graph of the expected material slide in gold production on the planet over coming years, as existing mine reserves become depleted. To get even flat production long term, gold prices of $2500 or even $3000 will have to appear this year or next! That's the level required to give the go-ahead (based on profit-incentives) to massive CapEx spending over several years to build new mines with long-life reserves and production. (I am talking mines that could produce 1 million or more ounces like Donlin or the Seabridge ( SA ) KSM project in Canada.)
Projected Gold Production by Region - 2021 NovaGold Project Overview - Company Website
Solid Valuation
You would think the concerted effort to reach zero net debt over the last few years, strong resource additions through drilling, and achieving free cash flow status since 2020 would be rewarded in a premium share valuation vs. five or ten years ago. Nope. Investors can buy shares at roughly 10-year averages of earnings, sales, cash flow, and tangible book value.
YCharts - Barrick Gold, Price to Trailing Fundamental Ratios, 10 Years
Including debt minus cash holdings, enterprise value calculations are equally on the inexpensive side. Using either trailing or forward estimates of EV to EBITDA and revenues, Barrick is nowhere near overvalued today vs. previous precious metals cycle peaks in investor interest.
YCharts - Barrick Gold, EV to EBITDA & Revenue Stats, 5 years
We can also compare its valuation to peers in the major gold/silver mining industry. Below I have drawn EV to EBITDA and sales data vs. its closest competitors Agnico Eagle ( AEM ) and Newmont ( NEM ), plus Australian-miner Newcrest, and the largest African producers of Gold Fields ( GFI ) and AngloGold Ashanti ( AU ). To round out the effort, I have included streaming leaders by market capitalization Franco-Nevada ( FNV ) and Wheaton Precious Metals ( WPM ).
YCharts - Major Gold Miners, EV to Trailing EBITDA, 1 Year
YCharts - Major Gold Miners, EV to Trailing Revenues, 1 Year
Another bullish setup is found in the company's newfound focus on delivering dividends and returning capital through share buybacks as profits appear. The current dividend yield of 3% yearly is DOUBLE the S&P 500 equivalent of 1.5%, and near the top cash distribution out of the majors group.
YCharts - Major Gold Miners, Trailing Dividend Yields, 1 Year
Technical Momentum Building
In terms of upside buying trends, all eight of the majors mentioned have interesting and bullish chart patterns. What I like most about Barrick is the positive change from six months ago, when it stood out as one of the worst performing choices. Today, I rank it as highly as any of the others using 3-month and 6-month momentum analysis.
YCharts - Major Gold Miners, 3-Month Total Returns
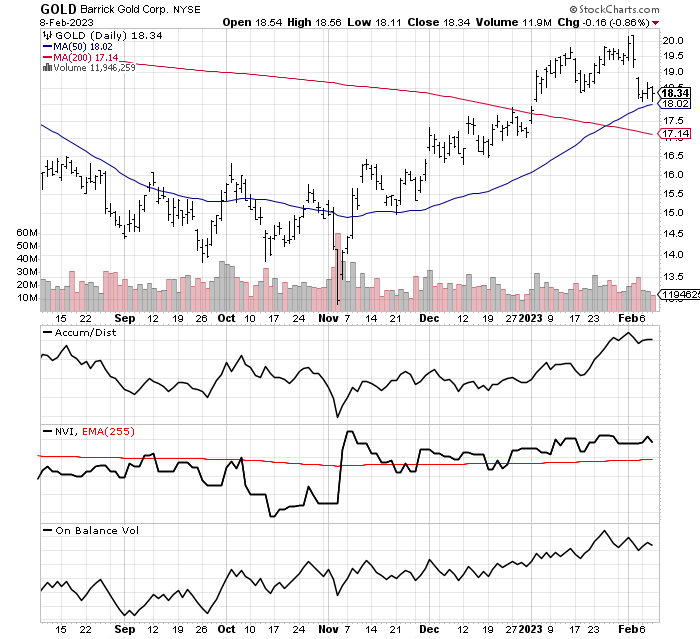
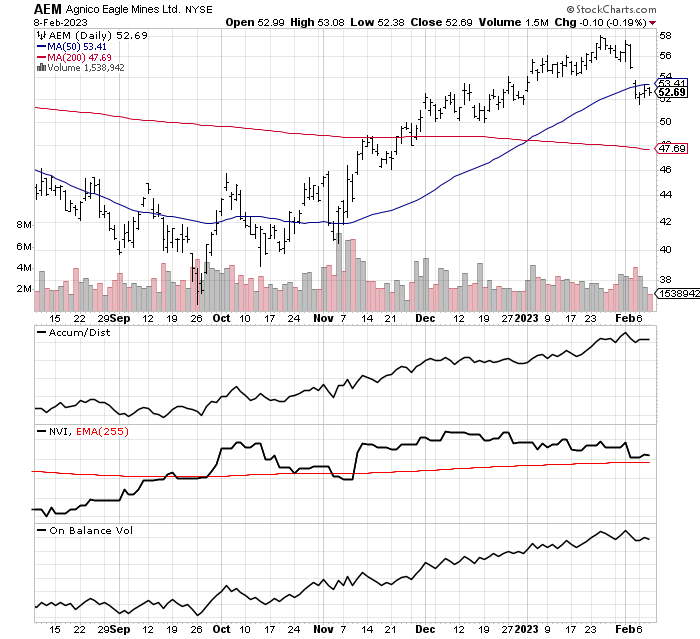
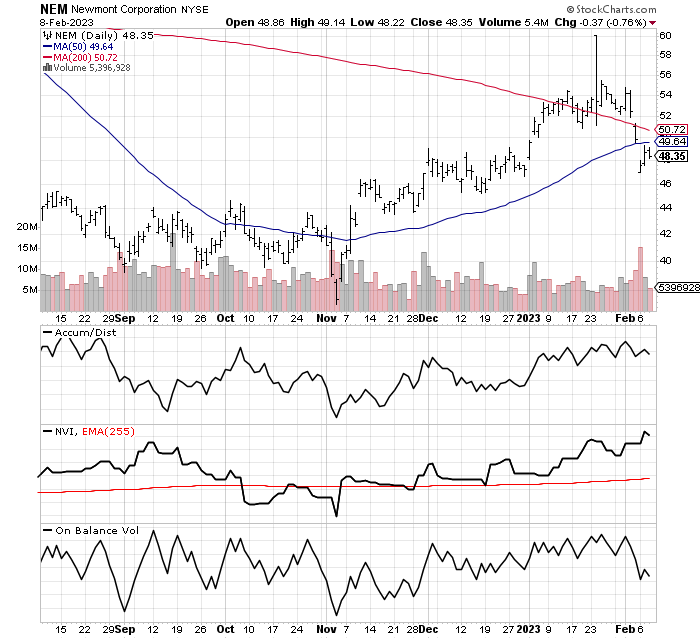
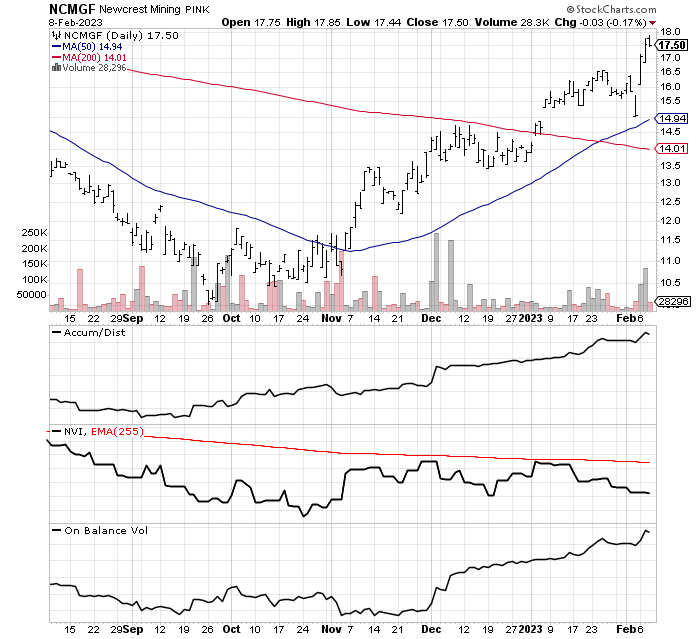
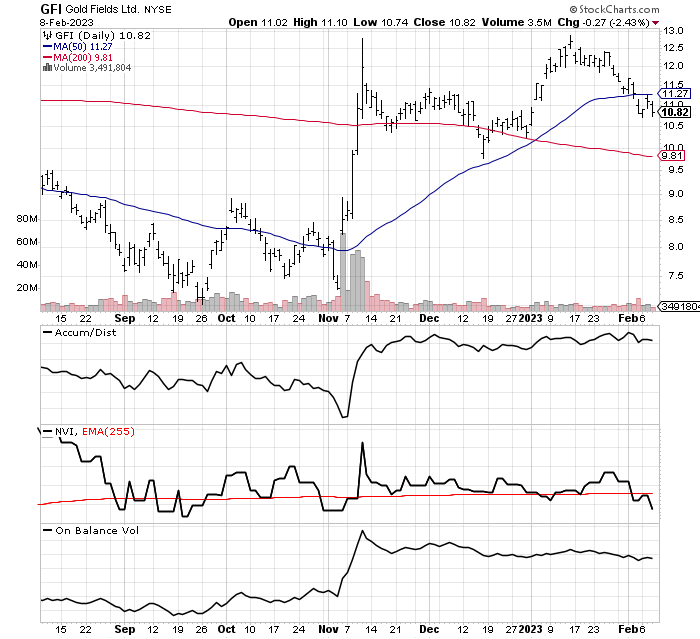
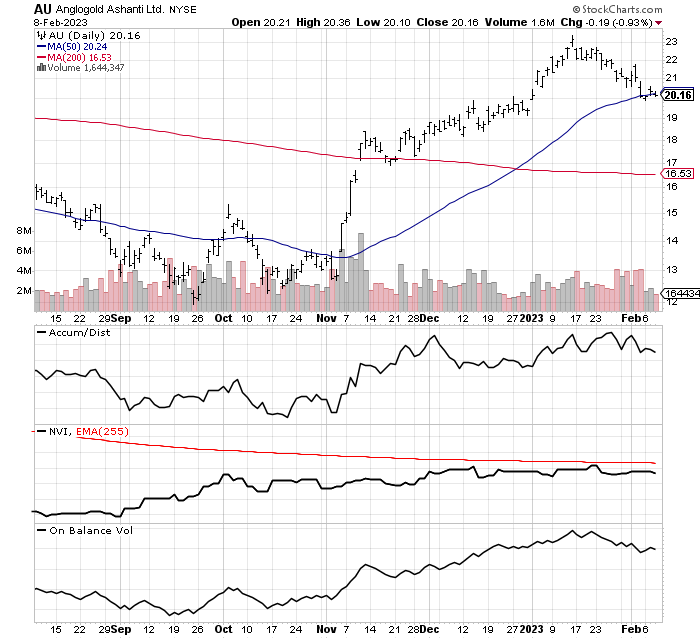
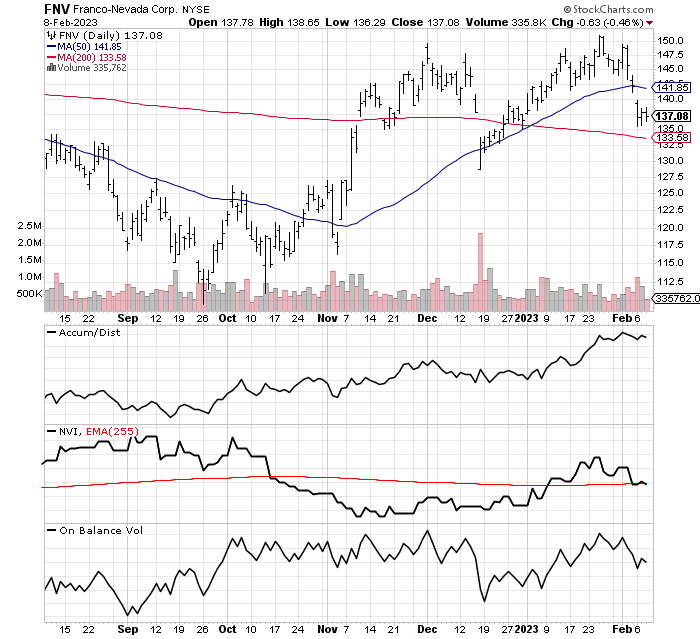
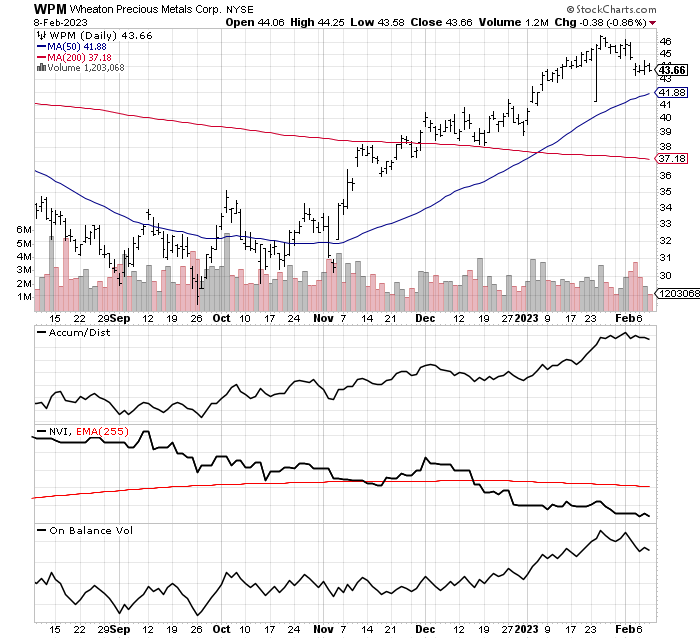
Having rising trends in all three of the Accumulation/Distribution Line , Negative Volume Index , and On Balance Volume indicators is a bullish readout for me, pictured below against the seven alternatives for your investment dollar.
In addition, with price trying to hold above its 50-day moving average in the early February selloff, on top of the 200-day and 50-day MAs pointing higher for day-to-day trends, I rate the whole defensive, conservative, and diversified “setup” to leverage gold/silver/copper prices as healthy to excellent around $18 or $19 a share.
StockCharts.com - Barrick Gold, 6 Months of Daily Price & Volume Changes StockCharts.com - Agnico Eagle, 6 Months of Daily Price & Volume Changes StockCharts.com - Newmont, 6 Months of Daily Price & Volume Changes StockCharts.com - Newcrest Mining, 6 Months of Daily Price & Volume Changes StockCharts.com - Gold Fields, 6 Months of Daily Price & Volume Changes StockCharts.com - AngloGold Ashanti, 6 Months of Daily Price & Volume Changes
StockCharts.com - Franco-Nevada, 6 Months of Daily Price & Volume Changes
StockCharts.com - Wheaton Precious Metals, 6 Months of Daily Price & Volume Changes
Final Thoughts
My personal outlook for the pricing of gold and silver specifically is super bullish today. I have written on the reasons why extensively since late summer (find my comprehensive December article on gold here ), backed by robust central bank buying and COVID-related demand from retail buyers. Coin/bar premiums and inverted lease rates for bullion are indications of something of a physical shortage for metals. And, if this investment interest continues at current rates, mushrooming demand for silver in green energy products could create serious shortages of this metal in as little as 2-3 years.
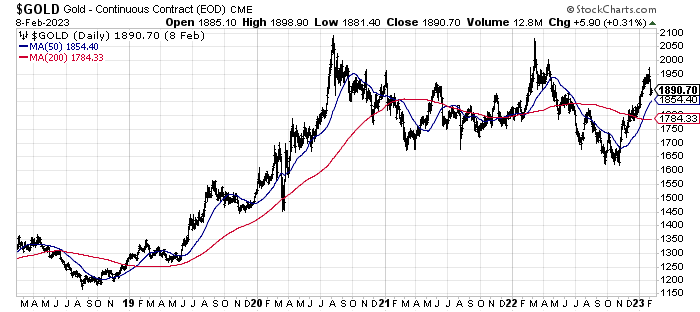
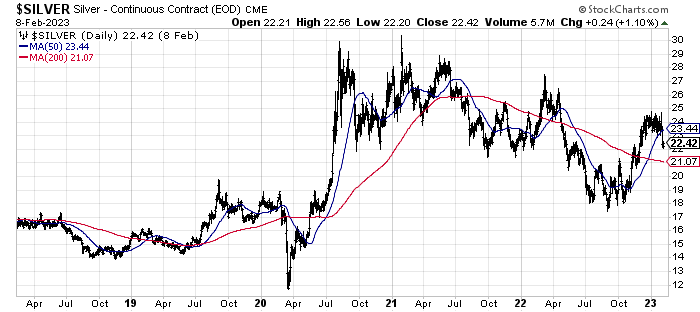
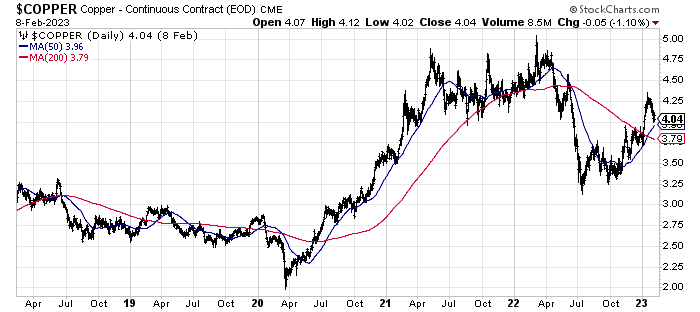
On the 5-year charts of price change below, you can review how the metals have enjoyed a powerful run higher since the summer. But, are still trading lower than a few years ago, meaning considerable upside potential during 2023-24 still remains.
StockCharts.com - Nearby Gold Futures, 5 Years of Daily Price Changes StockCharts.com - Nearby Silver Futures, 5 Years of Daily Price Changes StockCharts.com - Nearby Copper Futures, 5 Years of Daily Price Changes
What are the risks? Barrick does have slightly greater mine exposure to riskier political jurisdictions like Africa than I would like. There will be negative news events about new taxes, or surprise permit requirements, or even the potential for an overseas government shutting down one of Barrick’s mines for a spell. In this sense, Agnico Eagle and Newmont have lower mine location, political risk out of the biggest gold/silver/copper producers.
In addition to operating risks, the actual price swings in bullion are the next variable that could keep price down or send it lower (given an oversized drop in global gold/silver/copper quotes). Again, my view is flat to higher precious metals quotes are the future, especially if a recession in America forces the Federal Reserve to serve up another round of monster money printing to prevent our debt-laden economy from falling into a depression.
Lastly, the continuation of rising interest rates this year would be bad news for precious metals as cash yields encourage capital flows toward the bond market. Of course, a recession with sharply falling interest rates would be a boon (and driver) for rising gold and silver quotes as monetary hedges.
Is Barrick my favorite growth pick in the precious metals mining industry? No. Is it the cheapest? No. Is it the strongest performer of late? No. Does it have the highest leverage to rising bullion prices? No.
Yet, overall, it is now one of the smartest picks with decades of reserves in the ground, billions in annual cash flow generated yearly around $1900 an ounce, plus a balance sheet holding little net debt. For a single miner investment, or as part of diversified precious metals holdings in your portfolio, Barrick is an excellent choice in February 2023.
I am modeling a range of likely outcomes between $15 and $30 a share over the next 12 months. From $19, that works out to total return potential (including dividends) of less than -20% in losses to nearly +60% in gains for worst-case to best-case scenarios.
The primary variable to determine whether Barrick experiences minor losses to strong gains is the price of gold. I have a 12-month gold target range of $2500 to $3000 an ounce, which is dramatically more optimistic than conventional wisdom now expecting flat to lower precious metals pricing in 2023. Given a flat U.S. equity market background, major miners can generate 2x (or more) the percentage price change in underlying metals produced and sold.
Thanks for reading. Please consider this article a first step in your due diligence process. Consulting with a registered and experienced investment advisor is recommended before making any trade.
For further details see:
Barrick Gold: Improving Value And Sound Trading Pattern