CA - Barrick Gold: It Could Have Been Worse
Summary
- Barrick reported its fourth quarter 2022 results on February 15, 2022. Barrick recorded total sales of $2,774 million, down 16.2% year-over-year.
- The company reported fourth quarter production for gold of 1,120K Au ounces (sold 1,111K Oz) and 96M Cu Lbs (sold 99M Cu Lbs).
- Barrick declared a dividend of $0.10 per share for the fourth quarter of 2022.
- I suggest accumulating GOLD between $17.05 and $16.50, with lower potential support at $15.25.
Introduction
Toronto-based Barrick Gold (GOLD) released its fourth quarter and FY22 results on February 15, 2023.
Note: This article is an update of my article published on October 21, 2022. I have followed GOLD on Seeking Alpha since April 2015.
1 - 4Q22 and FY22 results snapshot
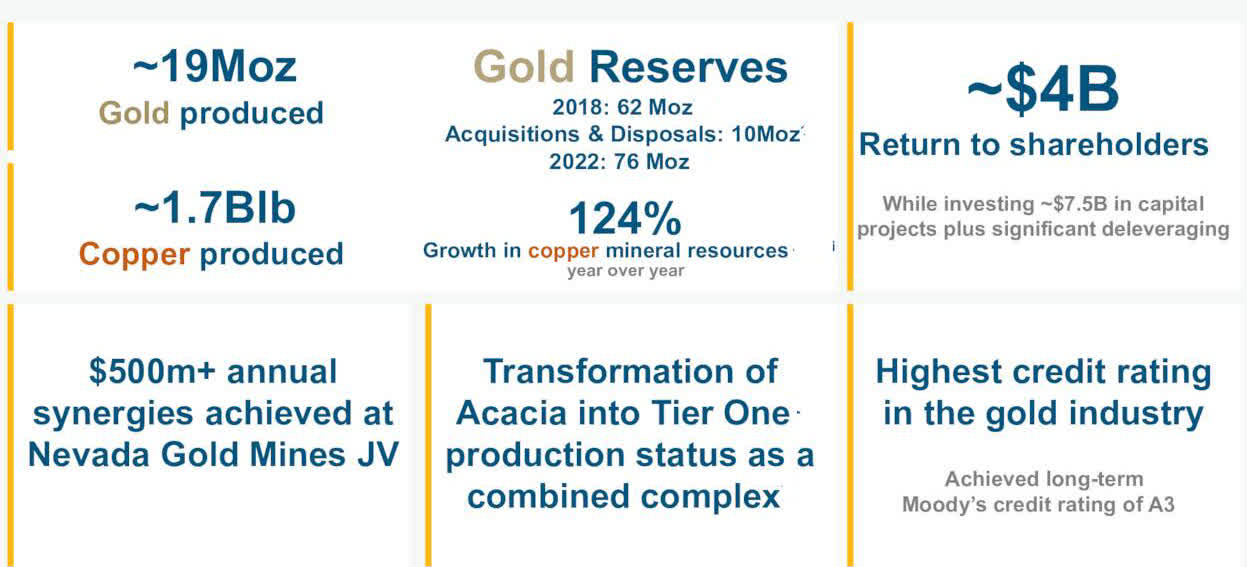
GOLD FY22 Highlights (GOLD Presentation)
Note: 90% of the revenue came from gold in FY22.
Barrick reported a net earnings loss of $735 million or $0.42 per diluted share in 4Q22, down from an income of $726 million or $0.41 in the year-ago quarter. This quarter's loss was due to a goodwill impairment of $950 million. Adjusted earnings were $220 million or $0.13 per diluted share.
Net earnings for the year ended December 31, 2022, were $432 million compared to $2,022 million in the prior year.
Production for the fourth quarter was 1,120K oz (sold 1,111K oz) of gold and 96 Mlbs of Copper (sold 99 Moz). Copper production decreased 23.8% year over year. The average realized copper price was $3.81, down 13.4% YoY.
The average market price for gold in 4Q22 was $1,728 per ounce, while the average copper price was $3.81 per pound.
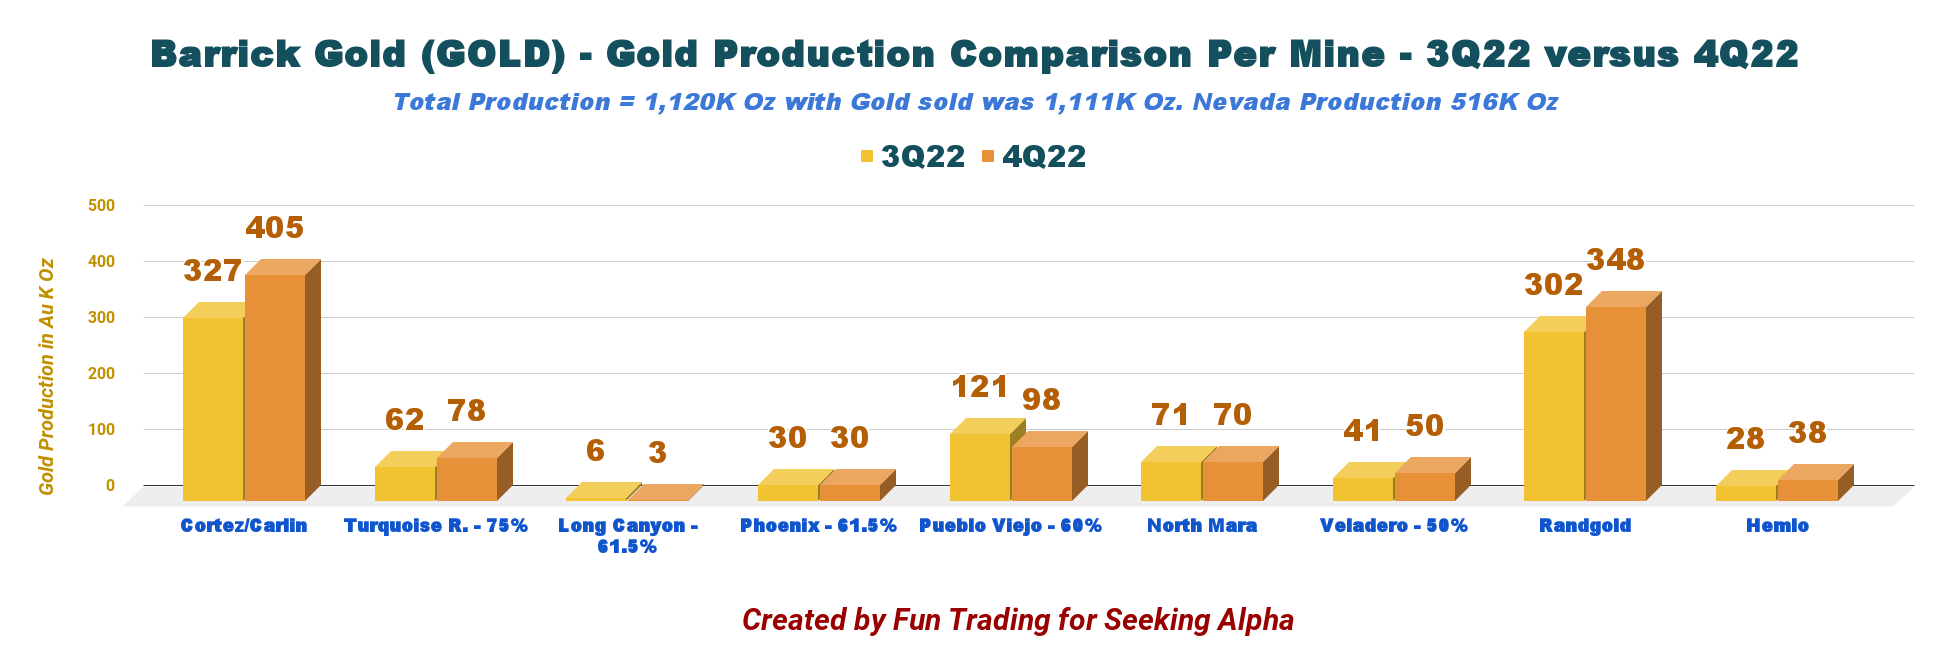
GOLD gold production 3Q22 versus 4Q22 (Fun Trading)
The company indicated that:
On November 23, 2022, Barrick paid $307 million, including $2 million of accrued and unpaid interest, to purchase $319 million (notional value) of its 5.250% Notes due in 2042 through a tender transaction
2 - Stock performance
Barrick Gold is one of the three gold miners that I consider my core long-term "gold miners," together with Newmont ( NEM ) and Agnico Eagle ( AEM ).
GOLD is down 18% in one year. However, NEM is lagging and is down 28% on a one-year basis. We can see below that Barrick is underperforming Agnico Eagle.
3 - Investment thesis
The investment thesis has not changed for many years, and I still recommend keeping a long-term GOLD core position.
However, due to the gold price's extreme volatility and inflationary pressures affecting costs, it is recommended to use about 50% of your GOLD position to trade the stock LIFO short term. The gold price fluctuates widely depending on the FED's action, turning hawkish again due to a higher-than-expected CPI and pushing gold back below $1,840 per ounce.
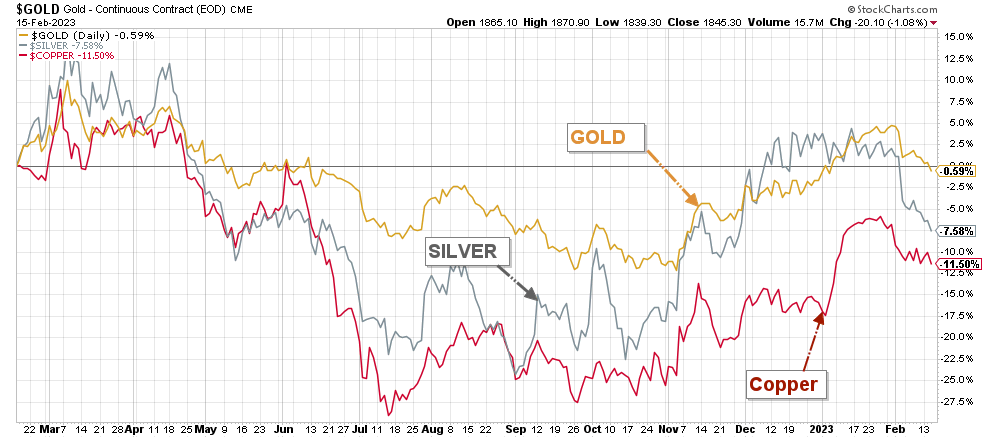
GOLD gold, silver, and copper price 1-Year chart (Fun Trading StockCharts)
CEO Mark Bristow said in the conference call:
Barrick owns the industry's biggest and best gold portfolio. We are the largest producer in the United States and Africa, and we're steadily increasing our copper holdings. And as I plan to share with you today, our proven long-term strategy drives our ability to create and deliver value even in difficult times.
Barrick Gold - Balance Sheet History until 4Q22 and Production Data: The Raw Numbers
| Barrick Gold |
| 4Q21 |
| 1Q22 |
| 2Q22 |
| 3Q22 |
| 4Q22 |
| Total Revenues in $ billion |
| 3.310 |
| 2.853 |
| 2.859 |
| 2.527 |
| 2.774 |
| Net Income in $ billion |
| 0.726 |
| 0.438 |
| 0.488 |
| 241 |
| -735 |
| EBITDA $ billion |
| 2.151 |
| 1.553 |
| 1.557 |
| 1.169 |
| -0.312* |
| EPS diluted in $/share |
| 0.41 |
| 0.25 |
| 0.27 |
| 0.14 |
| -0.42 |
| Cash from operations in $ million |
| 1,387 |
| 1.004 |
| 0.924 |
| 0.758 |
| 0.795 |
| Capital Expenditure in $ million |
| 669 |
| 611 |
| 755 |
| 0.792 |
| 0.891 |
| Free Cash Flow in $ million |
| 718 |
| 393 |
| 169 |
| -34 |
| -96 |
| Total cash $ billion |
| 5.28 |
| 5.89 |
| 5.78 |
| 5.24 |
| 4.44 |
| Long-term Debt in $ billion |
| 5.15 |
| 5.14 |
| 5.14 |
| 5.10 |
| 4.78 |
| Dividend per share in $ |
| 0.20 |
| 0.20 |
| 0.20 |
| 0.15 |
| 0.10 |
| Shares outstanding (diluted) in billion |
| 1.779 |
| 1.779 |
| 1.777 |
| 1.768 |
| 1.759 |
| Gold Production |
| 4Q21 |
| 1Q22 |
| 2Q22 |
| 3Q22 |
| 4Q22 |
| Gold Production K Oz |
| 1,203 |
| 990 |
| 1,043 |
| 988 |
| 1,120 |
| Copper Production Mlbs |
| 126 |
| 101 |
| 120 |
| 123 |
| 96 |
| AISC $/Oz by-product |
| 971 |
| 1,164 |
| 1,212 |
| 1,269 |
| 1,242 |
| Gold price realized $/Oz |
| 1,793 |
| 1,876 |
| 1,871 |
| 1,722 |
| 1,728 |
Data Source: Company press release
* Indicated by the company on page 87.
Part I - Barrick Gold - Balance Sheet Analysis
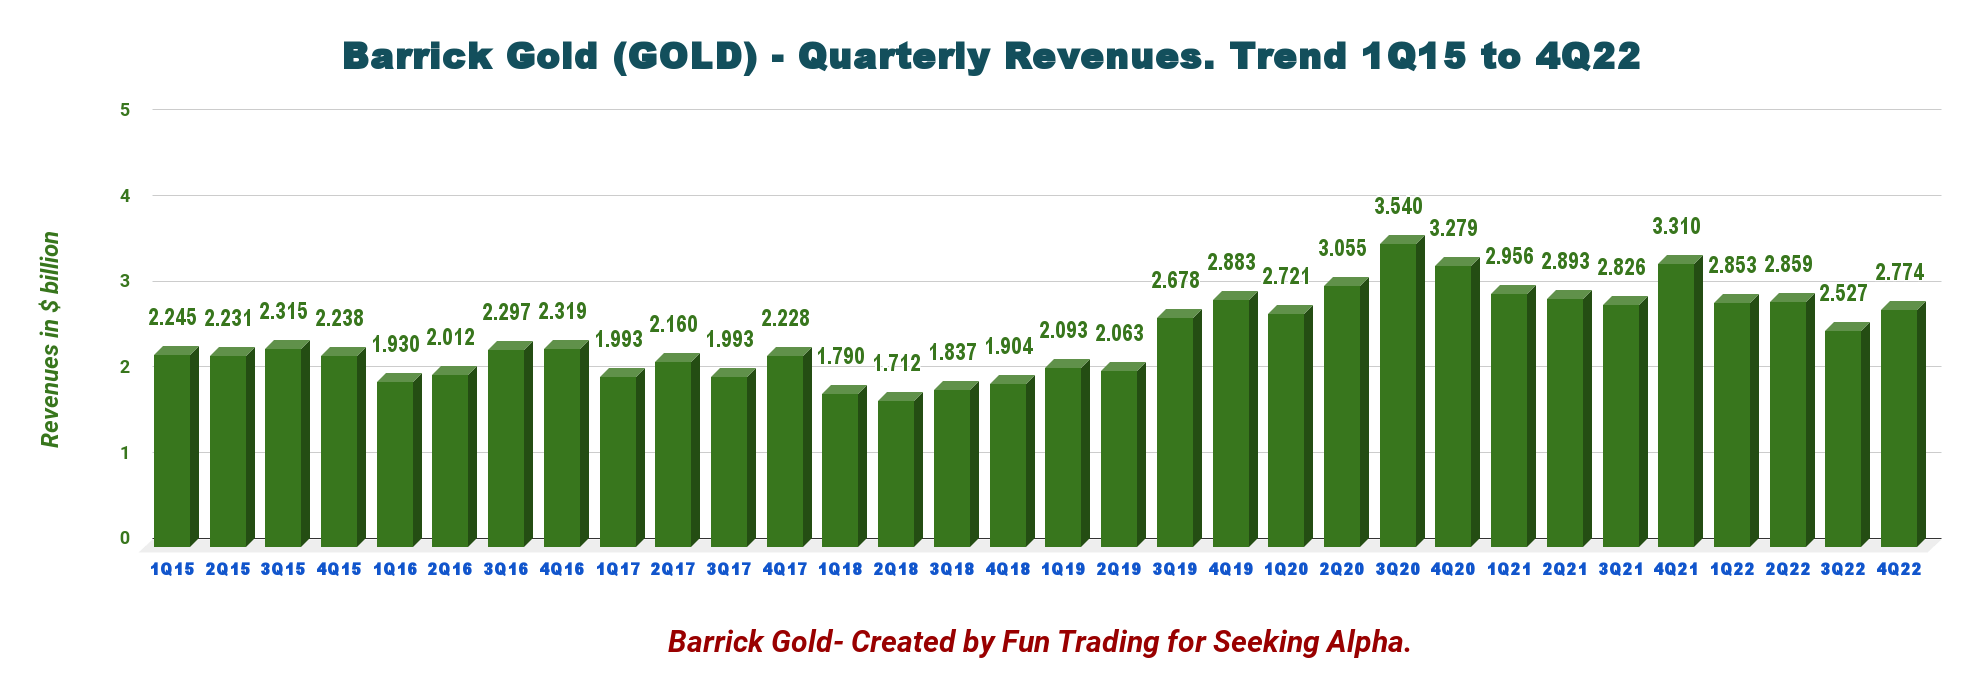
1 - Revenue details. GOLD earned $2.774 billion in 4Q22
GOLD Quarterly Revenue history (Fun Trading)
Barrick reported its fourth quarter 2022 results on February 15, 2022. Barrick recorded total sales of $2,774 million, down 16.2% year-over-year.
The company's net loss was $735 million, or $0.42 per diluted share, in the fourth quarter of 2022, compared to an income of $726 million, or $0.41 per share, in the year-ago quarter. After adjusting for items not indicative of future operating earnings, adjusted net earnings were $220 million.
Net cash provided by operating activities decreased 42.7% year-over-year to $795 million compared to $1,387 million a year ago, with a gold price reaching $1,728 per ounce this quarter.
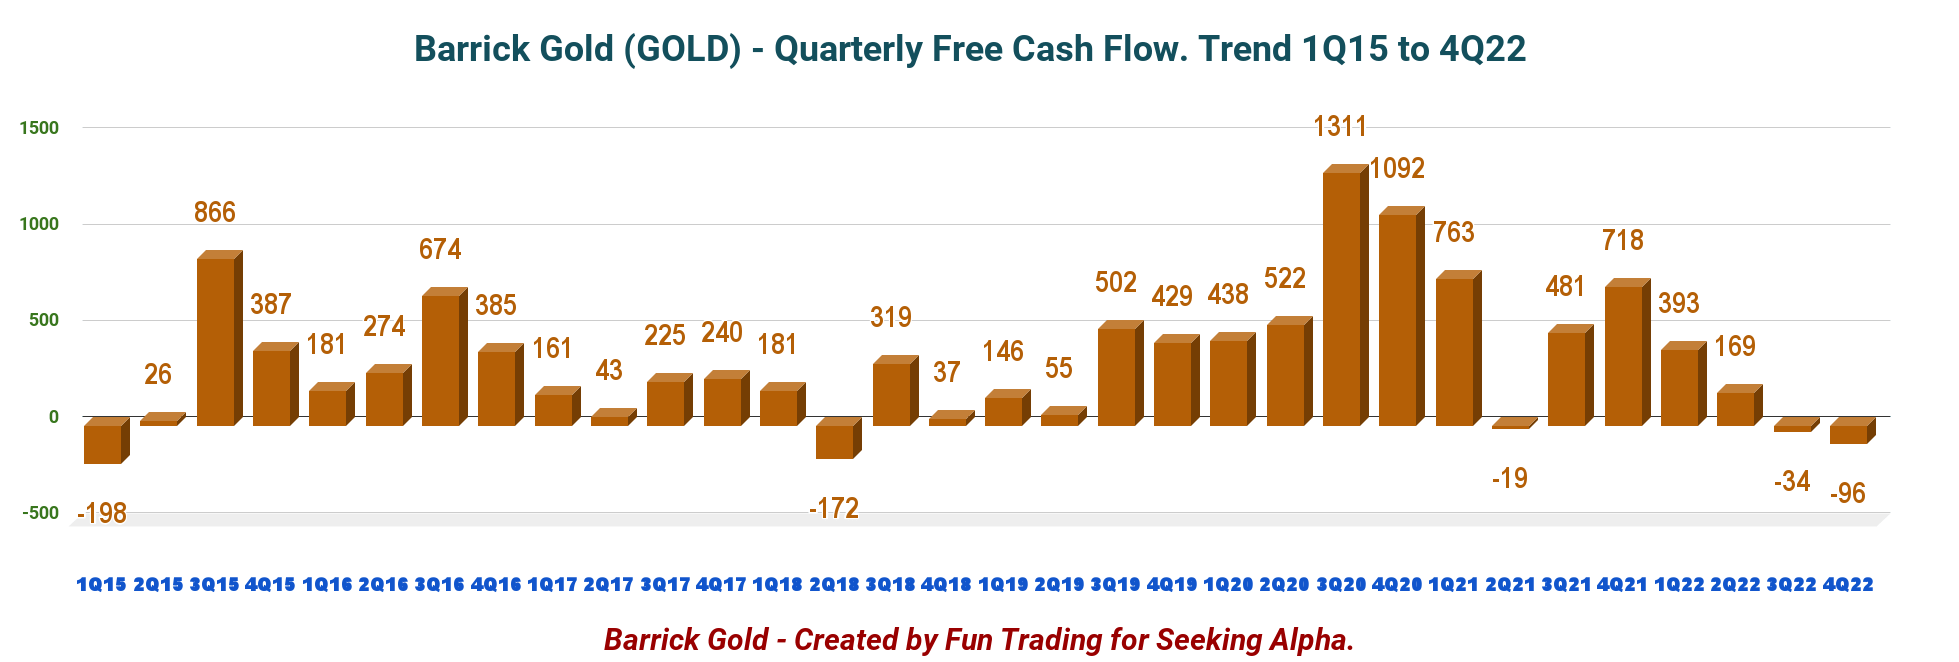
2 - Free cash flow was a loss of $96 million in 4Q22
GOLD Quarterly Free cash flow history (Fun Trading)
Note: The generic free cash flow is the cash from operations minus CapEx.
The free cash flow for the quarter was a loss of $96 million, and the trailing 12-month free cash flow is $432 million, which covers the dividend payout.
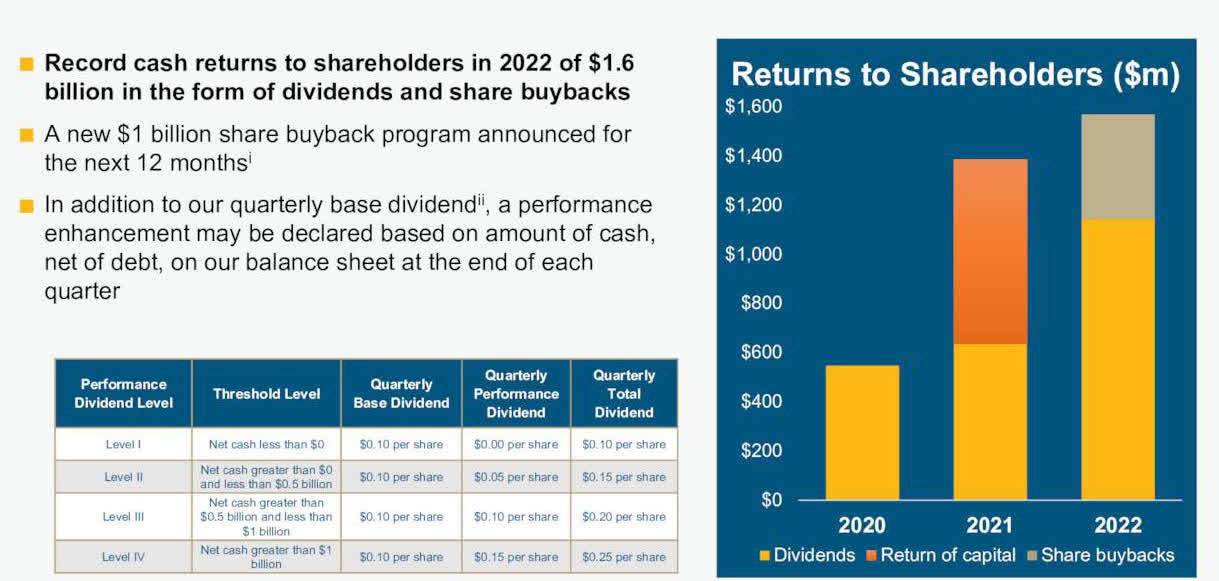
Barrick Gold declared a quarterly dividend of $0.10 per share, consistent with the company's dividend policy.
GOLD Dividend policy (GOLD Presentation)
Barrick repurchased 24.25 million shares under the share buyback program announced in February 2022.
Also, Barrick's Board of Directors has authorized a new program to repurchase up to $1.0 billion of the Company's outstanding common shares over the next 12 months.
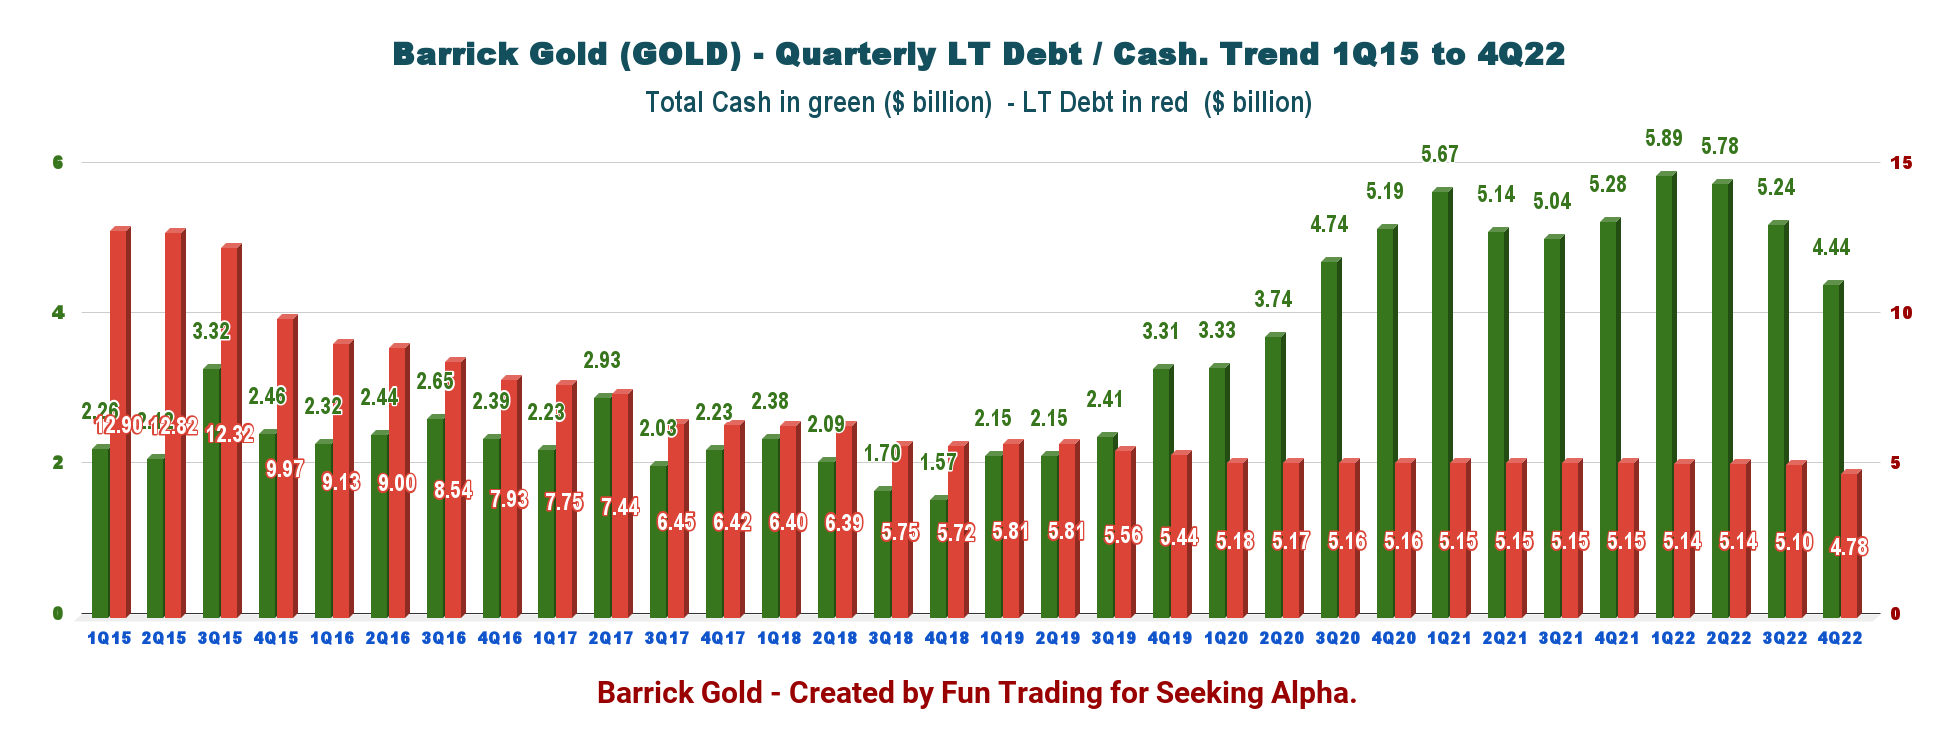
3 - No n et debt and cash on hand of $4,782 million in 4Q22
GOLD Quarterly Cash versus Debt history (Fun Trading)
Total debt was down to $4,782 million at the end of the fourth quarter, and the total cash was $4,440 million. The company has an excellent debt position and no net debt.
Part II - 4Q22 Gold Production and Commentary
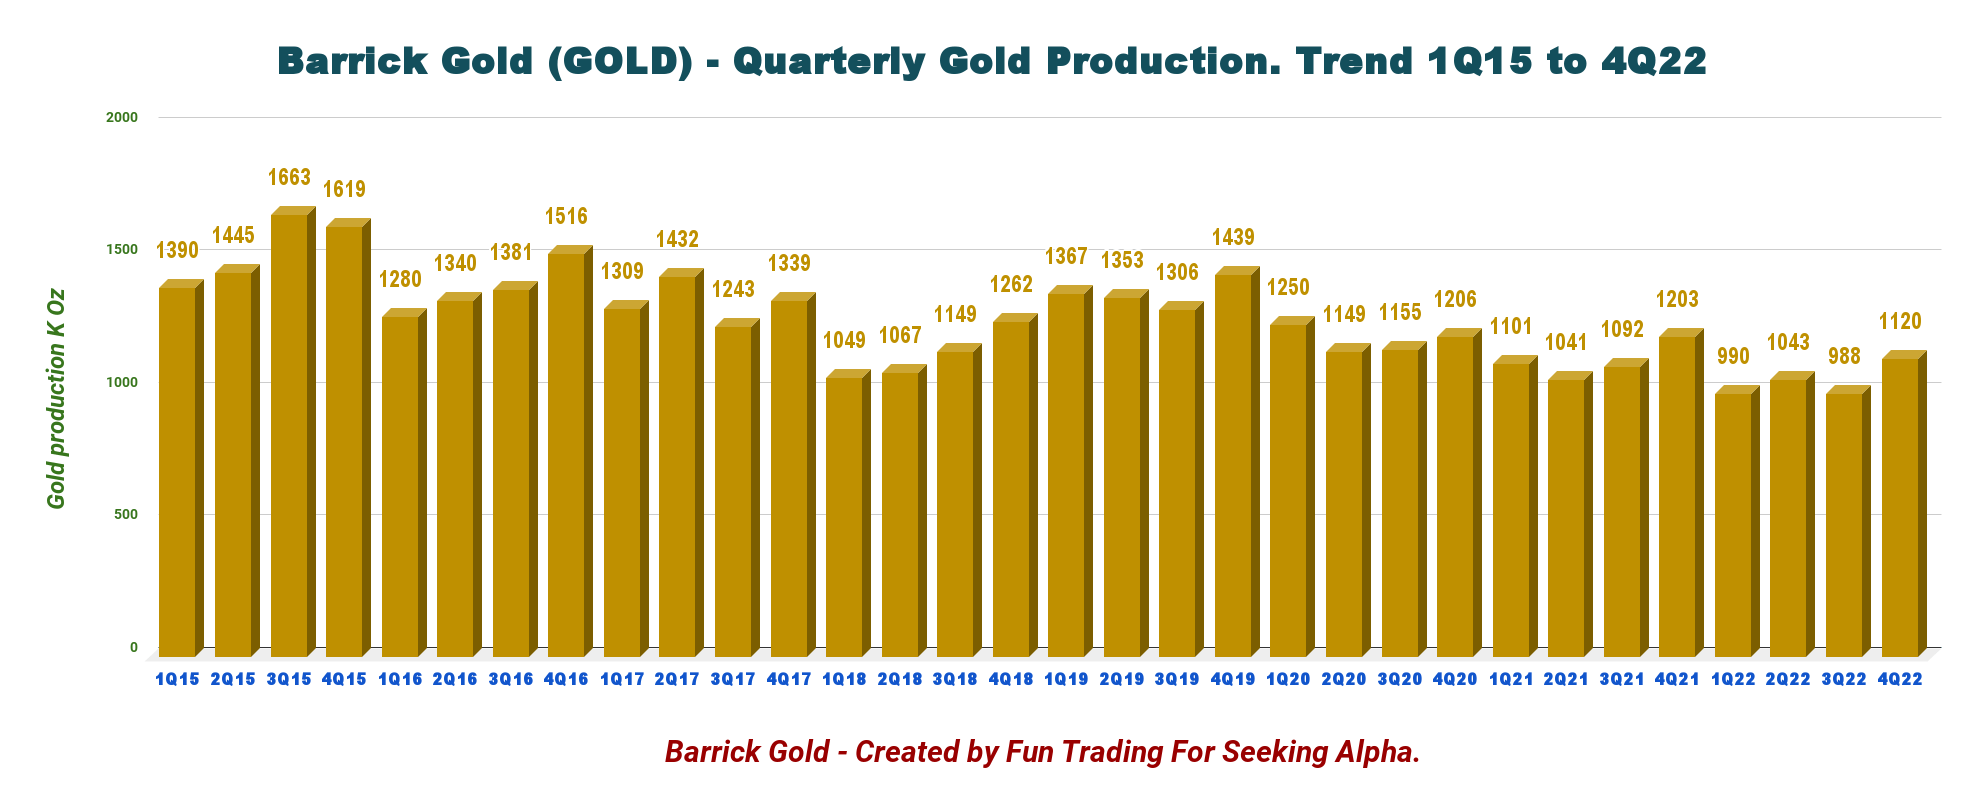
The company reported fourth-quarter production for gold of 1,120K Au ounces (sold 1,111K Oz) and 96M Cu Lbs (sold 99M Cu Lbs).
The average price for gold in the second quarter was $1,728 per ounce, while the average copper price was $3.81 per pound. AISC was $1,242 per ounce due to inflationary pressures.
1 - Gold production details and historical charts
Production this quarter was not particularly stellar, but it was better sequentially, as shown below:
GOLD Quarterly gold production history (Fun Trading)
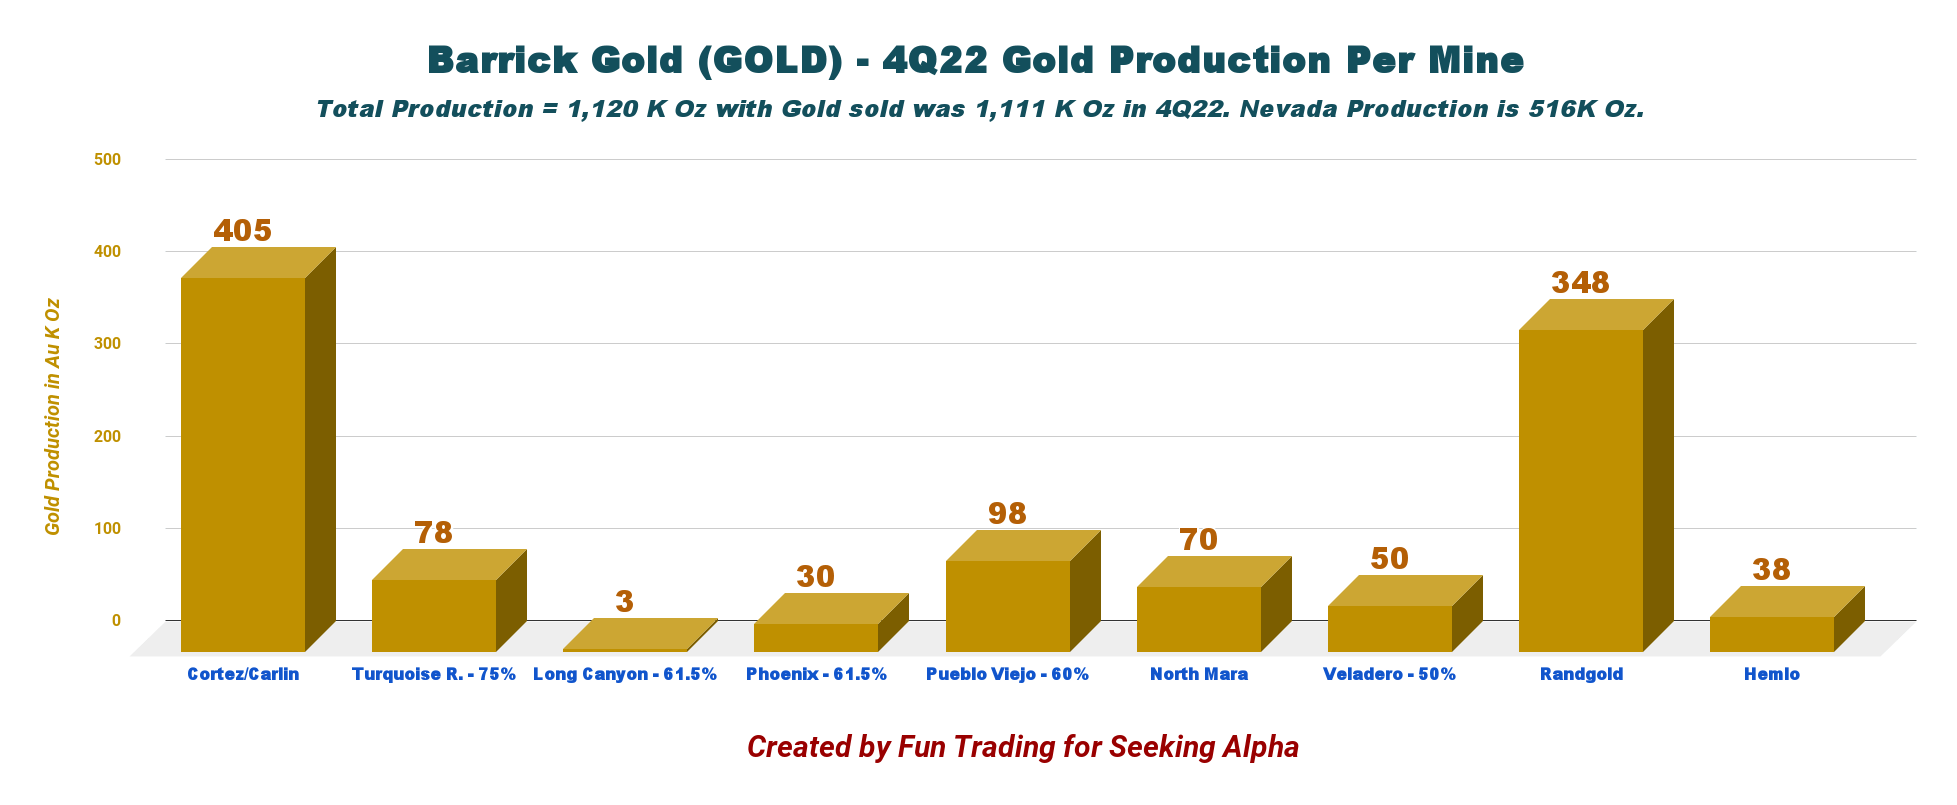
Below is shown production per mine.
Note: JV Nevada represents five gold mines: Cortez, Carlin, Turquoise, Long Canyon, and Phoenix.
GOLD 4Q22 gold production per mine (Fun Trading)
2 - Copper production per mine and quarter ending the fourth quarter of 2022
GOLD Quarterly copper production per mine history (Fun Trading)
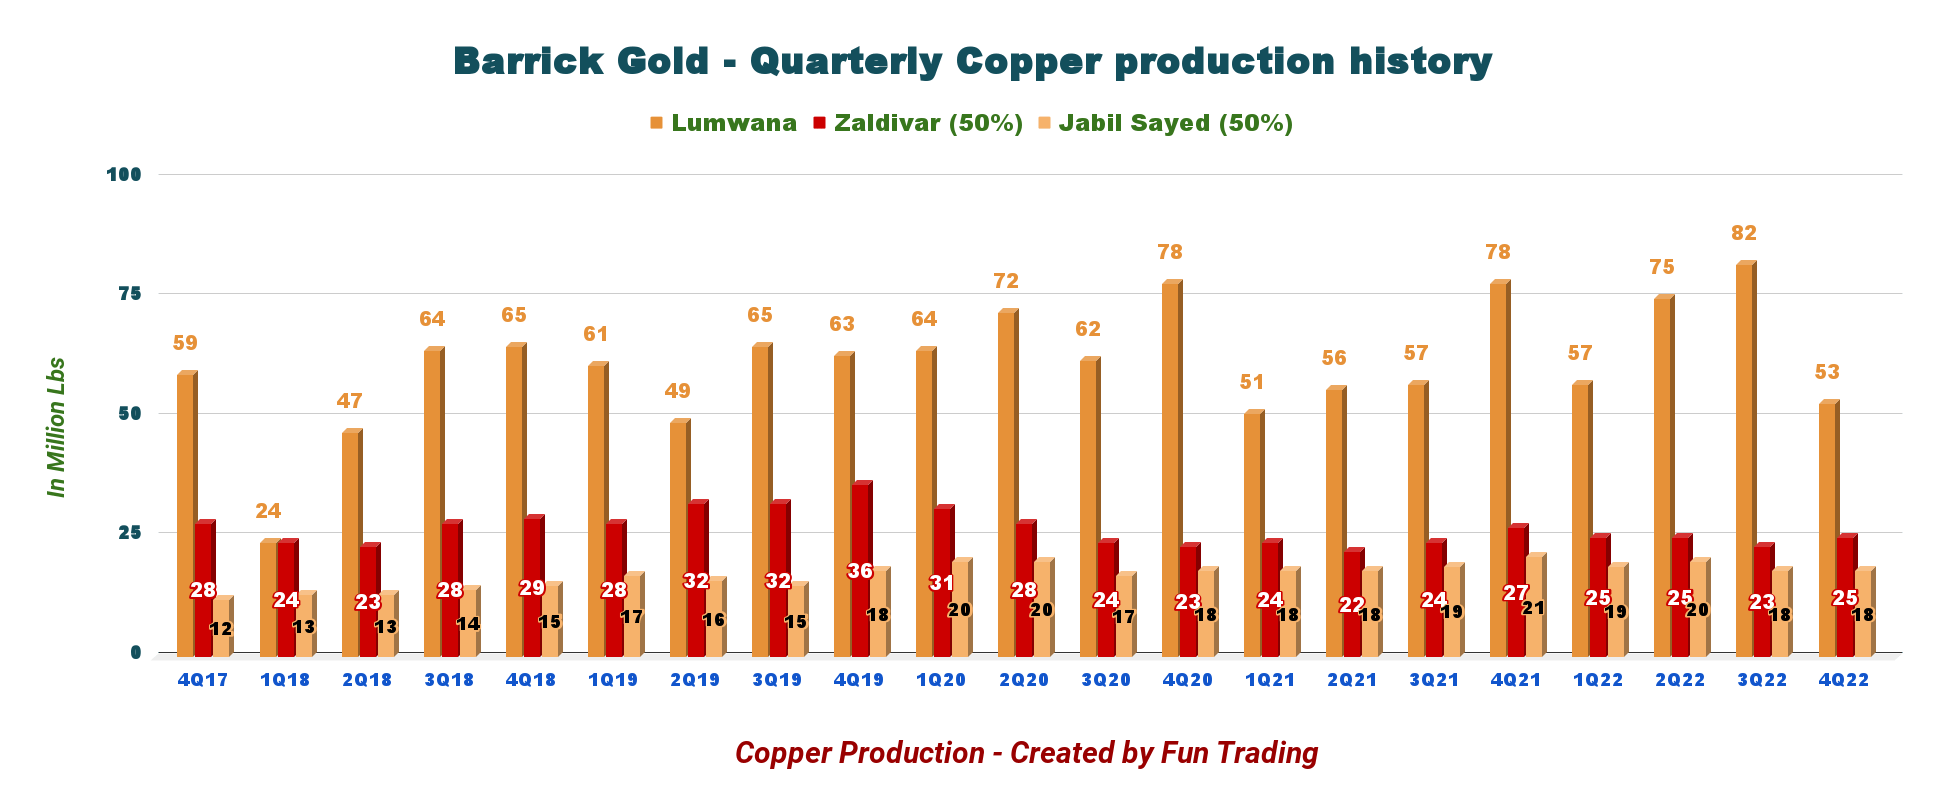
2Q22 copper production was low in 4Q22 with 96 Mlbs and sold 99 Mlbs.
3 - Gold and copper prices realized
The average market price for gold in the second quarter was a solid $1,728 per ounce and $3.81 per pound for copper.
3.1 - Gold price history
GOLD Quarterly gold price history (Fun Trading)
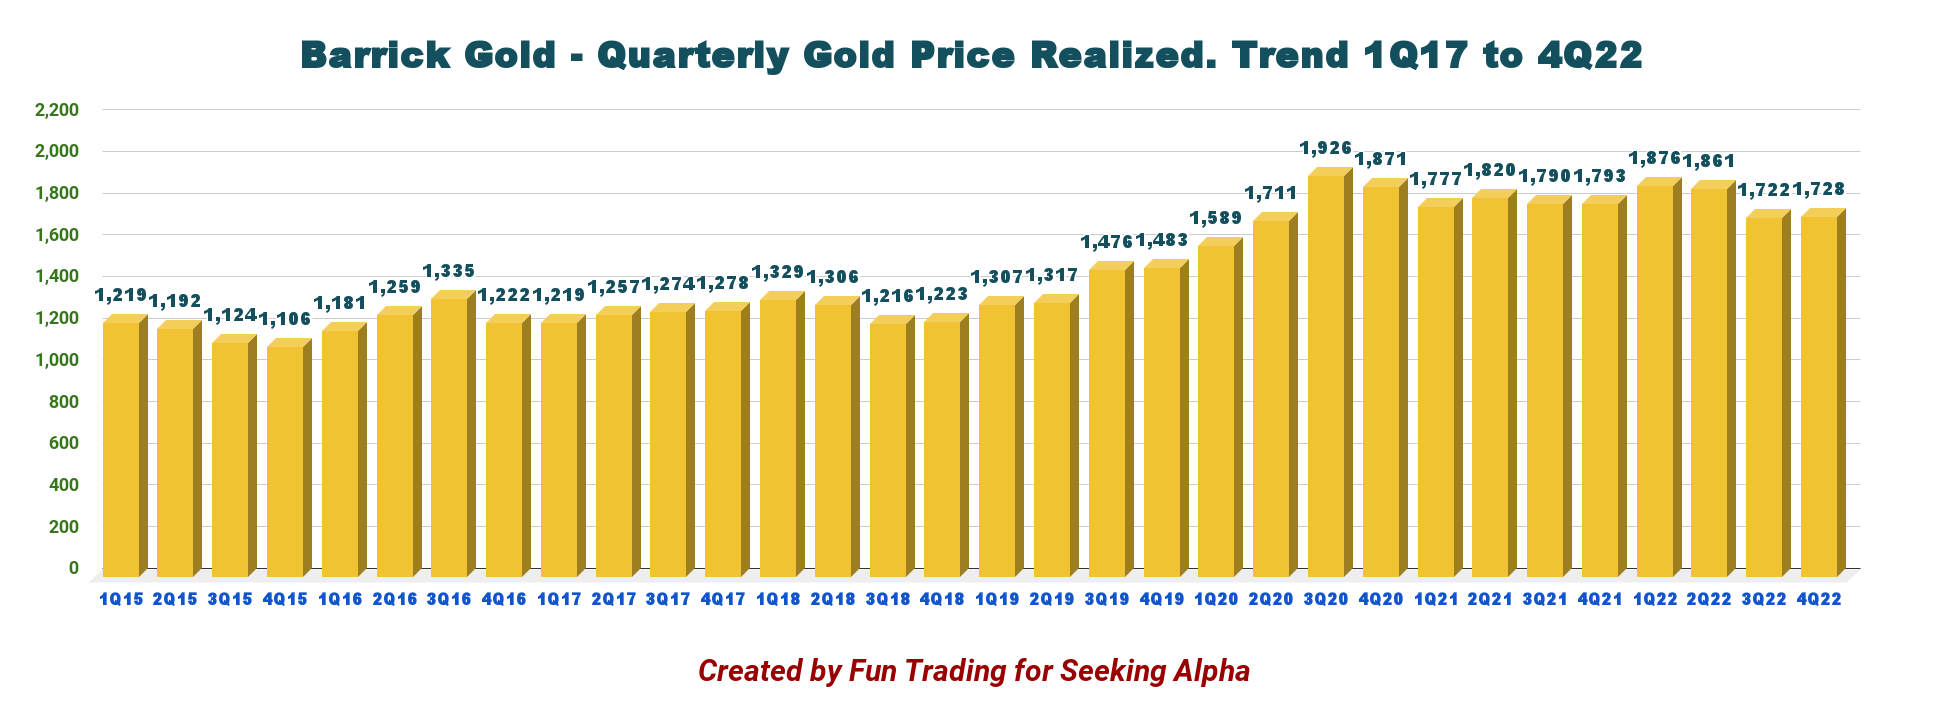
The gold price realized was $1,728 per ounce in 4Q22, down from $1,798 last year.
3.2 - Copper price realized will be lower this quarter
GOLD Quarterly Copper price history (Fun Trading)
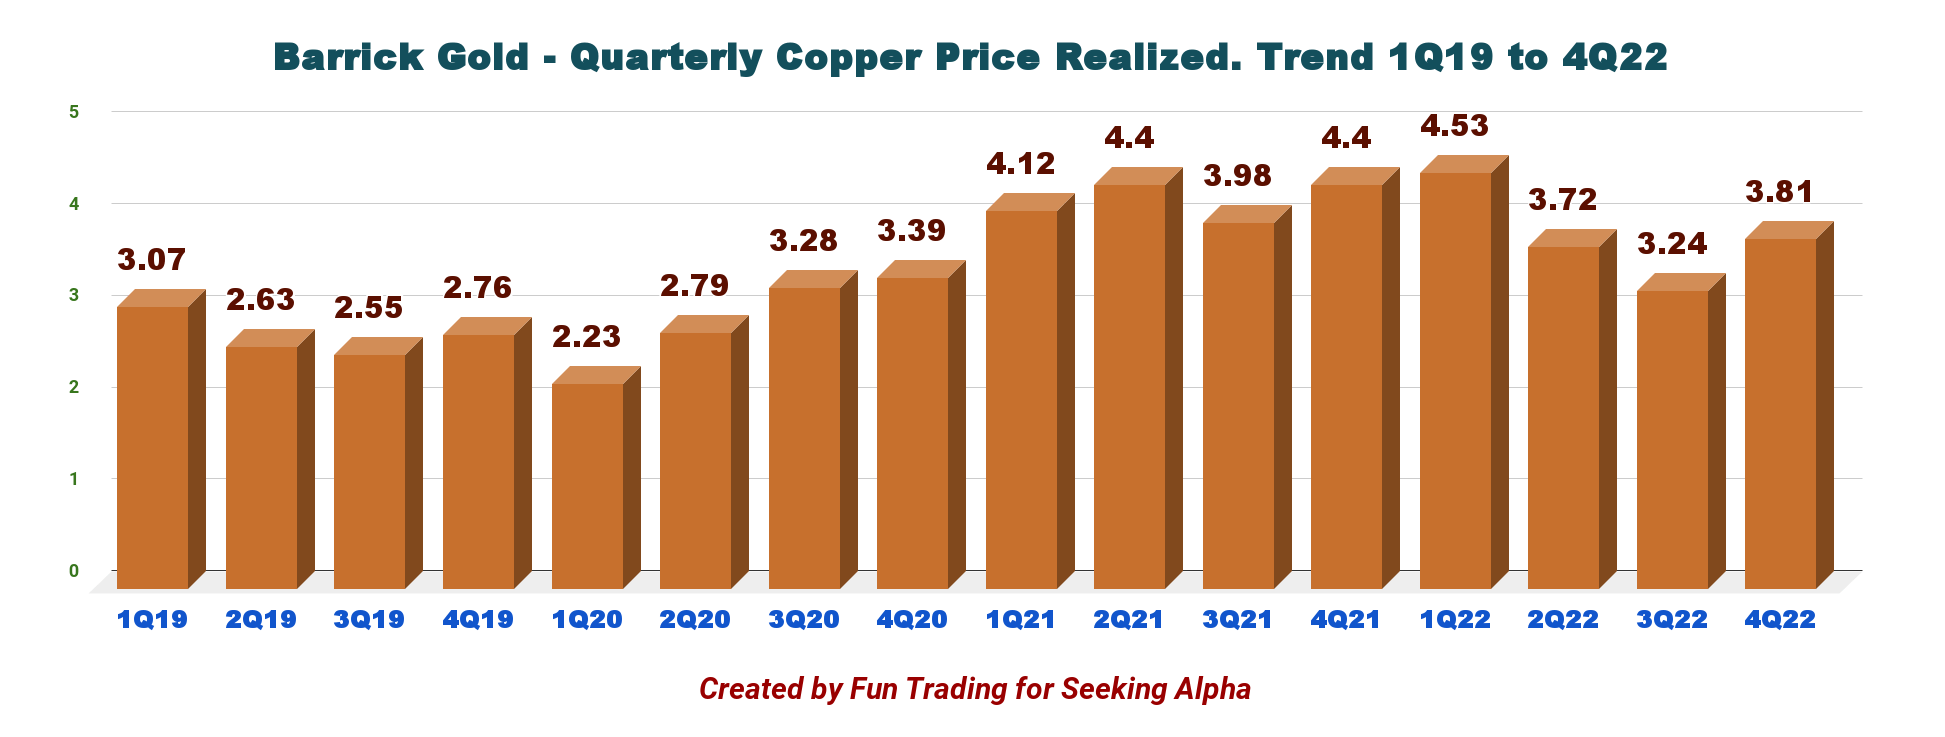
Unfortunately, the copper price received by Barrick fell YoY. The copper price in the fourth quarter of 2022 was 13.4% lower YoY. The average market price for copper in 4Q22 was $3.81 per pound.
The copper price is directly correlated to China's economy, and the metal has been struggling recently due to uncertainties related to China's recovery.
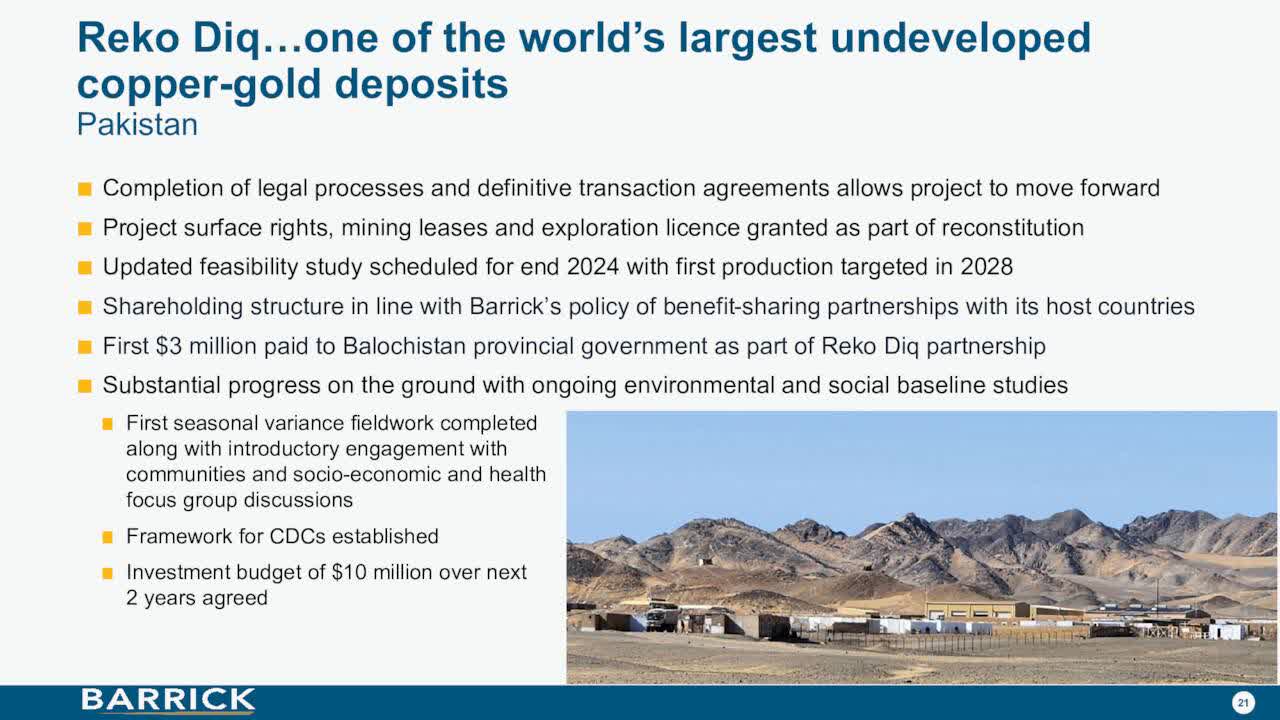
4 - The Reko Diq project in Pakistan
GOLD Reko Diq Project update (GOLD Presentation)
The feasibility study is scheduled for the end of 2024, with the first production targeted in 2028. It is an exciting project, but the location is quite problematic. However, I believe it will be a success because the Balochistan government has everything to gain from this project and a lot to lose if they do not cooperate.
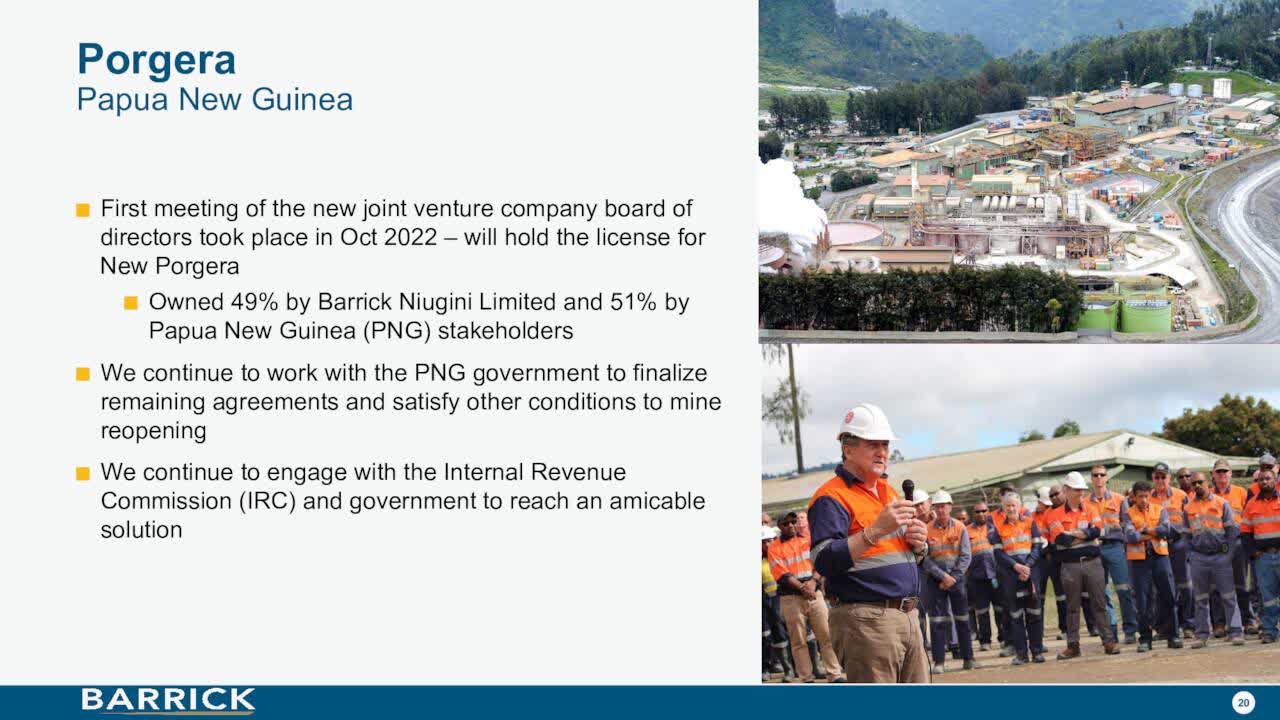
It is the same issue with the Porgera Gold mine in PNG, which is still in the negotiating phase with the government after the lease was canceled, and the mine has been placed under care & maintenance since April 2020.
GOLD Porgera mine update (GOLD Presentation)
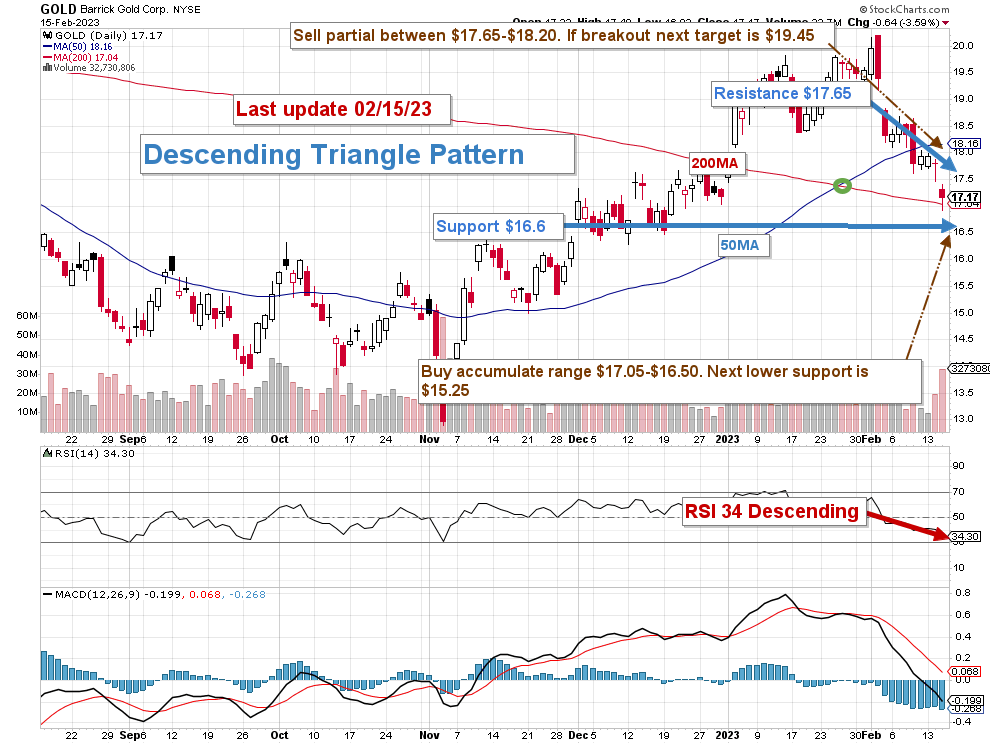
Part III - Technical Analysis and Commentary
GOLD TA Chart short-term (Fun Trading StockCharts)
Note: The chart is adjusted for the dividend.
GOLD forms a descending triangle pattern with resistance at $17.65 and support at $16.6.
A descending triangle pattern is often considered a bearish continuation pattern. However, a descending triangle pattern can also be bullish under a reversal pattern. RSI (14) starts to be oversold at 34, indicating that we may be about to reach support.
The overall strategy that I promote in my marketplace, "The Gold And Oil Corner," is to keep a core long-term position and use about 40% to trade LIFO while waiting for a higher final price target for your core position between $22 and $25 and pocketing the dividend in the meantime.
The trading strategy is to sell between $17.65 and $18.20, with possible higher resistance at $19.45. I suggest accumulating between $17.05 and $16.50, with lower potential support at $15.25.
Watch the gold price like a hawk.
Warning: The TA chart must be updated frequently to be relevant. It is what I am doing in my stock tracker. The chart above has a possible validity of about a week. Remember, the TA chart is a tool only to help you adopt the right strategy. It is not a way to foresee the future. No one and nothing can.
Author's note: If you find value in this article and would like to encourage such continued efforts, please click the "Like" button below as a vote of support. Thanks.
For further details see:
Barrick Gold: It Could Have Been Worse