ET - Better High Yield Buy: Enterprise Products Partners Or Energy Transfer?
2023-09-10 02:48:55 ET
Summary
- Energy Transfer and Enterprise Products Partners are popular midstream stocks with attractive and well-covered distributions.
- We have traditionally liked ET more, but its substantial recent outperformance is bringing us back to re-evaluate the two against each other.
- We share our take on which is the better buy right now.
Energy Transfer ( ET ) and Enterprise Products Partners ( EPD ) are some of the most popular midstream stocks on Seeking Alpha and for good reason. Both offer:
- Very high and very well covered distributions.
- Investment grade balance sheets that have been deleveraged considerably in recent years.
- Solid growth profiles that have driven solid distribution growth lately, with management guiding for this distribution growth to continue for the foreseeable future.
- Relatively cheap valuations relative to many of their investment grade peers.
In the past, we have held both of these securities, but since launching our portfolio in December 2020 we have greatly preferred (and outsized) ET given its much cheaper valuation. That move has paid off tremendously as ET has delivered phenomenal total returns that have significantly outpaced EPD's over that period of time:
As a result, we are now re-evaluating our ET investment to see if we still prefer it over EPD.
EPD Stock Vs. ET Stock: Business Models
EPD is often considered to have a better business model than ET has, especially when factoring in management. After all, EPD's returns on invested capital have consistently outpaced ET's by several hundred basis points over the years:
Moreover, EPD boasts a quarter century track record of growing its distribution each year whereas ET halved its distribution three years ago.
As a result, it may come as a bit of a surprise to find that ET has actually outperformed EPD over the period of time that they both have been publicly traded:
That being said, let's look at the underlying asset portfolios of each of these MLPs.
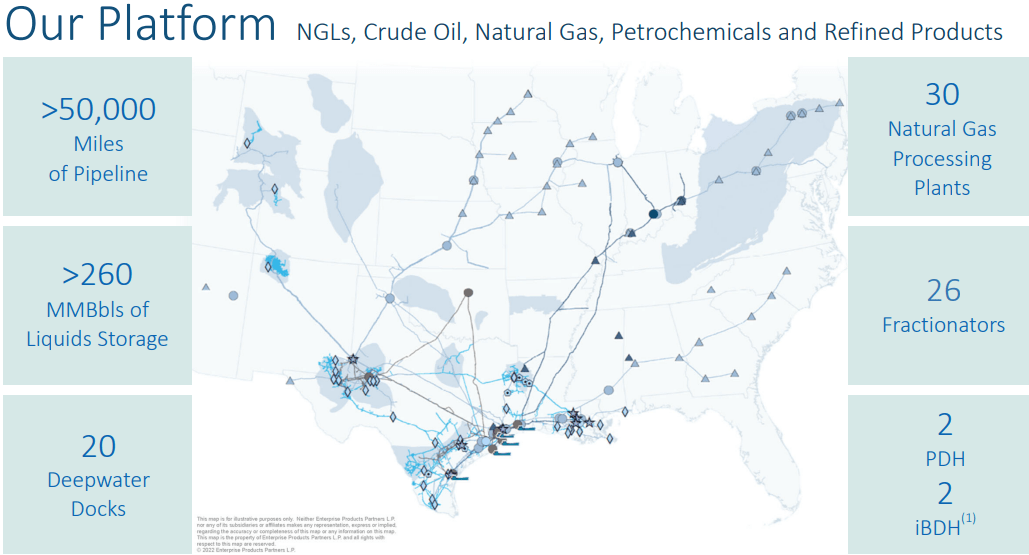
EPD boasts a highly diversified portfolio of assets spread across a broad geographical footprint. It also benefits from economies of scale with an enterprise value of nearly $87 billion. This scale and diversification give EPD numerous avenues for lucrative investments in organic growth projects and potential acquisitions.
EPD Portfolio (Investor Presentation)
EPD provides midstream energy services to both natural gas and natural gas liquids producers and consumers, as well as those in the crude oil, petrochemical, and refined products industries. The company is structured into four distinct segments: NGL Pipelines & Services, Crude Oil Pipelines & Services, Natural Gas Pipelines & Services, and Petrochemical & Refined Products Services.
Within the NGL Pipelines & Services segment, Enterprise offers natural gas processing services and related NGL marketing services. They operate natural gas processing facilities in various locations, including Colorado, Louisiana, Mississippi, New Mexico, Texas, and Wyoming. Additionally, this segment manages NGL pipelines, NGL fractionation facilities, storage facilities for NGLs and related products, and NGL marine terminals.
The Crude Oil Pipelines & Services segment handles the operation of crude oil pipelines and storage facilities, including a fleet of 245 tractor-trailer tank trucks used for crude oil transportation. This segment is also involved in crude oil marketing activities.
The Natural Gas Pipelines & Services segment focuses on operating natural gas pipeline systems for the gathering, treatment, and transportation of natural gas. It also leases underground salt dome natural gas storage facilities in Napoleonville, Louisiana, owns an underground salt dome storage cavern in Wharton County, Texas, and engages in natural gas marketing.
In the Petrochemical & Refined Products Services segment, EPD operates facilities for propylene fractionation, butane isomerization, deisobutanizer operations, octane enhancement, and high purity isobutylene production. This segment is also responsible for managing refined products pipelines and terminals, ethylene export terminals, and provides services related to refined products marketing and marine transportation.
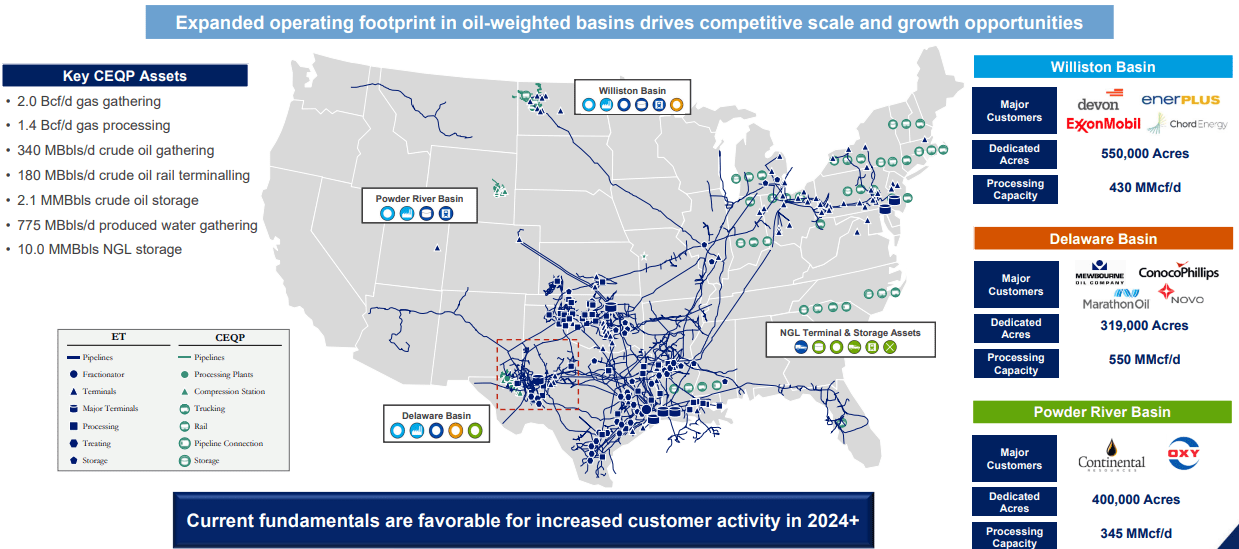
ET, meanwhile, also has a very diverse and geographically well distributed portfolio of midstream infrastructure assets and businesses. It also has enormous scale and is in fact even larger than EPD, with a nearly $106 billion enterprise value.
ET owns and operates around 11,600 miles of natural gas transportation pipelines, five natural gas storage facilities in Texas and Oklahoma, and 19,945 miles of interstate natural gas pipelines. Furthermore, ET manages natural gas gathering, natural gas liquid pipelines, processing plants, and treatment facilities across multiple states, including Texas, New Mexico, West Virginia, Pennsylvania, Ohio, Oklahoma, Arkansas, Kansas, and Louisiana. Additionally, it oversees natural gas gathering systems and oil pipelines in South Texas, a natural gas gathering system in Ohio, and provides water transportation to natural gas producers in Pennsylvania. ET also owns and operates approximately 5,650 miles of NGL pipelines, NGL fractionation facilities, NGL storage facilities with a capacity of approximately 58 million barrels, along with other NGL storage assets and terminals totaling about 25 million barrels in storage capacity.
ET also has a track record of making fairly substantial acquisitions in an effort to accretively scale its business and strengthen its competitive positioning. Most recently, it announced that it would be acquiring Crestwood Equity Partners ( CEQP ), which should be immediately accretive to DCF per unit upon closing, be credit neutral, drive future synergies to further enhance the DCF per unit accretion, extend ET's value chain in key basins, increase its exposure to fee-based margin businesses, and add additional long-term contracted assets with investment grade counterparties. As the graphic below illustrates, ET's portfolio is very large, reaching the key basins across the United States while also benefiting significantly from the growth in LNG exports.
ET Portfolio (Investor Presentation)
Both businesses also generate the vast majority of their income from commodity price resistant fee-based contracts, with ET generating ~90% of its adjusted EBITDA from fee-based contracts and ~80% of EPD's adjusted EBITDA coming from fee-based contracts. This makes them very stable cash flow generators regardless of broader market conditions and explains why EPD in particular has been able to grow its distribution so consistently in the face of major economic downturns and oil price crashes.
A final important note is that EPD insiders own nearly one-third of their partnership while ET insiders own ~11% of their partnership. While EPD's insiders are even more aligned with unitholders than ET insiders are, it suffices to say that both firms are closely aligned with unitholders, especially because ET's founder and Executive Chairman - Kelcy Warren - holds the majority of his net worth in ET units and continues to buy more quite aggressively over time. Moreover, ET's two co-CEOs are required to hold 6x their annual base salary in ET units.
EPD Stock Vs. ET Stock: Balance Sheets
When it comes to balance sheet, EPD is the clear winner here.
ET has made significant progress in recent years on its balance sheet, paying down billions of dollars in debt, bringing the leverage ratio down to within management's target range of 4.0x-4.5x, and even earning a credit rating upgrade to BBB from S&P. Clearly, ET's balance sheet is quite solid and in little risk of near-term financial challenges.
That being said, EPD has also brought its leverage ratio down to ~3.0x - one of the lowest marks in the entire industry - and earned a credit rating upgrade from S&P this year to A-, which is the best credit rating in the entire midstream industry. It also has $4 billion in total liquidity, nearly enough to cover all maturities between now and 2027. Moreover, its weighted average term to maturity of 19.7 years (82% of its debt matures in 10 years or more and 51% of its debt matures in 30 years or more) and the fact that 96.7% of its debt is at fixed rates (4.6% weighted average interest rate) means that it is set up to compound unitholder equity at high spreads to its cost of capital for decades to come.
EPD Stock Vs. ET Stock: Distribution Outlook
Moving forward, both EPD and ET have attractive distribution outlooks.
First and foremost, despite their hefty payouts, both distributions look to be very safe. Based on consensus analyst estimates, ET's 2023 distributable cash flow is expected to cover its distribution by 1.95x while EPD's 2023 distributable cash flow is expected to cover its distribution by 1.74x.
Through 2027, analysts expect ET to grow its distribution at a 4.3% CAGR, which is in-line with management's 3-5% CAGR guidance range. Meanwhile, analysts are guiding for a ~5% CAGR in EPD's distribution in the coming years, which is in-line with management's recent distribution growth rate over the past few years.
While ET's coverage ratio is currently stronger than EPD's, EPD's stronger balance sheet gives it more flexibility in returning capital to unitholders, helping to drive its stronger anticipated growth rate in the coming years. Moreover, ET's management is likely going to be spending more aggressively on growth projects than EPD will be. Given EPD's historically superior returns on invested capital relative to ET's, this should not be a problem for them as they do not need to invest as much capital in order to generate similar growth rates as ET.
EPD Stock Vs. ET Stock: Valuations
When it comes to valuation, both stocks look undervalued right now:
| Metric |
| EV/EBITDA |
| 5-Yr EV/EBITDA |
| P/DCF |
| Distribution Yield |
| ET |
| 7.80x |
| 8.42x |
| 5.6x |
| 9.3% |
| EPD |
| 9.26x |
| 10.00x |
| 7.7x |
| 7.7% |
Both ET and EPD trade at meaningful discounts to their historical average EV/EBITDA ratios, with both ET and EPD trading at a 7.4% discount to their respective historical EV/EBITDA ratio. ET, meanwhile, trades at a steep P/DCF discount to EPD, reflecting its substantially greater leverage as well as its lower EV/EBITDA valuation. As a result, it is unsurprising to see it trading at a higher distribution yield.
EPD Stock Vs. ET Stock: Investor Takeaway
Both of these midstream businesses are high quality, operating well right now, and enjoy strong balance sheets after several years of prudent deleveraging efforts as well as moves to improve distribution coverage ratios. Both are also moving into a phase where steady distribution growth should be the norm.
Yet, despite these obvious strengths and their defensive quality in a weakening economic environment, they both continue to appear undervalued. While ET offers the greatest total return potential given its greater leverage and cheaper valuation, EPD has considerably less risk given its lower leverage, higher credit rating, and superior long-term returns on invested capital.
Overall, we like both of these midstream infrastructure businesses equally from a risk-reward standpoint and rate them both Buys right now.
For further details see:
Better High Yield Buy: Enterprise Products Partners Or Energy Transfer?