GILD - Big Pharma R&D Spending: The Secret Ingredient To Outperformance?
2023-09-26 12:20:20 ET
Summary
- I examine the applicability of relative R&D spending as a potential leading indicator of shareholder returns.
- In addition, the correlation of R&D spending with stock volatility and sales growth is examined.
- It's found that high R&D spending does not necessarily lead to sales growth, let alone shareholder returns.
- Conversely, bold M&A transactions should not generally be seen as a sign of desperation and a consequence of poor internal R&D productivity.
Introduction
The outperformance of pharmaceutical company Eli Lilly and Company ( LLY ), due in large part to its diabetes and obesity franchise (Trulicity/dulaglutide and, more recently, Mounjaro/tirzepatide), is no real secret. Over the past 20 years, LLY stock has outperformed the S&P 500 Index ( SPY ) by about 250 basis points on an annual basis, and over the last ten years, it has grown at a compound annual growth rate of more than 25%, compared to SPY's CAGR of 11.8%.
Eli Lilly is known for its relentless focus on research and development (R&D), and it's hard to argue against the current quality of its drug pipeline. The company's R&D spending is well above the industry average, according to investor service Morningstar . It's well known that bringing a new drug to market can indeed be a very costly endeavor, so above-average R&D spending should theoretically translate into above-average returns, assuming adequate R&D productivity. Literature-based research suggests that pre-launch R&D costs for a drug vary widely, ranging from as little as $161 million to as much as $4.54 billion. Of course, cancer therapeutics tend to be the most expensive to develop ($944 million to $4.54 billion, according to the study). Staying innovative is also an important priority from the perspective of the Inflation Reduction Act . Consider, for example, that small molecule drugs can now be selected for price negotiations seven years after approval, while biologics are exempt for 11 years. Negotiated prices are implemented two years later.
In this article, I will take a closer look at the R&D spending of several large pharmaceutical and biotech companies to assess whether sustained high investment in the business is indeed a guarantor of above-average shareholder returns (or at least solid top-line growth). In addition to Eli Lilly, I will take a look at AbbVie Inc. ( ABBV ), Amgen Inc. ( AMGN ), Bristol Myers Squibb Company ( BMY ), Gilead Sciences Inc. ( GILD ), Merck & Co., Inc. ( MRK ), and Pfizer Inc. ( PFE ).
A Few Words On The Methodological Details
With the exception of AbbVie, all the companies considered have been publicly traded for several decades. AbbVie was spun off from Abbott Laboratories in 2012 and the separation was completed in January 2013. Therefore, I included each company's data for the last 11 years in my analysis.
Since it's well known that companies such as Pfizer (Comirnaty and Paxlovid), Merck (Lagevrio), Gilead (Veklury) and to a lesser extent Eli Lilly (antibody treatments) had more or less "one-off" revenues due to the COVID-19 pandemic, I have adjusted the revenue figures accordingly. This may sound academic and unnecessary at first glance, but consider that Pfizer generated nearly 52% of its 2021-2022 sales from its COVID-19 vaccine and antiviral treatment. In my view, including these revenues would lead to an overly conservative measure of relative R&D expenses during this period. Besides adjusting revenues, I adjusted R&D expenses for material one-time impairment charges.
Finally, I decided to include only U.S.-based pharmaceutical companies to ensure comparability from an accounting perspective. R&D costs are treated quite differently under IFRS. For example, internally developed intangible assets are capitalized under IFRS, whereas they are expensed under U.S. GAAP.
Comparing R&D Expenses By Seven Major U.S. Pharma And Biotech Companies
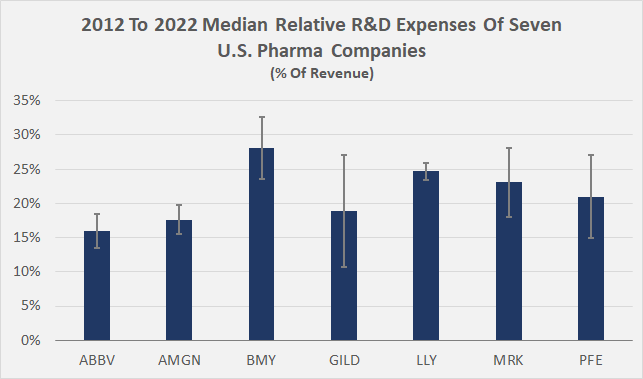
Figure 1 shows the median R&D expenses of the seven companies as a percentage of annual revenues. Bristol Myers spent a whopping 27% of average 2012-2022 sales on R&D, while AbbVie spent only 16%. The low percentage in the case of AbbVie is due in significant part to the great success of Humira (adalimumab).
Figure 1: 2012 to 2022 median R&D expenses of seven U.S. pharma companies in percent of adjusted revenue (own work, based on company filings)
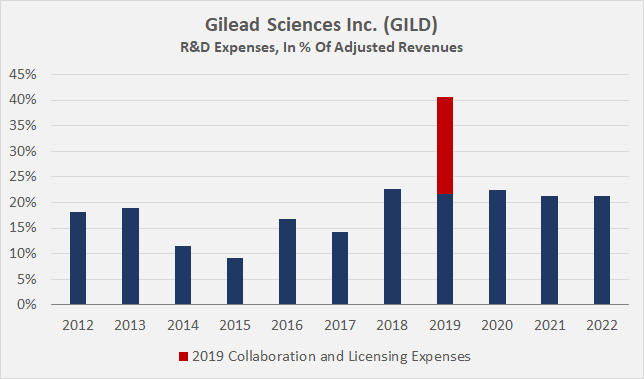
However, it's also interesting to note the extremely low standard deviation of Lilly's R&D expenses, which suggests that the company is indeed very consistent with its investments, while Gilead's R&D spending appears somewhat arbitrary (absolute and relative standard deviations of 8% and 42%, respectively), which requires closer examination. The increase in relative R&D spending in 2019 is due to up-front collaboration and licensing expenses (p. 36, 2019 10-K , Figure 2). Excluding these expenses, the volatility of Gilead's relative R&D investment is much more in line with peers (4.6% standard deviation).
Figure 2: Gilead Sciences Inc. (GILD): 2012 to 2022 R&D expenses in percent of adjusted revenue (own work, based on company filings)
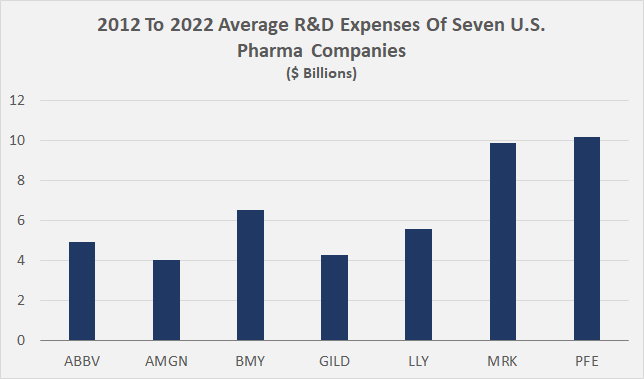
In absolute terms, Merck and Pfizer spent the most on R&D over the last 11 years, around $10 billion annually each (Figure 3). Considering that companies generally increase R&D spending more or less constantly over the years, the absolute figures should of course be taken with a grain of salt. Nevertheless, it's interesting to see that the company with the weakest average sales "growth" over this period (Pfizer, -1.9% per year) spent the most on R&D ($112 billion over 11 years). Of course, one could argue that revenue performance was significantly impacted by the 2020 spin-off of Viatris Inc. ( VTRS ). However, even when looking at median revenue growth, which is not biased by the Viatris-related drop in revenues, Pfizer still performs the worst (-1.7% per year).
Figure 3: 2012 to 2022 average R&D expenses of seven U.S. pharma companies in absolute amounts (own work, based on company filings)
The data for Pfizer suggest potentially poor R&D productivity, which could be one reason the company has been spending heavily on mergers and acquisitions (M&A) since its commercial success with Comirnaty and Paxlovid. Pfizer acquired Arena Pharmaceuticals in December 2021, Biohaven in October 2022, and announced its bold $43 billion takeover of Seagen Inc. ( SGEN ) in March 2023.
In the context of bold M&A, AbbVie, Amgen and Bristol Myers come to mind. AbbVie and Bristol Myers have acquired Allergan plc and Celgene Corp. , respectively, in 2019, and Amgen has announced the acquisition of Horizon Therapeutics plc in late 2022. However, all three exhibit significant median revenue growth over the past decade: 11.1%, 5.0%, and 8.8% per year, respectively. For the period 2013 to 2019, AbbVie and Bristol Myers' median revenue growth was 10.1% and 8.6%, respectively. A research article focusing on the period 2001 to 2020 came to the conclusion that the R&D productivity of Amgen and Bristol Myers is quite positive indeed. The same is likely true for AbbVie, and I consider it likely that the researchers did not include AbbVie simply due to its formation in 2013. The same article concluded that Gilead, along with Amgen, benefited the most from new innovation compared to peers.
Research and development efforts should ultimately translate to revenue growth, so relative R&D spending and revenue growth should be positively correlated. However, a calculation for the period 2012 to 2022 yields a correlation coefficient of -0.06 (no correlation). In my view, it's reasonable to consider a gap between R&D spending and sales growth because it takes several years for a newly-researched drug to reach the market and generate significant revenues. With a gap of three or five years, the correlation coefficient in both cases is 0.43 - not overly strong, but nonetheless positive.
However, even if high relative R&D spending in a given period translates to more or less significant revenue growth with a lag of several years, this does not necessarily mean that this also will be reflected in the return for shareholders.
A correlation analysis of the long-term median of R&D expenses and total returns (capital appreciation and dividends, excluding taxes and reinvestment of dividends) gives a coefficient of -0.15. Of course, it makes little sense to conclude from the slightly negative number that R&D spending and shareholder returns are inversely correlated. Considering a three- or five-year gap as above yields correlation coefficients of 0.08 and 0.14, respectively. Similar correlation coefficients resulted when absolute R&D spending was used in the calculations. Of course, replacing absolute returns with returns relative to an index such as the S&P 500 did not yield different results.
Clearly, these are not significant positive correlations, and the results suggest that it's not useful to use a financial metric such as relative R&D expenses as a leading indicator of shareholder returns. Given the multitude of factors that affect a stock's performance (e.g., macroeconomic events, M&A, pipeline twists, growth expectations), there's no way around thorough due diligence.
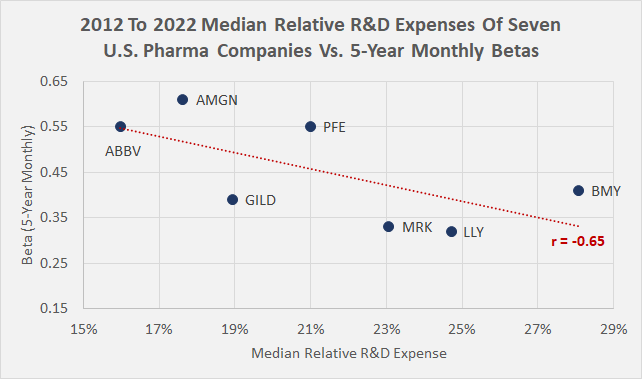
However, one could still argue that the stock of a company that invests significantly in R&D has below-average volatility. And indeed, according to Figure 4, relative R&D expenses are negatively correlated with beta. Using annualized weekly average volatility yields a similar negative correlation, but I nonetheless think beta - the volatility of a stock relative to the overall market - is a better comparator.
Figure 4: 2012 to 2022 median R&D expenses of seven U.S. pharma companies in percent of adjusted revenues versus 5-year monthly betas (own work, based on company filings and volatility data from Yahoo Finance)
Conclusion
The article compared R&D expenses of seven large U.S.-based pharmaceutical and biotechnology companies in an effort to identify this important investment pillar as a potential leading indicator of shareholder returns. However, no significant positive correlation was found between relative (and absolute) R&D spending and stock performance, even when a gap of several years is considered. Given the multitude of moving factors that influence a stock's performance over the years, there's no way around thorough due diligence, and investors should be wary of extrapolating the association between Eli Lilly's consistently high R&D spending and its impeccable stock performance to the sector as a whole.
However, while high relative R&D spending is not necessarily indicative of outsized future stock returns, a correlation analysis suggests that the stocks of companies with above-average R&D spending exhibit comparatively low volatility.
Finally, relative R&D spending and revenue growth were found to be positively correlated when a gap of several years is considered. This makes sense considering how complex and time-consuming the development and approval of drugs is. However, above-average R&D spending that does not translate into significant top-line growth over the long term can be taken as an indication of potentially deeper issues. While Pfizer spent the most on R&D relative to the peer group over the past decade ($112 billion), it performed the worst in terms of median revenue growth (-1.7% annually). R&D productivity is a parameter that researchers have found to be inadequate at several large pharma and biotech companies, such as Pfizer, Merck, but also Roche ( OTCQX:RHHBY , OTCQX:RHHBF ). However, I would not rely too much on such data and keep in mind the dynamics and complexity of drug discovery. An example of why such data should not be over-interpreted is Merck's great success with its cancer drug Keytruda.
Consequently, companies that are unable to translate their significant R&D spending into meaningful revenue growth may have to resort to M&A, and I suspect Pfizer falls into this category. Conversely, I would not necessarily take bold acquisitions as a sign of poor internal R&D, as the examples of AbbVie and Bristol Myers Squibb show.
Therefore, I consider appropriate diversification to be the single most important aspect when investing in pharmaceutical and biotech companies.
Thank you for taking the time to read my latest article. Whether you agree or disagree with my conclusions, I always welcome your opinion and feedback in the comments below. And if there's anything I should improve or expand on in future articles, drop me a line as well. As always, please consider this article only as a first step in your own due diligence.
For further details see:
Big Pharma R&D Spending: The Secret Ingredient To Outperformance?