SHEL - BP: Declining Commodity Prices Are Not Helping
2023-06-26 09:31:53 ET
Summary
- BP reported first quarter adjusted earnings of $1.66 per ADR share on a replacement cost basis, beating analysts' expectations.
- The quarter's production was 2,329K Boep/d, up 3.4% compared to last year and up 2.8% sequentially.
- I recommend buying BP between $33.4 and $34.0, with possible lower support at $32.8.
Introduction
London-based BP p.l.c. ( BP ) released its first quarter 2023 results on May 2, 2023.
Note: I have followed BP quarterly since 2014. This new article updates my article published on March 21, 2023.
1 - 1Q23 results snapshot
BP reported first-quarter adjusted earnings of $1.66 per ADR share on a replacement cost basis, beating analysts' expectations. However, it was down from $1.72 reported a year ago.
Total revenues (including other investments) were $56.951 billion , up significantly from $51.22 billion last year.
The increase in quarterly earnings was due to the rise in oil-equivalent production volumes of 2,329K Boep/d. The positives were partially affected by lower realizations of commodity prices and a decline in refinery throughputs.
BP announced a quarterly dividend increase to $0.3966 per ADR share and expects a $1.75 billion share buyback program to be completed before the end of the second-quarter results. The dividend yield is now 4.56%.
BP disclosed plans to execute a $1.75 billion share buyback program, which is expected to be completed before its second-quarter results.
Note: The price of hydrocarbons received by BP this quarter was $54.74 per Boe, and the natural gas price was $7.20 per MMBtu.
2 - Stock performance
BP is part of my "seven oil majors" group, including Exxon Mobil ( XOM ) and Shell plc ( SHEL ), Equinor ( EQNR ), TotalEnergies SE ( TTE ), Chevron ( CVX ), and the E&P ConocoPhillips ( COP ). By the way, ConocoPhillips is not an oil supermajor but a strong oil company that I have added to the group.
BP is up 27% on a one-year basis and has outperformed its peers on a one-year basis.
CFO Murray Auchincloss said in the conference call:
In the first quarter, we reported a headline profit of $8.2 billion allowing for post-tax adjusting items of $3.7 billion and an inventory holding loss of $500 million. Our underlying replacement cost profit was $5 billion. Despite the backdrop of lower average commodity prices.
3 - Investment thesis
2022 was a pivoting year for BP, signaling a remarkable turnaround for the company. The oil and gas prices rallied in the second part of the year, allowing BP to strengthen its balance sheet and reduce debt significantly.
However, oil and gas prices have been steadily dropping since June last year, and the first quarter of 2023 shows a weakening situation but is still healthy.
Free cash flow generation has been cut by half sequentially, and there is no sign of changing trend with a still credible threat of global recession in H2 2023 or early 2024. In short, the excitement is gone, and oil and gas prices are back to a more reasonable level.
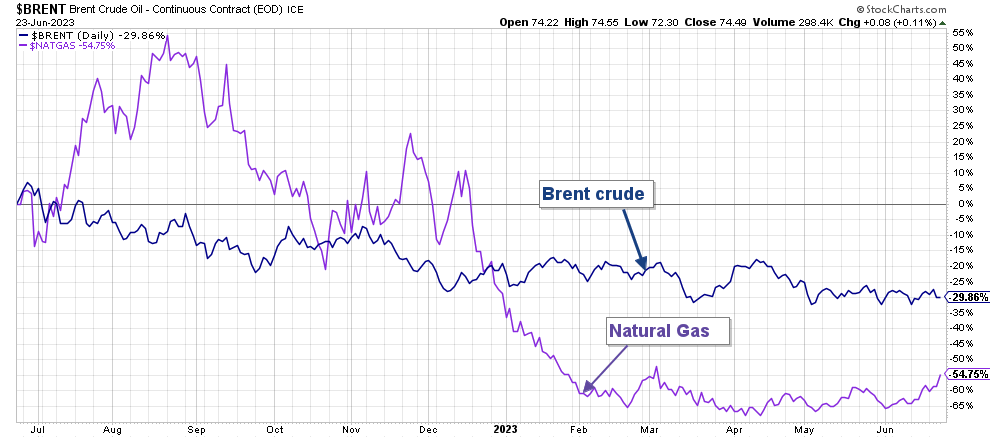
BP 1-Year Chart Oil and Gas Prices (Fun Trading StockCharts)
CFO Murray Auchincloss said in the conference call:
Turning to business group performance compared to the fourth quarter. In gas and low carbon energy, the result benefited from an exceptional gas marketing and trading result, partly offset by lower gas realizations. In oil production and operations, the result reflects lower liquids and gas realizations. In customers and products, the products result reflects a lower level of turnaround activity and a very strong oil trading result partly offset by lower refining margins.
However, I still believe investors should invest in BP long-term, but not without restriction. Investing in BP requires a specific strategy, combining a long-term investment with some short-term trading LIFO or something similar for investors who cannot trade LIFO.
Applying the right trading/investing strategy is crucial to maximizing your return, especially in stocks that depend on commodity prices and their cyclicity.
Thus, as I said in my preceding article, long-term investors should continue accumulating this cyclical stock on any significant weaknesses. But, due to extreme volatility in the oil industry and the costly shift to renewable, I recommend short-term trading LIFO. About 40% to 50% should be allocated to this task to minimize the risks of a sudden severe retracement recurring like clockwork.
BP Plc - Financial Table 1Q23: The Raw Numbers
Note: Each BP ADS represents six (6) "ordinary shares" of BP. Ordinary shares are the English equivalent of common stock in a U.S. corporation.
| BP |
| 1Q22 |
| 2Q22 |
| 3Q22 |
| 4Q22 |
| 1Q23 |
| Revenues in $ Billion |
| 49.26 |
| 67.87 |
| 55.01 |
| 69.26 |
| 56.18 |
| Total Revenues and others in $ Billion |
| 51.22 |
| 69.51 |
| 57.81 |
| 70.36 |
| 56.95 |
| Net income in $ Billion |
| -20.38 |
| 9.26 |
| -2.16 |
| 10.80 |
| 8.22 |
| EBITDA $ Billion |
| -13.20 |
| 18.21 |
| 6.29 |
| 21.09 |
| 16.54 |
| EPS diluted in $/share |
| -6.27 |
| 2.83 |
| -0.69 |
| 3.50 |
| 2.70 |
| Cash from operating activities in $ Billion |
| 8.21 |
| 10.86 |
| 8.29 |
| 13.57 |
| 7.62 |
| Capital Expenditure Quarterly in $ Billion |
| 2.60 |
| 2.67 |
| 3.11 |
| 3.70 |
| 3.13 |
| Free Cash Flow in $ Billion |
| 5.61 |
| 8.20 |
| 5.18 |
| 9.88 |
| 4.49 |
| Total cash (+other investments) $ Billion |
| 34.51 |
| 33.24 |
| 29.60 |
| 23.91 |
| 30.88 |
| Gross Debt in $ Billion (not including lease) |
| 60.61 |
| 52.87 |
| 46.56 |
| 46.95 |
| 48.60 |
| Dividend per share in $ |
| 0.3276 |
| 0.36036 |
| 0.36036 |
| 0.3966 |
| 0.3966 |
| Shares outstanding (diluted) in Billion |
| 3.252 |
| 3.270 |
| 3.148 |
| 3.028 |
| 3.040 |
| Oil Production Detail and Renewable |
| 1Q22 |
| 2Q22 |
| 3Q22 |
| 4Q22 |
| 1Q23 |
| Oil Equivalent Production in K Boep/d |
| 2,252 |
| 2,198 |
| 2,298 |
| 2,265 |
| 2,329 |
| Production Rosneft in K Boep/d |
| 750 |
| 0 |
| 0 |
| 0 |
| 0 |
| Global liquid price ($/Boe) |
| 64.70 |
| 73.24 |
| 74.08 |
| 66.18 |
| 54.74 |
| Global Natural gas price ($/M BTU) |
| 8.24 |
| 8.31 |
| 10.41 |
| 9.59 |
| 7.20 |
| Total Developed renewables to FID and Renewables pipeline in net GW |
| 29.5 |
| 30.1 |
| 31.5 |
| 43.0 |
| 44.7 |
Sources: Company release
* The total equivalent Production represents the gas production operations for 969K Boep/d and oil production operations for 1,360K Boep/d in 1Q23.
Analysis: Revenues, Earnings Details, Free Cash Flow, And Upstream Production
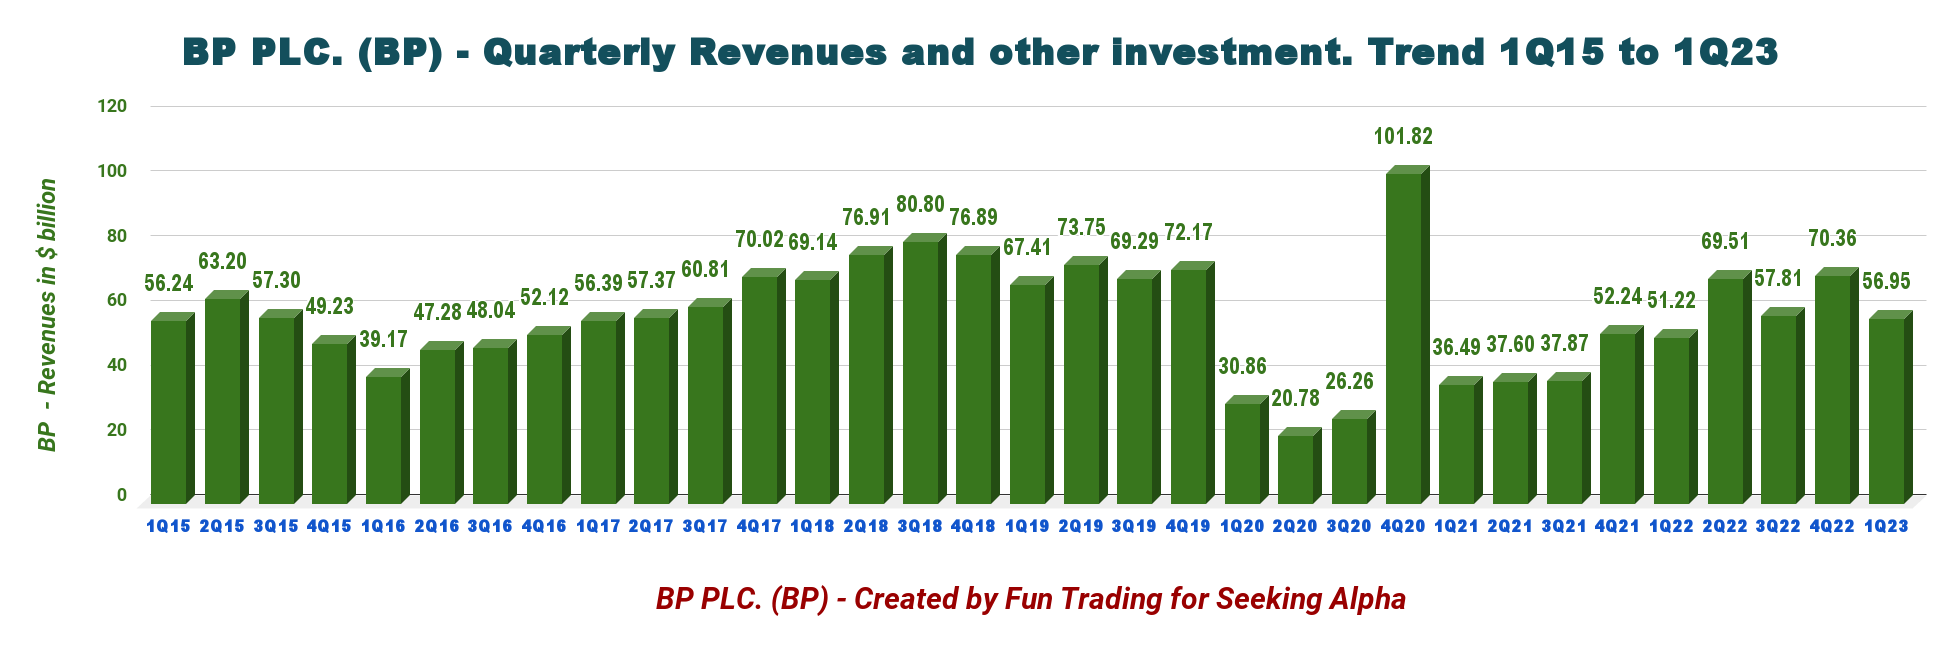
1 - Quarterly total revenues and other investments were $56.95 billion in 1Q23
Note: The company has restated the four quarters of 2020.
BP Quarterly Revenues History (Fun Trading)
BP had total revenues of $56.951 billion for the quarter (oil revenues are $56.182 billion). CapEx in the first quarter of 2023 was $3.13 billion, compared with $2.60 billion in the first quarter of 2022.
The income attributable to BP's shareholders in the first quarter was solid, with $8.22 billion compared with a loss of $20.38 billion last year.
The better-than-expected quarterly earnings were due to an increase in oil-equivalent production volumes reaching 2,329K Boep/d. However, it was partially offset by lower realizations of commodity prices and weakening refinery throughputs.
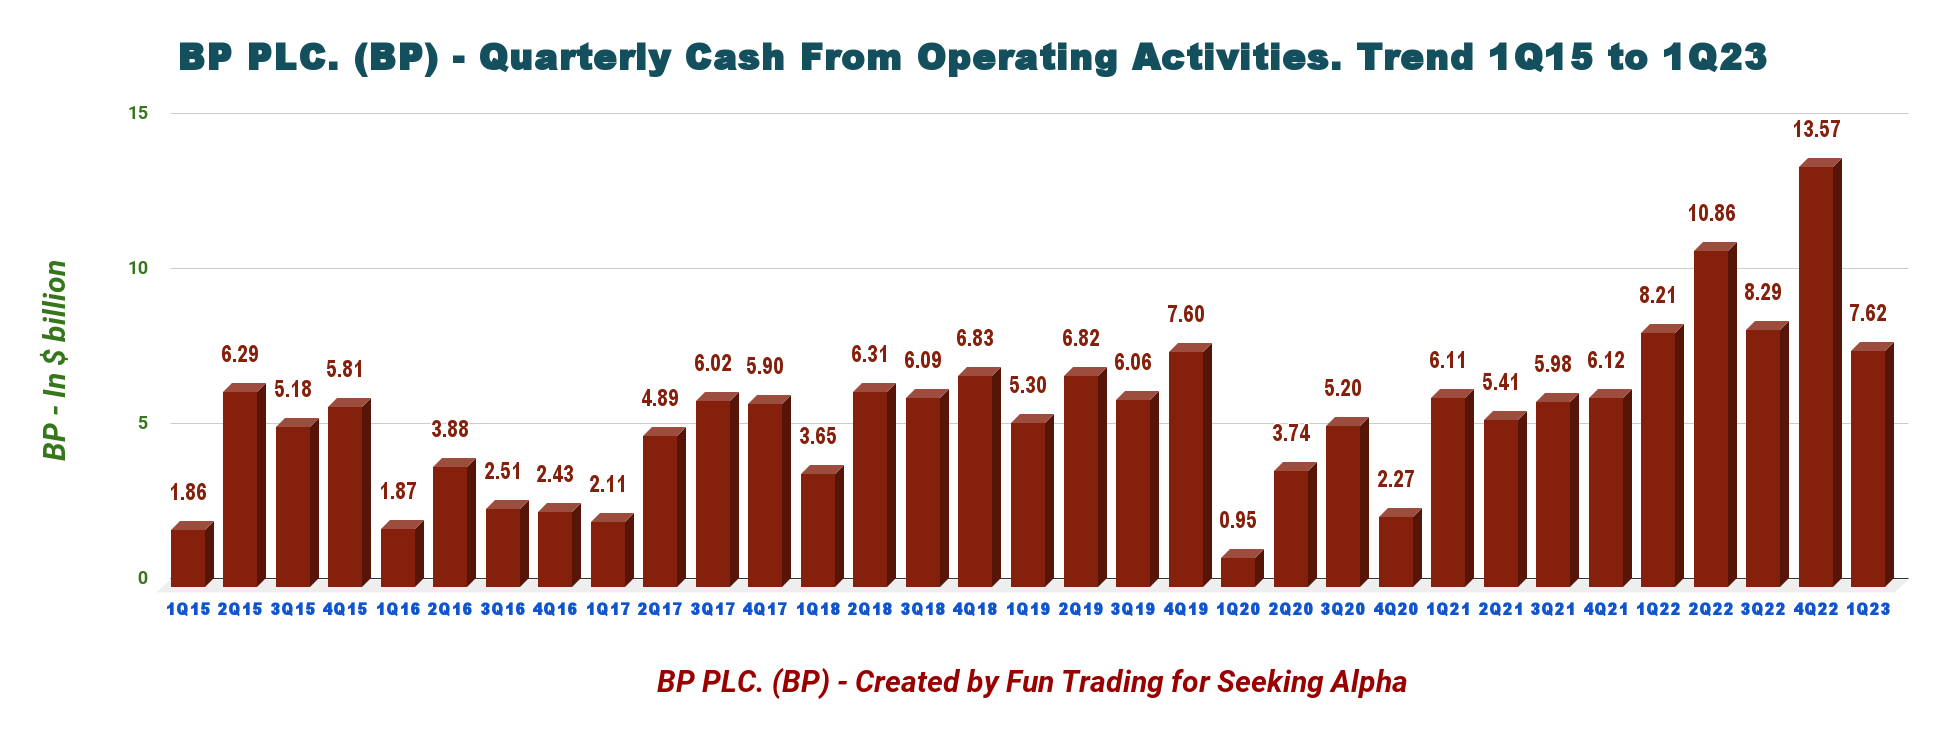
Operating cash flow in the quarter of $7.622 billion compared to $8.210 billion in 1Q22.
At the end of the first quarter, net debt was $21.232 billion, gearing at 19.6% . There is noticeable progress in this segment, even if I continue to believe the company could eventually use more cash to cut debt instead of unnecessary expensive buybacks.
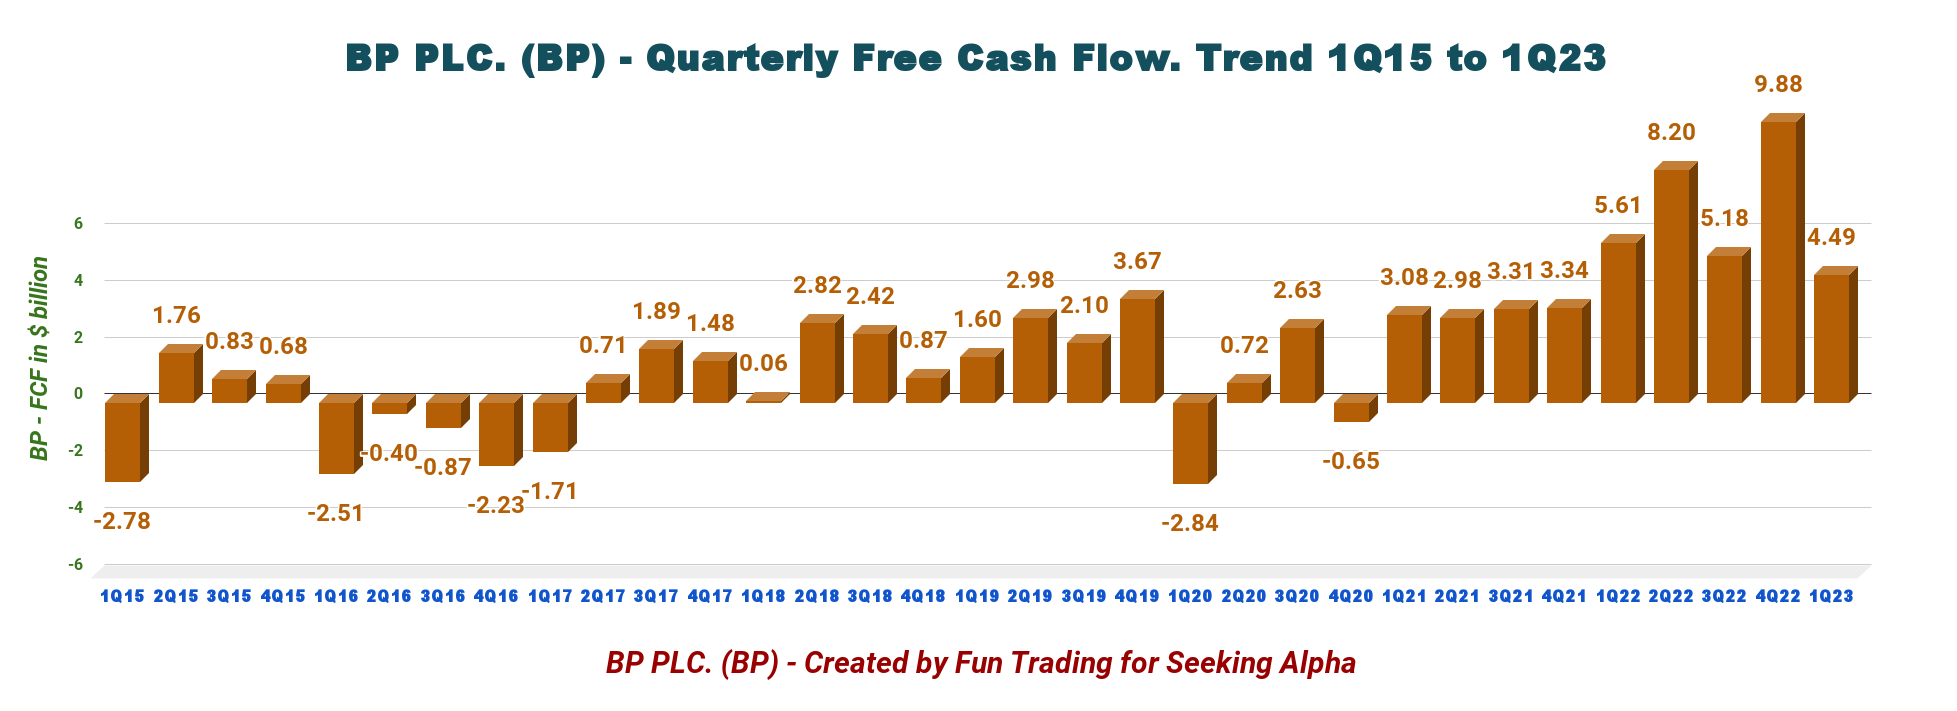
2 - Free cash flow (not including divestitures)
BP Quarterly Free Cash Flow History (Fun Trading)
Trailing 12-month free cash flow ("ttm") was $27.748 billion , with a first-quarter 2023 of $4.493 billion .
The chart below shows that cash flow from operations decreased sequentially to $7.622 billion .
BP Quarterly CFO History (Fun Trading)
$0.3966 per ADR
share and expects a
$1.75-billion share buyback program
to be completed before the end of the second-quarter results. The dividend yield is now
4.56%.
Note: BP ADR dividend is six times the ordinary dividend or $0.3966 per ADR share.
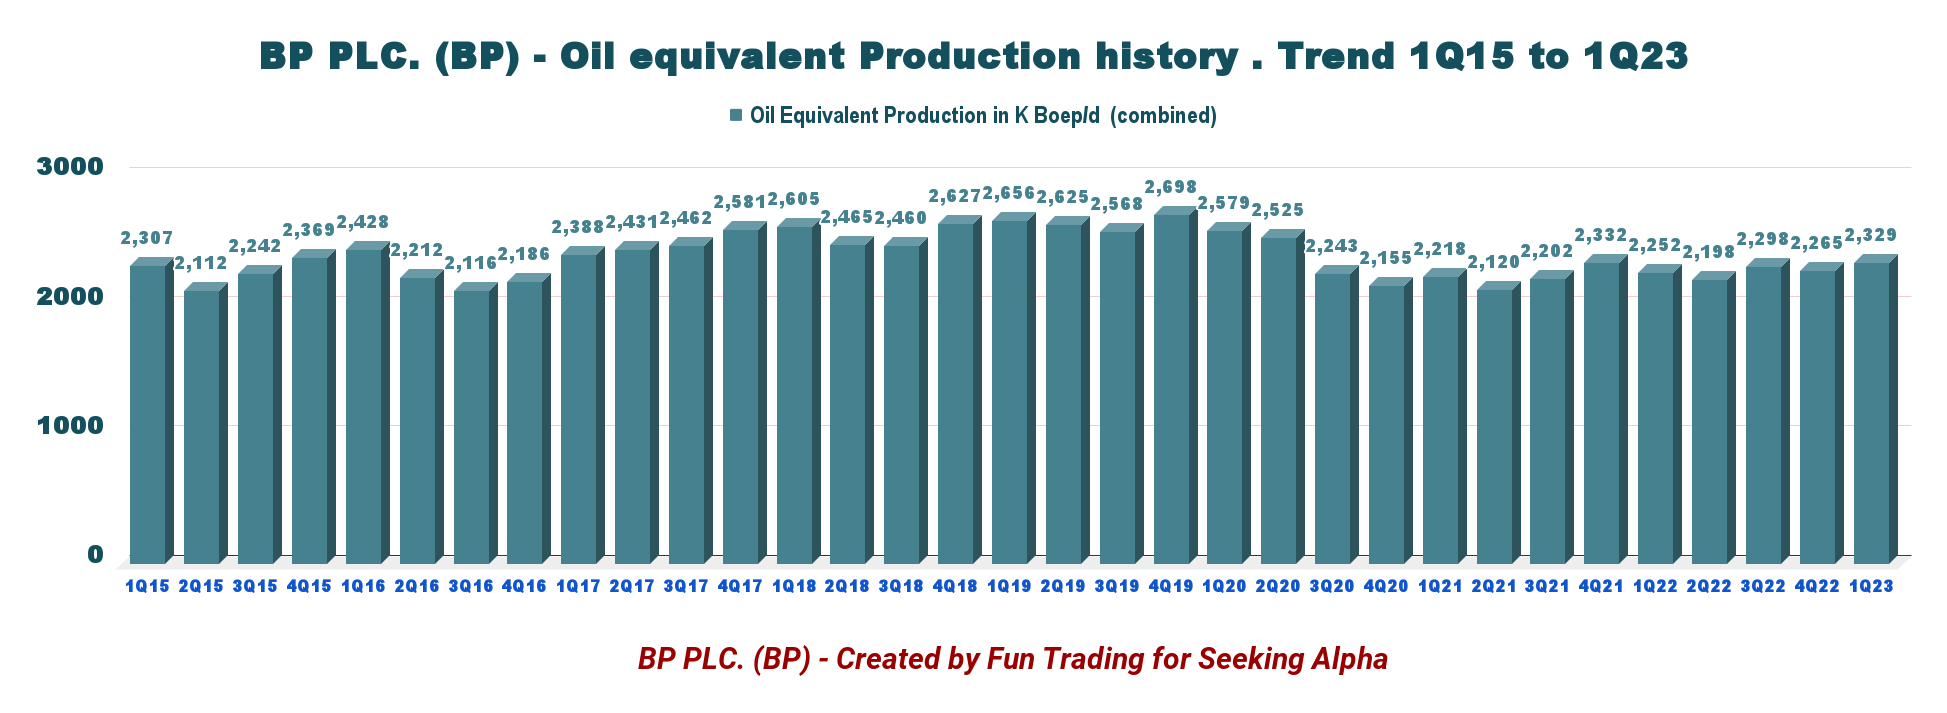
3 - Oil equivalent production
BP Quarterly Oil Equivalent Production History (Fun Trading)
- Upstream: The quarter's production was 2,329K Boep/d , up 3.4% compared to last year and up 2.8% sequentially. Oil production and operations represent 1,360K Boep/d , and gas and low carbon energy represent 969K Boep/d.
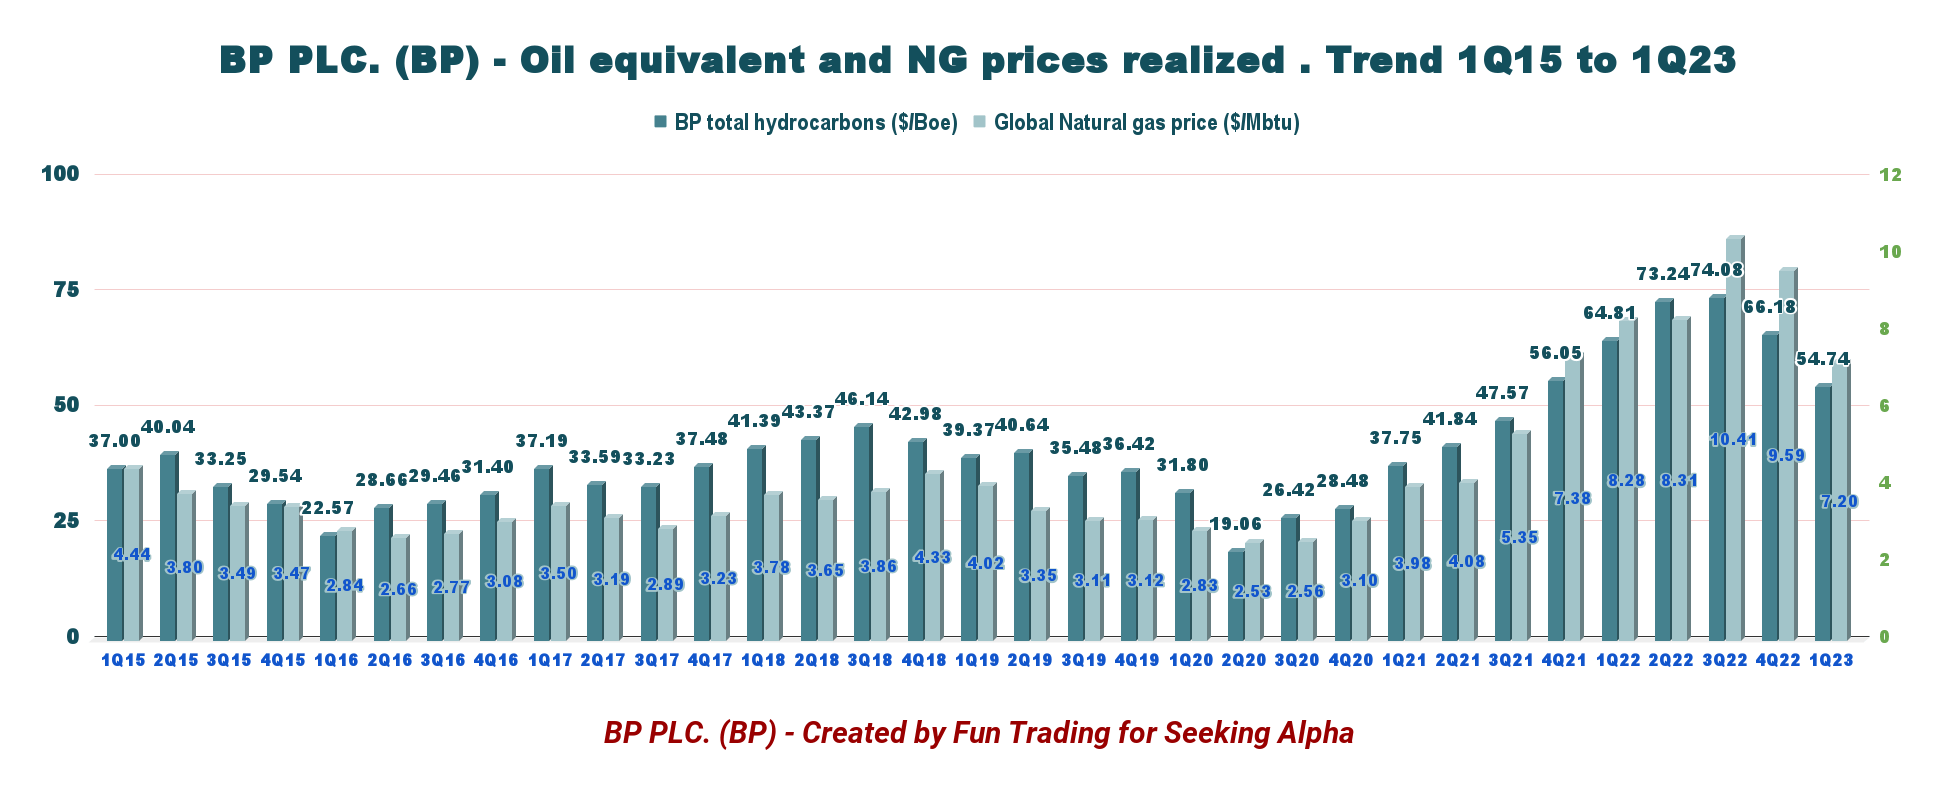
The company sold its total hydrocarbon per Boe at $54.74 during the first quarter compared with $64.81 in the same period last year. The natural gas price was $7.20 per thousand cubic feet compared with $8.28 in the year-ago quarter.
Warning: I expect oil and gas prices to weaken again in 2Q23.
BP Quarterly Oil and NG Prices (Fun Trading)
- Gas and low-carbon energy
Profits increased to $3,456 million in 1Q23 from a profit of $3,595 million last year, mainly due to decreased liquid and gas prices YoY.
In the first quarter, total production was 969K Boep/d, down from 966K Boep/d last year. Also, in this category, the company indicates the total developed renewables to FID and renewables pipeline jumped to 44.7 GW , up from 29.5 GW last year.
- Oil production and operations
The total production of 1,360K Boep/d for the first quarter was up from 1,286K Boep/d in the year-ago quarter.
After adjusting for non-operating items, underlying replacement cost earnings before interest and tax for the segment were $3,319 million. It compares to $4,683 million in the year-ago quarter due to lower commodity price realizations. BP sold liquids at $71.63 a barrel in the first quarter compared with $83.47 in the prior-year period. It sold natural gas at $6.57 per thousand cubic feet compared with $9.55 in the year-ago quarter. Hydrocarbon price realization rose to $62.36 per Boe from $76.85.
- Customer & products
Underlying RC earnings before interest and tax were $2,759 million in 1Q23, up from $2,156 million last year. The increase was due to a significant improvement in refining marker margin.
BP-operated refining availability in March was 96.1%, increasing from 95% in the year-ago quarter.
Total refinery throughputs from the second quarter were reported at 1,518 thousand barrels per day (MBbl/D), declining from 1,650 MBbl/D in the prior-year quarter.
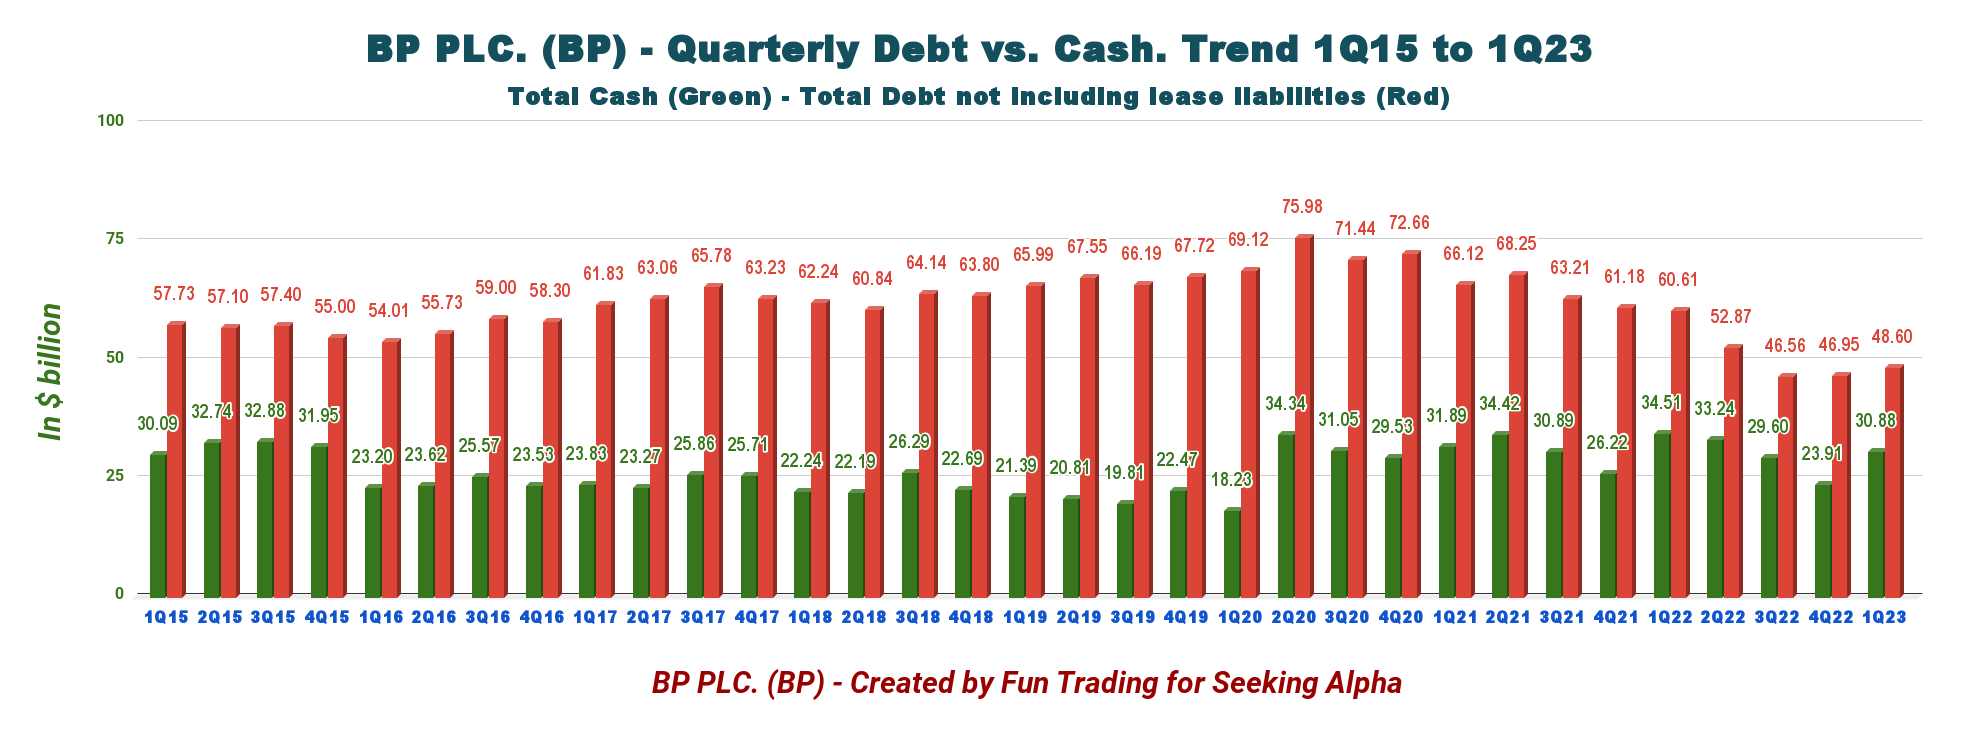
4 - Net debt is $21.23 billion in 1Q23
BP Quarterly Cash versus Debt History (Fun Trading)
BP's net debt is now $21.232 billion , nearly unchanged QoQ. Gearing improved slightly sequentially to 19.6% .
The company had $30,883 million in cash, cash equivalent, and marketable securities; long-term debt, including current, was $48,595 million. It is a significant drop from $60,606 million in 1Q22. However, as we can see in the chart above, 1Q23 was not specifically positive in this segment.
The debt-to-equity ratio has dropped to 0.677 , according to YCharts, which is still high, Albeit improving significantly. It is clearly a sign that the company's buyback program should not be postponed until BP can reduce debt to a ratio below 0.5.
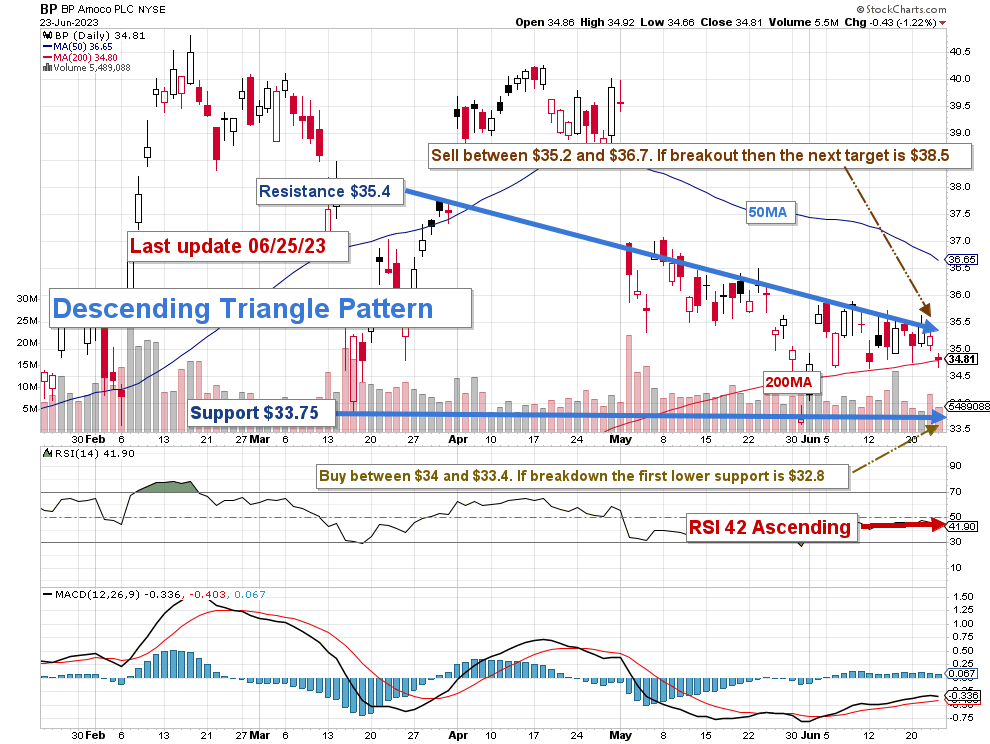
Technical Analysis and Commentary
BP TA Chart Short-term (Fun Trading StockCharts)
Note: The chart has been adjusted for the dividend.
BP forms a descending triangle pattern with resistance at $35.4 and support at $33.75 .
The trading strategy is to sell 40%-50% of your long position, partially between $35.2 and $36.7 , with possible higher resistance at $38.5.
The descending triangle pattern is considered a bearish continuation pattern. Thus, I expect a possible breakdown at the end of the pattern life, so taking some profit off now makes sense.
On the other hand, I recommend buying BP between $33.4 and $34.0 , with possible lower support at $32.8 .
Warning: The TA chart must be updated frequently to be relevant. It is what I am doing in my stock tracker. The chart above has a possible validity of about a week. Remember, the TA chart is a tool only to help you adopt the right strategy. It is not a way to foresee the future. No one and nothing can.
For further details see:
BP: Declining Commodity Prices Are Not Helping