CA - Build A 7%-Yielding Dream Retirement Portfolio With 12 Amazing Blue Chips
Summary
- 2023 is a time of maximum economic, inflation, and interest rate uncertainty. Stocks are likely to finish flat for the year, but might fall up to 20% along the way.
- High-yield investors are perfectly positioned to profit from the coming bull market because they are collecting safe 5% to 9% dividends while waiting for the bear market to end.
- Here are the 10 safest ultra-yield blue chips that yield a relatively safe 7.3% and offer 12.7% long-term return potential and 12% to 15% income growth.
- Combined with the best high-yield ETF, you can get a diversified 5.6% portfolio with the same 12.7% return potential but 16% historical dividend growth.
- Add in the best-managed futures ETF and you get a 6.7% yielding portfolio with 11.6% return potential whose peak decline was just 6% in 2022 and which gave investors a 28% dividend raise last year, 20% more than inflation.
This article was published on Dividend Kings on Wed, February 22nd, 2023.
---------------------------------------------------------------------------------------
2022 was the worst year for stocks since 2008 and the worst for a 60/40 retirement portfolio in 37 years.
Thanks to high inflation, soaring interest rates, and the most anticipated recession in history, almost nothing worked save for energy and managed futures.
2023 kicked off with a bang, giving hope to investors that maybe 2023 would be a blockbuster recovery year.
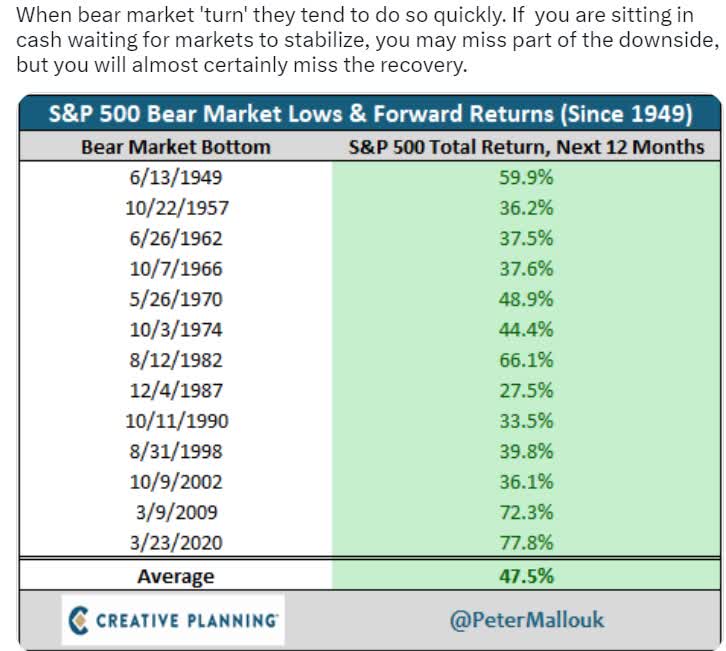
If October's low was the final low of this bear market, then history says investors are in for a great year.
But what if it wasn't the final bottom? The bond market is increasingly worried that inflation could be sticky and come down so slowly the Fed has to hike to levels that seemed absurd just a few months ago.
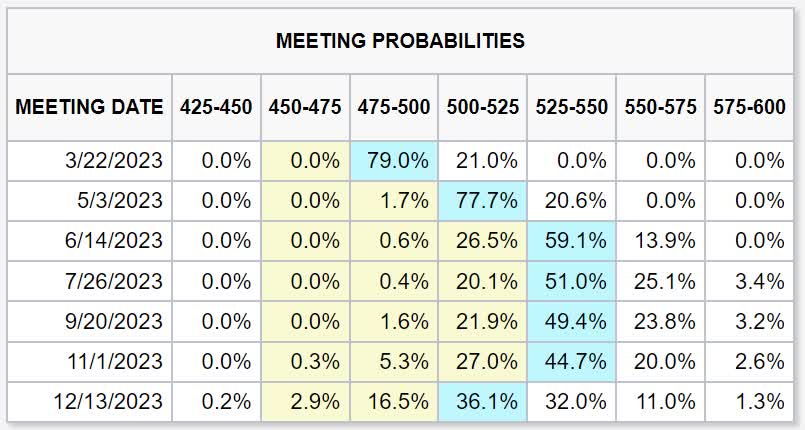
Currently, the bond market thinks the Fed will stop hiking in June at 5.25% and then hold for the rest of the year.
But there is a growing risk of the Fed going to 5.5% or even 5.75%. Fed officials have said 6% to 7% is likely the worst-case scenario.
Why are interest rates still rising if inflation peaked in June 2022 and has fallen for seven consecutive months?
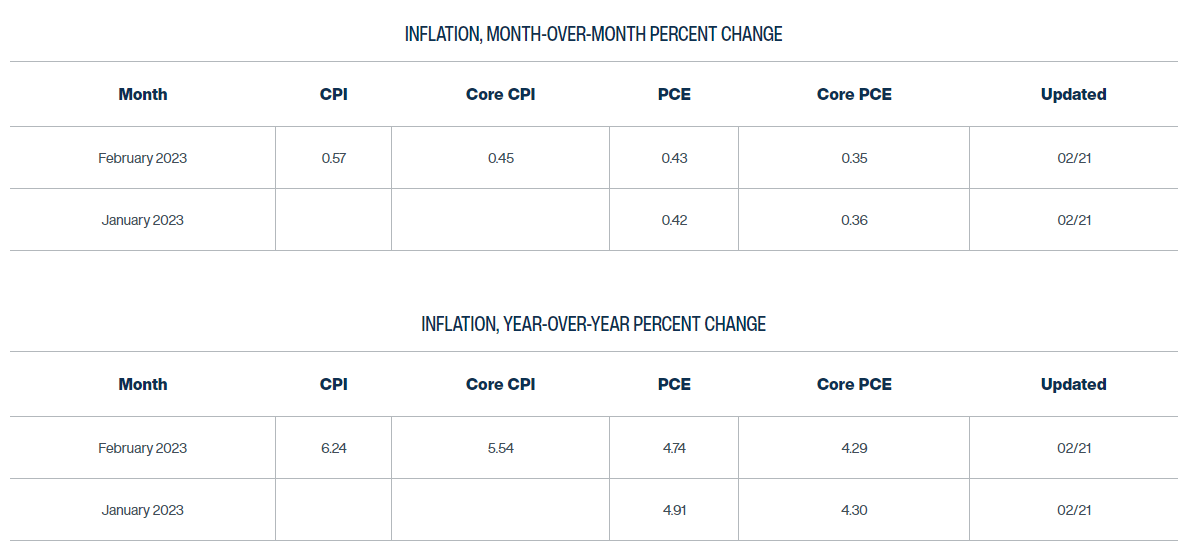
The Cleveland Fed's daily inflation tracking model now estimates that the March CPI report will come in at 6.2%, down from 6.4% in the February report, and 6.5% in the January report.
That's solid progress, and if that rate of disinflation holds, then CPI could end the year at 4.2%. Mind you, that's still more than double the Fed's official target, but it's a relatively good rate of falling inflation.
However, the Fed's official inflation gauge is core PCE, which the Cleveland Fed thinks is potentially getting stuck at 4.3%.
And now, with signs that the U.S. economy could be re-accelerating, the prospects of a "no landing" scenario have the bond market worried that the Fed might have to keep hiking us straight into recession.
- if the Fed hikes every meeting this year the Fed funds rate will end the year at 6.25%
- President Bullard's 7% worst-case scenario would be reached in May 2024.
There are a few reasons to worry about inflation getting stuck around 4% to 5%.
- global oil demand is expected to grow around 2 million bpd (2%) in 2023 but no additional supply is expected
- potentially causing oil prices to soar to $100 to $140
- commodity prices are starting to rise again
- the tightest job market in 54 years has unemployment still falling despite all the Fed rate hikes.
But what about the 12 to 18 month lag for Fed rate hikes to fully filter through the economy? Won't that ensure that the economy can't continue staying overheated?
Actually, some economists think the modern economy is so financialized that rate hikes filter through not in 12 to 18 months but just weeks or months.
If that's true, then the stronger-than-expected economy is continuing to thrive despite interest rates of almost 5%.
Remember that the U.S. economy in the 1990s grew at 4% with interest rates averaging 6%. It was also a great time to own stocks, though that was due to the worst stock market bubble in U.S. history.
So basically, while recession remains the most likely outcome, the risk of one is now lower than just three weeks ago.
That means earnings growth in 2023 is expected to be flat, rather than -5% to -20% as some economists expected at the start of the year.
But thanks to the stock market's 8th-best January in history, that good earnings news is already priced in.
So what's the most likely outcome for stocks in 2023?
Possibly a flattish year, but one marked by a 5% to 15% correction at some point this year.
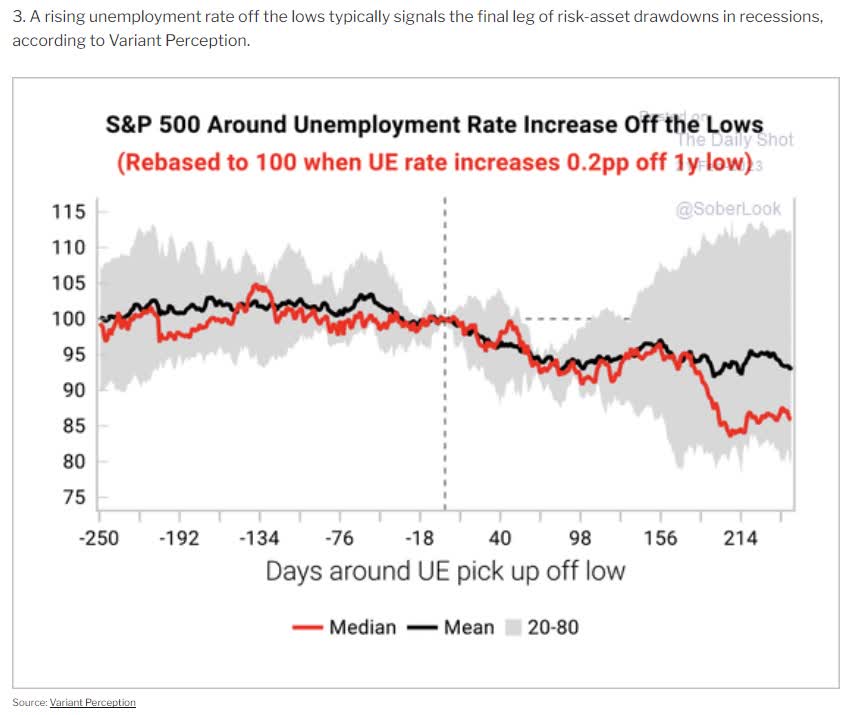
Historically, after unemployment rises, stocks fall 5% to 15% and sometimes as much as 20%.
What does this mean for smart long-term investors? That dividend blue chips are more valuable than ever.
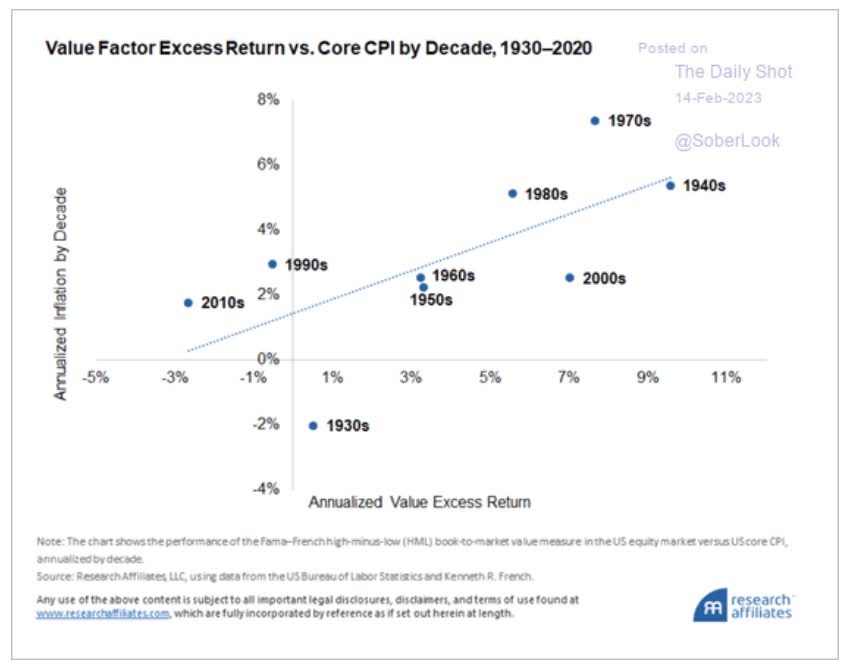
During periods of elevated inflation, value tends to outperform growth the most.
And in 2022, dividend growth was truly impressive.
- 2022 inflation: 8%
- S&P dividend growth: 11%
- blue-chip dividend growth (represented by VIG) 14%
- high-yield blue-chip dividend growth (represented by SCHD) 18%
- ZEUS Income Growth (my family hedge fund) 21%
- Nick Ward's dividend portfolio 24%.
In 2022 almost no one was celebrating...except for dividend investors.
In the worst inflation in 42 years, dividends didn't just beat inflation; they absolutely killed it.
- Killed it, set it on fire, and shot the ashes into the sun on a rocket;)
With 2023 likely to be a milder but potentially still disappointing year for investors, the prospects of enjoying ultra-high yield such as 7% or even 8%, is very appealing.
So per a Dividend Kings' member request, let me show you how to build a 7% yielding retirement dream portfolio with X world-class blue-chips.
If you've ever wondered about the maximum yield you can safely achieve in a diversified blue-chip portfolio, you're about to find out.
Step 1: The Safest Ultra-Yield Blue-Chips
For the sake of time, this week, I'll show you the top safe yielding blue-chips and how to incorporate them into a complete retirement portfolio.
I linked to articles providing the full investment thesis for each of these stocks.
| Stock |
| Ticker |
| Yield |
| Growth |
| Total Return |
| Weighting |
| Weighted Yield |
| Weighted Growth |
| Weighted Return |
| MPLX (Uses a K1 tax form) |
| ( MPLX ) |
| 8.9% |
| 3.0% |
| 11.9% |
| 10.00% |
| 0.9% |
| 0.3% |
| 1.2% |
| Altria |
| ( MO ) |
| 7.9% |
| 5.5% |
| 13.4% |
| 10.00% |
| 0.8% |
| 0.6% |
| 1.3% |
| Magellan Midstream Partners (K1 tax form) |
| ( MMP ) |
| 7.9% |
| 5.5% |
| 13.4% |
| 10.00% |
| 0.8% |
| 0.6% |
| 1.3% |
| Enterprise Products Partners (K1 tax form) |
| ( EPD ) |
| 7.6% |
| 4.4% |
| 12.0% |
| 10.00% |
| 0.8% |
| 0.4% |
| 1.2% |
| British American Tobacco |
| ( BTI ) |
| 7.3% |
| 9.1% |
| 16.4% |
| 10.00% |
| 0.7% |
| 0.9% |
| 1.6% |
| Legal & General |
| ( LGGNY ) |
| 7.3% |
| 4.7% |
| 12.0% |
| 10.00% |
| 0.7% |
| 0.5% |
| 1.2% |
| Enbridge |
| ( ENB ) |
| 7.0% |
| 3.3% |
| 10.3% |
| 10.00% |
| 0.7% |
| 0.3% |
| 1.0% |
| Verizon |
| ( VZ ) |
| 6.7% |
| 3.2% |
| 9.9% |
| 10.00% |
| 0.7% |
| 0.3% |
| 1.0% |
| Keyera |
| ( KEYUF ) |
| 6.4% |
| 5.0% |
| 11.4% |
| 10.00% |
| 0.6% |
| 0.5% |
| 1.1% |
| ONEOK |
| ( OKE ) |
| 5.8% |
| 10.7% |
| 16.5% |
| 10.00% |
| 0.6% |
| 1.1% |
| 1.7% |
| Total |
| 7.3% |
| 5.4% |
| 12.7% |
| 100.00% |
| 7.3% |
| 5.4% |
| 12.7% |
THIS IS NOT A DIVERSIFIED PORTFOLIO! This is PART of a diversified portfolio.
Tax Implications
- ENB and KEYUF are Canadian companies
- 15% dividend withholding for U.S. investors IN TAXABLE ACCOUNTS
- not in retirement accounts
- a tax credit is available to recoup the withholding in taxable accounts
- own in retirement accounts to avoid the paperwork
- BTI and LGGNY are UK companies
- 0% tax withholding
- though ADR fees will apply.
Note that we are energy and tobacco-heavy, but have exposure to four sectors.
I'll show you how to easily diversify the portfolio in a moment.
But first, let's analyze the core fundamentals of these 10 ultra-yielding blue-chips.
- 7.3% very safe yield
- 5.4% growth consensus
- 12.7% long-term return potential.
For context, Warren Buffett's unlevered long-term returns were 12.8% for the last 56 years.
We find that stocks with the characteristics favored by Buffett have done well in general, that Buffett applies about 1.6-to-1 leverage financed partly using insurance float with a low financing rate, and that leveraging safe stocks can largely explain Buffett’s performance." - AQR
Buffett's use of 1.6 leverage via insurance company float is how he turned 12.8% long-term returns from stock picking (mostly dividend paying blue-chips) into 20.5% annual returns that made him the greatest investor of all time.
Guess what else delivered 12.8% returns for the last 50 years? Dividend growth blue-chips.
In other words, Buffett's "billion-dollar secret" which made him about $120 billion, was nothing more than 3 things:
- buying quality dividend stocks at a discount
- holding for the long-term (and selling if the thesis broke)
- and using safe 1.6 leverage courtesy of his insurance companies.
That last step isn't something regular people can do, but the first two certainly are.
OK, so these 7.3% yielding blue-chips appear to offer Buffett-like (unlevered) return potential.
Do we have any evidence that they can accomplish this? After all, almost 13% long-term returns is more than analysts think the Nasdaq can deliver in the future.
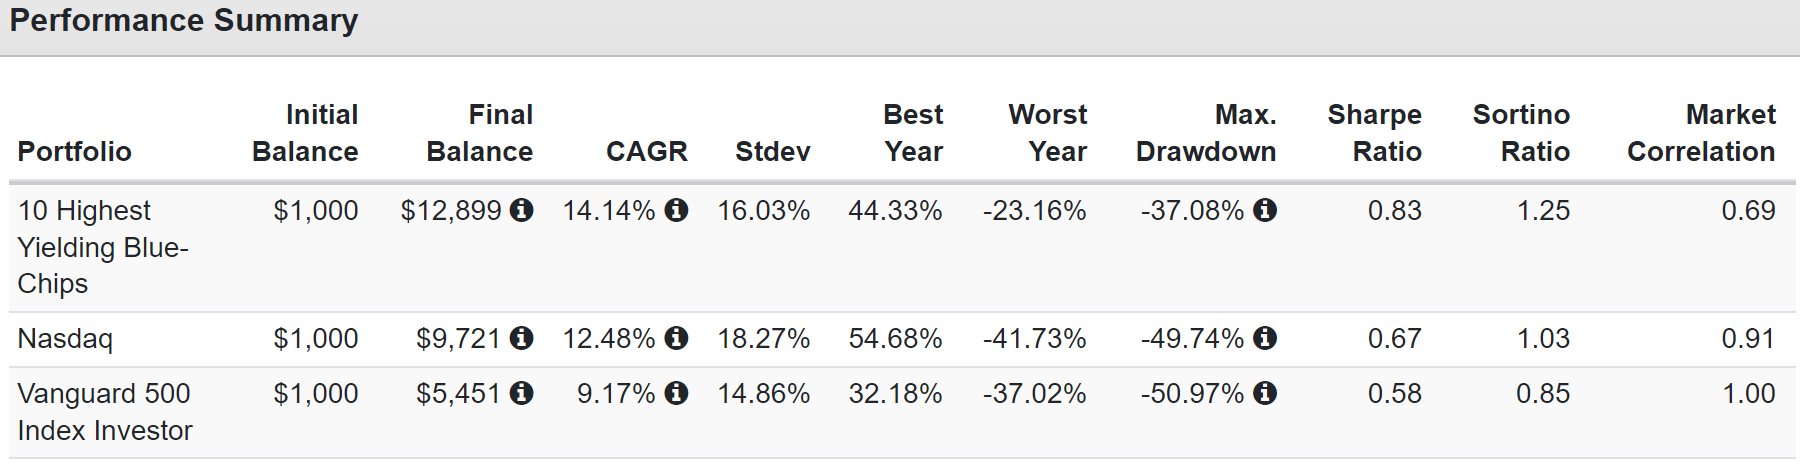
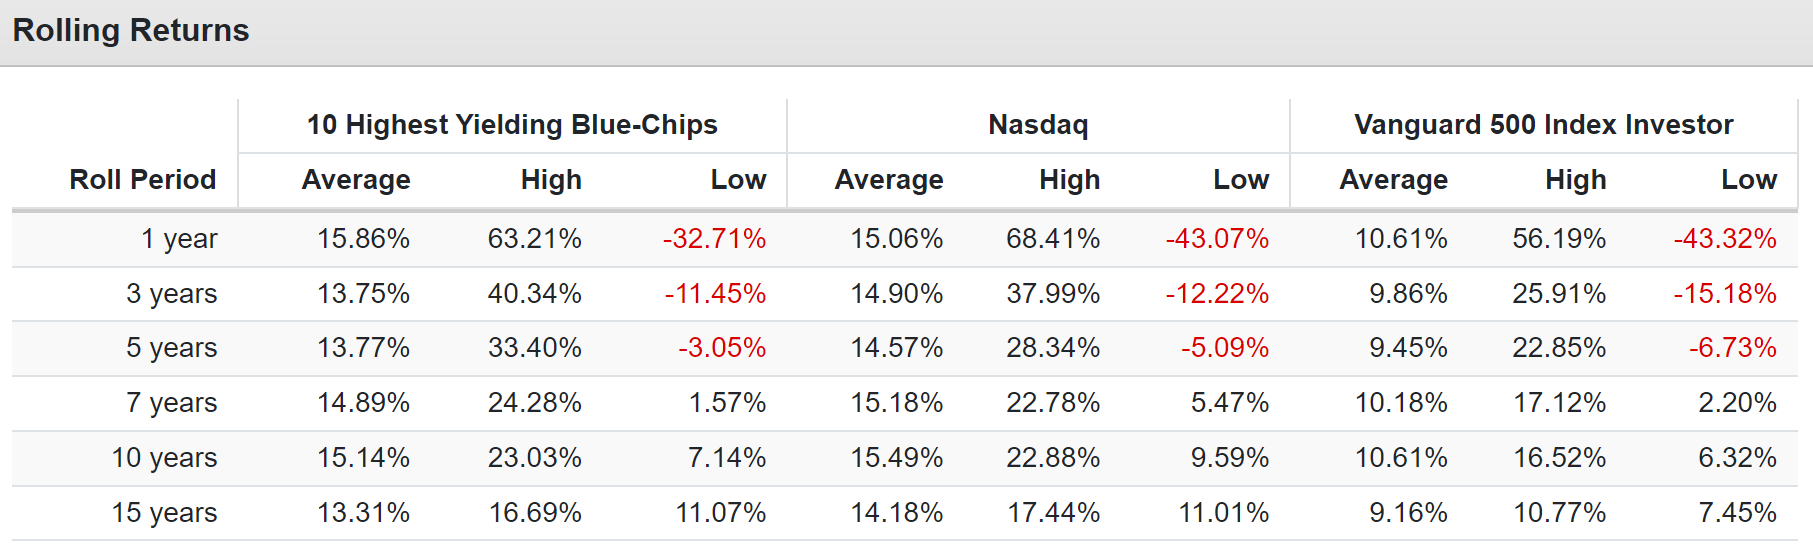
Historical Returns Since 2003
These high-yield blue-chips have beaten the S&P (SP500) and the Nasdaq (COMP.IND) over the last two years.
And they did so with lower volatility, and more consistent returns to boot.
And let's not forget about the main goal of high-yield investing, safe and dependable income growth.
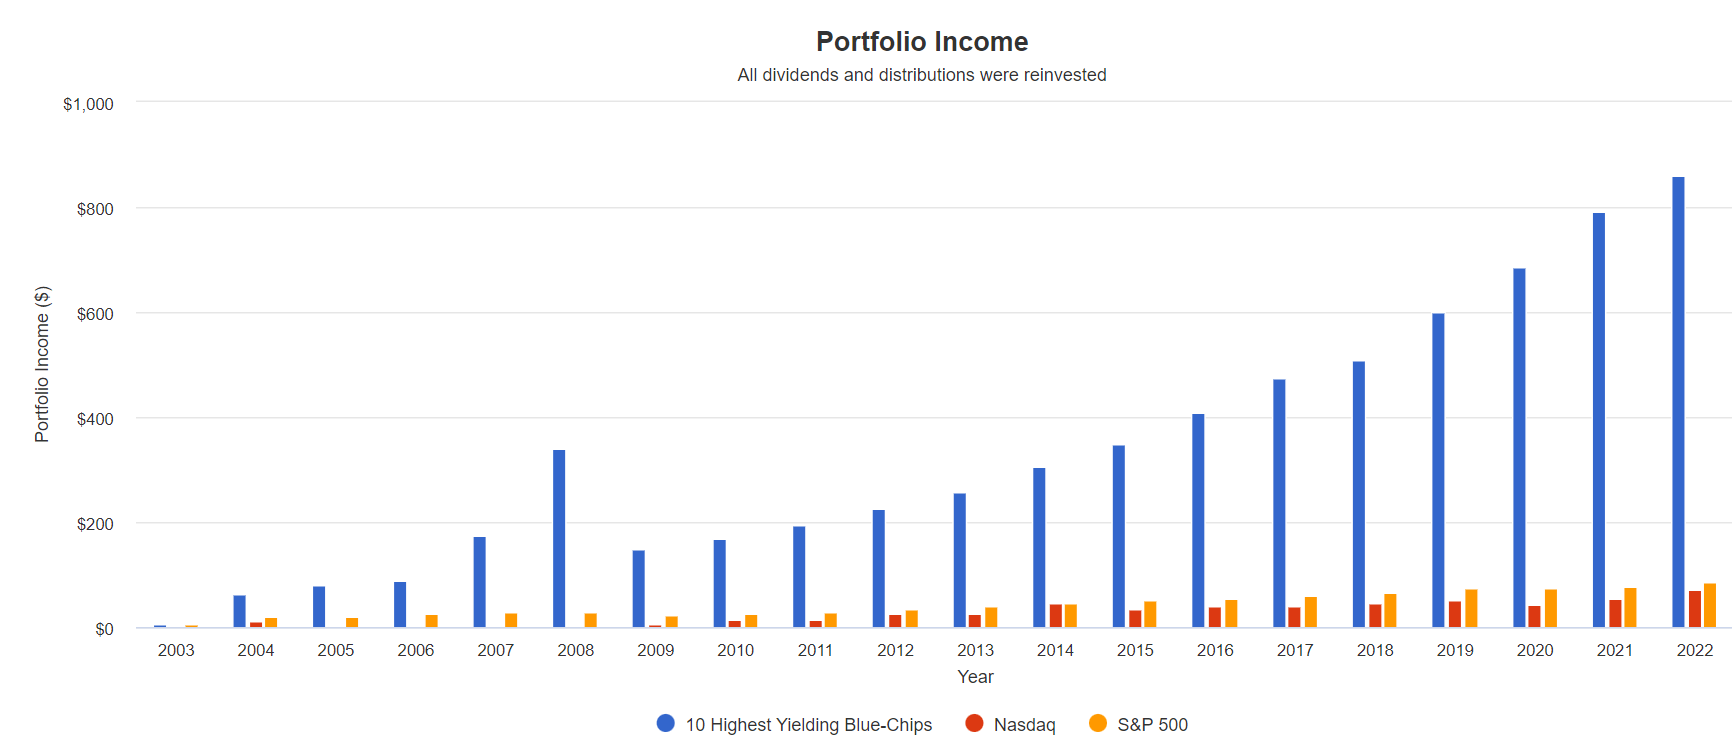
2007 and 2008 were when MO spun-off 3 companies. Here is the dividend growth since 2004.
- S&P 500: 8.2% annually (8.6% yield on cost)
- Nasdaq: 10.8% annually (7.0% yield on cost)
- 10 high-yield blue-chips: 15.5% annually (86% yield on cost).
Long-term income growth closely tracks total returns, which is why maximum safe income over time requires both yield and growth.
The higher the yield the more of an income growth boost there is from dividend reinvestment.
OK, so these 10 high-yield blue-chips look very promising, but what if you're not comfortable investing your life savings into just 10 stocks? Especially pipelines and tobacco stocks?
Step 2: Adding Blue-Chip Dividend ETFs For Diversification
Turning pure blue-chips into a ZEN high-yield portfolio.
| Stock |
| Ticker |
| Yield |
| Growth |
| Total Return |
| Weighting |
| Weighted Yield |
| Weighted Growth |
| Weighted Return |
| MPLX (Uses a K1 tax form) |
| MPLX |
| 8.9% |
| 3.0% |
| 11.9% |
| 5.00% |
| 0.4% |
| 0.2% |
| 0.6% |
| Altria |
| MO |
| 7.9% |
| 5.5% |
| 13.4% |
| 5.00% |
| 0.4% |
| 0.3% |
| 0.7% |
| Magellan Midstream Partners (K1 tax form) |
| MMP |
| 7.9% |
| 5.5% |
| 13.4% |
| 5.00% |
| 0.4% |
| 0.3% |
| 0.7% |
| Enterprise Products Partners (K1 tax form) |
| EPD |
| 7.6% |
| 4.4% |
| 12.0% |
| 5.00% |
| 0.4% |
| 0.2% |
| 0.6% |
| British American Tobacco |
| BTI |
| 7.3% |
| 9.1% |
| 16.4% |
| 5.00% |
| 0.4% |
| 0.5% |
| 0.8% |
| Legal & General |
| LGGNY |
| 7.3% |
| 4.7% |
| 12.0% |
| 5.00% |
| 0.4% |
| 0.2% |
| 0.6% |
| Enbridge |
| ENB |
| 7.0% |
| 3.3% |
| 10.3% |
| 5.00% |
| 0.4% |
| 0.2% |
| 0.5% |
| Verizon |
| VZ |
| 6.7% |
| 3.2% |
| 9.9% |
| 5.00% |
| 0.3% |
| 0.2% |
| 0.5% |
| Keyera |
| KEYUF |
| 6.4% |
| 5.0% |
| 11.4% |
| 5.00% |
| 0.3% |
| 0.3% |
| 0.6% |
| ONEOK |
| OKE |
| 5.8% |
| 10.7% |
| 16.5% |
| 5.00% |
| 0.3% |
| 0.5% |
| 0.8% |
| Schwab US Dividend Equity ETF |
| ( SCHD ) |
| 3.40% |
| 9.4% |
| 12.8% |
| 50.00% |
| 1.7% |
| 4.7% |
| 6.4% |
| Total |
| 6.9% |
| 5.8% |
| 12.7% |
| 100.00% |
| 5.3% |
| 7.4% |
| 12.7% |
By using 50% ETFs and 50% individual blue-chips, we diversify with ease and convenience and maintain the same 12.7% long-term return potential of the pure ten stocks.
We also diversify down from 60% midstream down to 30%. The Charlie Munger/Schwab/Fidelity risk management rules of thumb for concentrated portfolios say not to put more than 33% of your savings into a single sector.
60% midstream is too concentrated, but now, by using 50% SCHD and 50% individual blue chips, we've diversified, preserved the long-term income growth potential of the portfolio, AND achieved superior fundamentals to what any ETF can offer.
Are there ETFs that yield more than 5.3%? Sure, but none of them offers the kind of income dependability that this portfolio does.
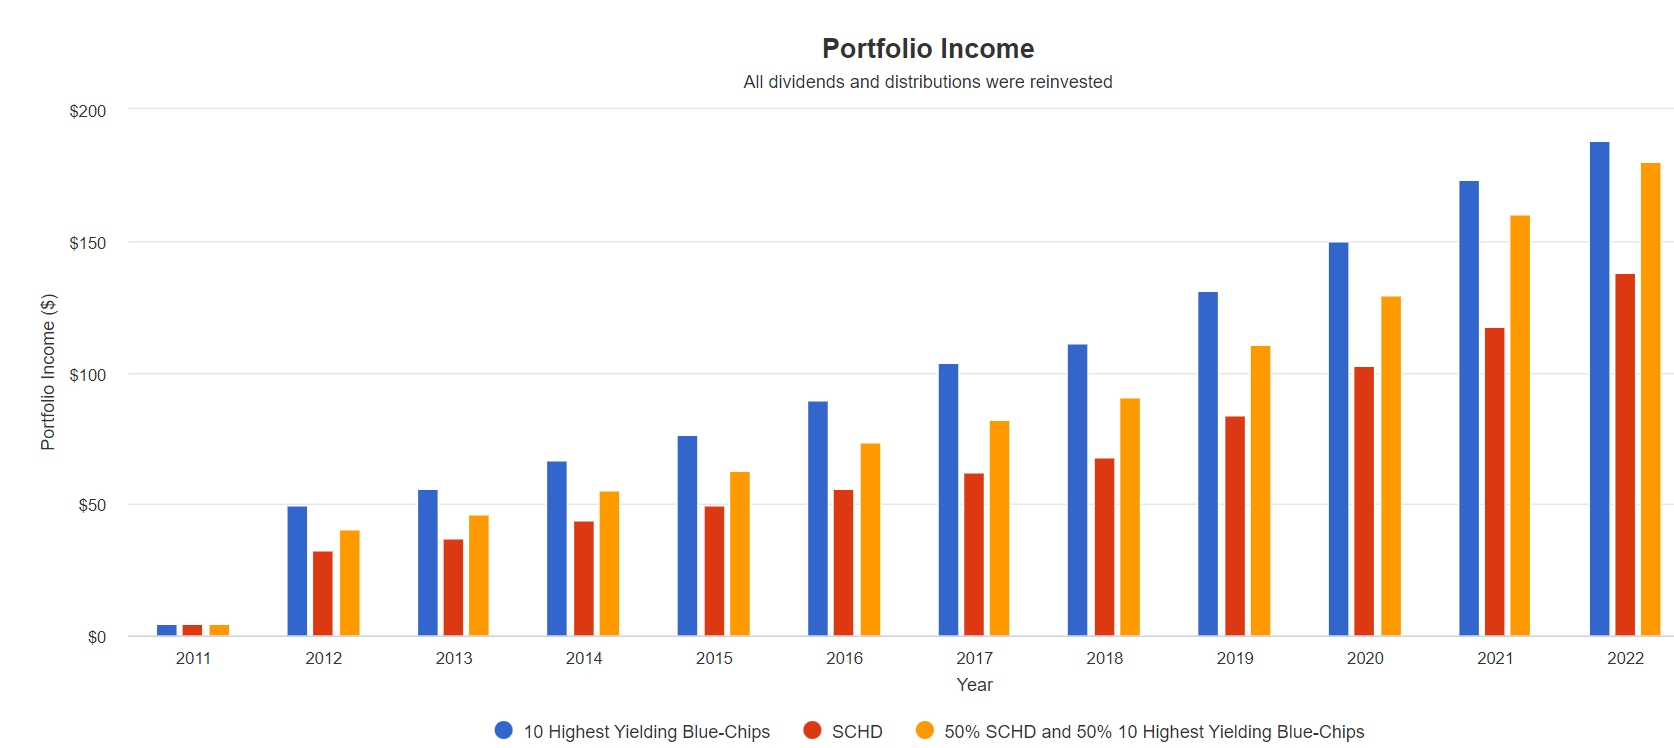
Note how combining SCHD with pure blue-chip ultra-yield ended up with a nearly identical yield on cost despite a lower starting yield. That's because SCHD provides the growth that the blue-chips themselves are lacking.
- SCHD: 15.4% annual income growth (14% yield on cost)
- 10 high-yield blue-chips: 14.4% annual income growth (19% yield on cost)
- SCHD + 10 high-yield blue-chips: 15.9% annual income growth (18% yield on cost).
And guess what else combining the world's best ETFs with the world's best ultra-yielders can do?
Historical Total Returns Since 2011
The reason these blue chips yield 7.3% is that they are currently unpopular. Many of them have been in multi-year bear markets. During one of the hottest tech rallies in U.S. history, they didn't keep up with the market.
But SCHD did, and by combining these two stock buckets you achieved almost identical return to the S&P.
- superior income, superior income growth, and you avoided market envy that can cause you to abandon a superior long-term strategy.
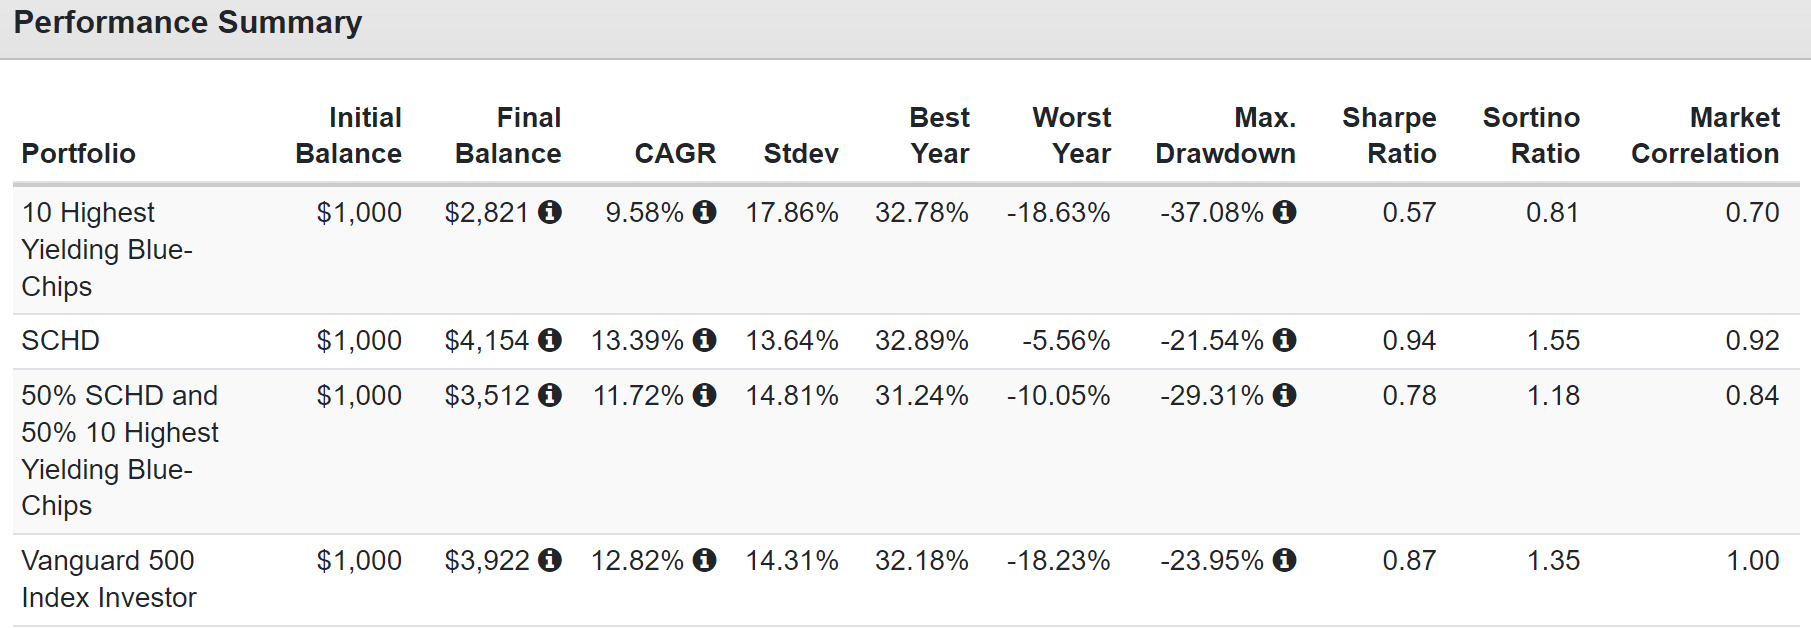
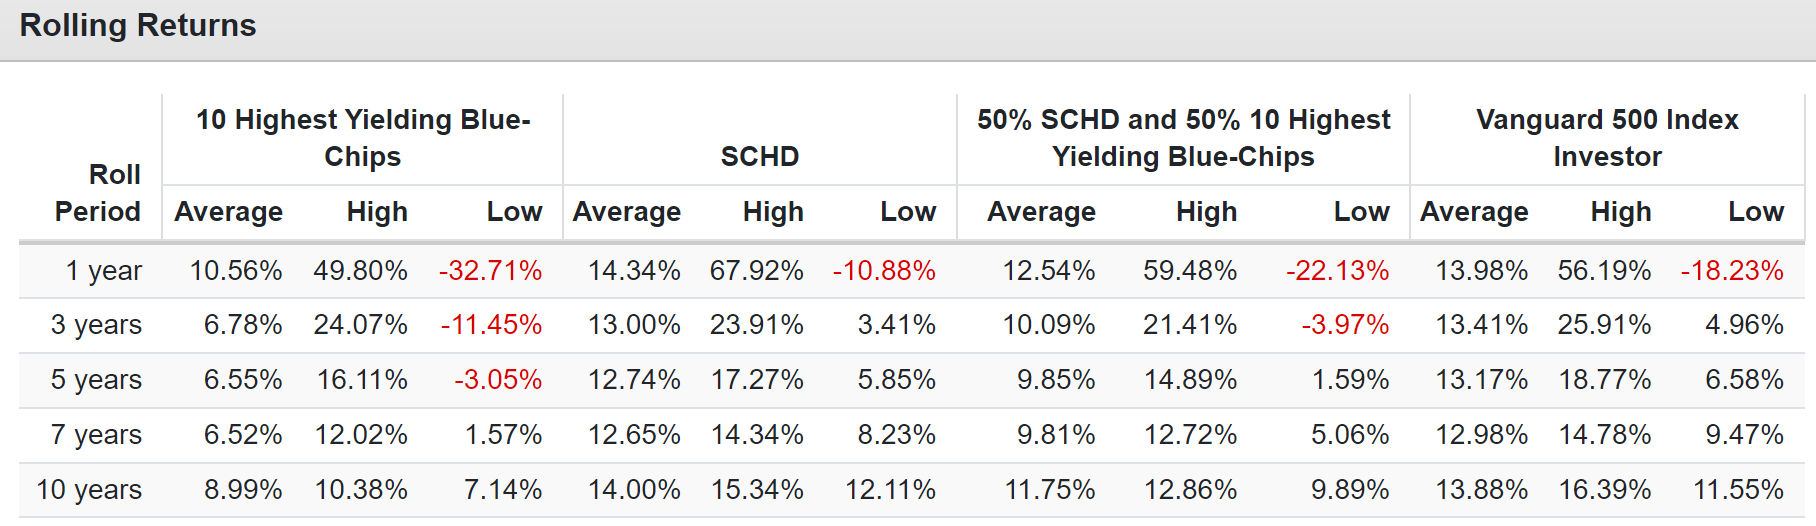
The historical return for dividend growth blue-chips? 12.8%.
The consensus future return of this ZEN high-yield portfolio? 12.7%.
The average 12-month rolling return for the last decade? When value was deeply out of favor? 12.5%
The S&P simply can't keep up with the returns this ZEN high-yield portfolio is likely to deliver in the future.
How do I know?
10,000 Monte Carlo Simulations To Statistically Simulate The Future
Monte Carlo simulations use statistical analysis of the past to estimate the range of possible and likely outcomes for the future.
I use 10,000 simulations for the next 75 years to simulate the most extreme possible outcomes, both good and bad.
- Market crashes are more likely over the next 75 years than the next ten years; for example.
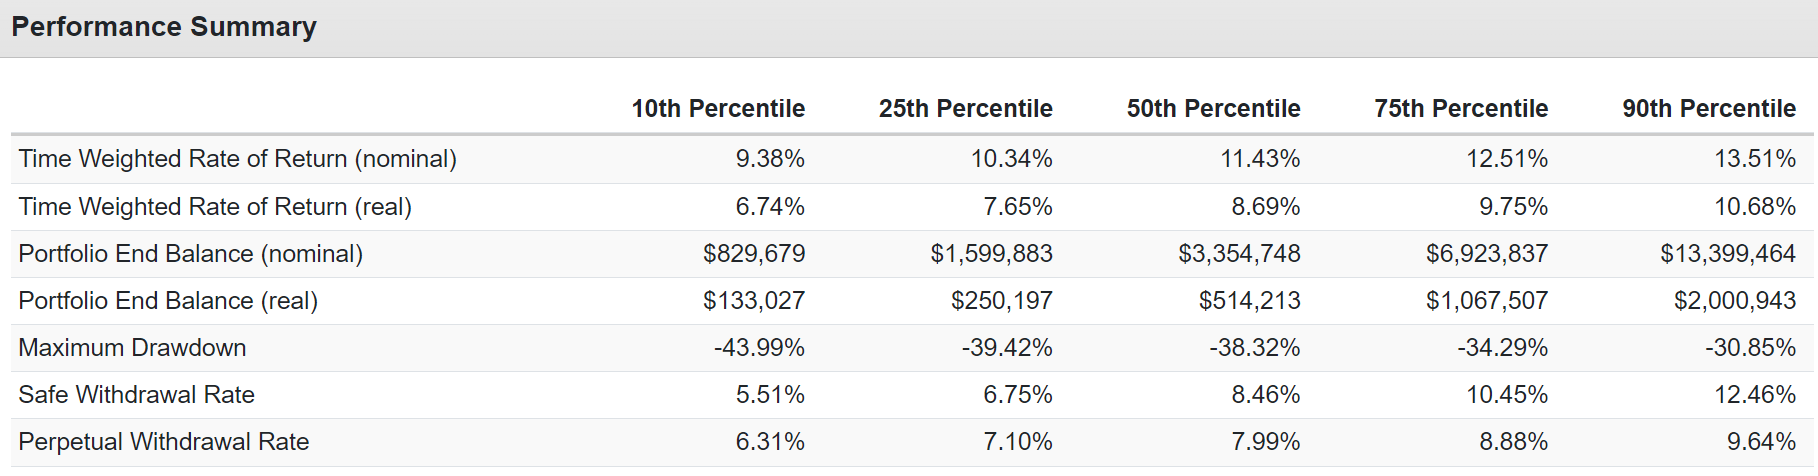
There is a 90% statistical probability that this ZEN high-yield portfolio will deliver 9.4% or better returns over the long-term.
Adjusted for inflation, that's 6.7+% which means turning $1,000 invested today into $133,000 or more over the long term.
And note the safe perpetual withdrawal rate of 5.5%. Do you think a 60/40 can do 5.5% annual withdrawals? Analysts currently expect 2.7% is a safe withdrawal rate for that portfolio.
The S&P's historical and future consensus returns are 10%. The probability that this ZEN high-yield portfolio will beat the market over the next 50 years is, statistically, 77%.
Ok, this is all wonderful, but didn't I promise a 7%-yielding retirement dream portfolio? Yes, and step 3 is how we get that.
Step 3: A Hedging Bucket That Boosts Yield While Reducing Volatility
Turning a ZEN portfolio into a ZEUS portfolio is the final step to maximizing safe yield and creating a dream retirement portfolio.
- ZEUS = Zen extraordinary Ultra Sleep-well-at-night portfolio.
ZEUS takes the ZEN two-bucket strategy (ETF + individual stocks) and adds a hedging bucket.
There are two kinds of hedges I recommend. Bonds and managed futures.
That's because since 1980 there has never been a bear market in which this combination hasn't gone up or at least stayed flat in a falling market.
And over the long term it generates far superior returns to cash (the traditional hedge).
ZEUS Maximum Yield
| Stock |
| Ticker |
| Yield |
| Growth |
| Total Return |
| Weighting |
| Weighted Yield |
| Weighted Growth |
| Weighted Return |
| MPLX (Uses a K1 tax form) |
| MPLX |
| 8.9% |
| 3.0% |
| 11.9% |
| 3.33% |
| 0.3% |
| 0.1% |
| 0.4% |
| Altria |
| MO |
| 7.9% |
| 5.5% |
| 13.4% |
| 3.33% |
| 0.3% |
| 0.2% |
| 0.4% |
| Magellan Midstream Partners (K1 tax form) |
| MMP |
| 7.9% |
| 5.5% |
| 13.4% |
| 3.33% |
| 0.3% |
| 0.2% |
| 0.4% |
| Enterprise Products Partners (K1 tax form) |
| EPD |
| 7.6% |
| 4.4% |
| 12.0% |
| 3.33% |
| 0.3% |
| 0.1% |
| 0.4% |
| British American Tobacco |
| BTI |
| 7.3% |
| 9.1% |
| 16.4% |
| 3.33% |
| 0.2% |
| 0.3% |
| 0.5% |
| Legal & General |
| LGGNY |
| 7.3% |
| 4.7% |
| 12.0% |
| 3.33% |
| 0.2% |
| 0.2% |
| 0.4% |
| Enbridge |
| ENB |
| 7.0% |
| 3.3% |
| 10.3% |
| 3.33% |
| 0.2% |
| 0.1% |
| 0.3% |
| Verizon |
| VZ |
| 6.7% |
| 3.2% |
| 9.9% |
| 3.33% |
| 0.2% |
| 0.1% |
| 0.3% |
| Keyera |
| KEYUF |
| 6.4% |
| 5.0% |
| 11.4% |
| 3.33% |
| 0.2% |
| 0.2% |
| 0.4% |
| ONEOK |
| OKE |
| 5.8% |
| 10.7% |
| 16.5% |
| 3.33% |
| 0.2% |
| 0.4% |
| 0.6% |
| Schwab US Dividend Equity ETF |
| SCHD |
| 3.40% |
| 9.4% |
| 12.8% |
| 33.33% |
| 1.1% |
| 3.1% |
| 4.3% |
| KFA Mount Lucas Strategy ETF |
| ( KMLM ) |
| 9.30% |
| 0% |
| 9.3% |
| 33.33% |
| 3.1% |
| 0.0% |
| 3.1% |
| Total |
| 7.1% |
| 5.3% |
| 12.7% |
| 100.00% |
| 6.7% |
| 4.9% |
| 11.6% |
KMLM is a relatively new managed futures ETF that tracks the Mount Lucas Managed Futures index or MLM.
While the ETF has only been around since Jan 2021, the index has been around since 1988.
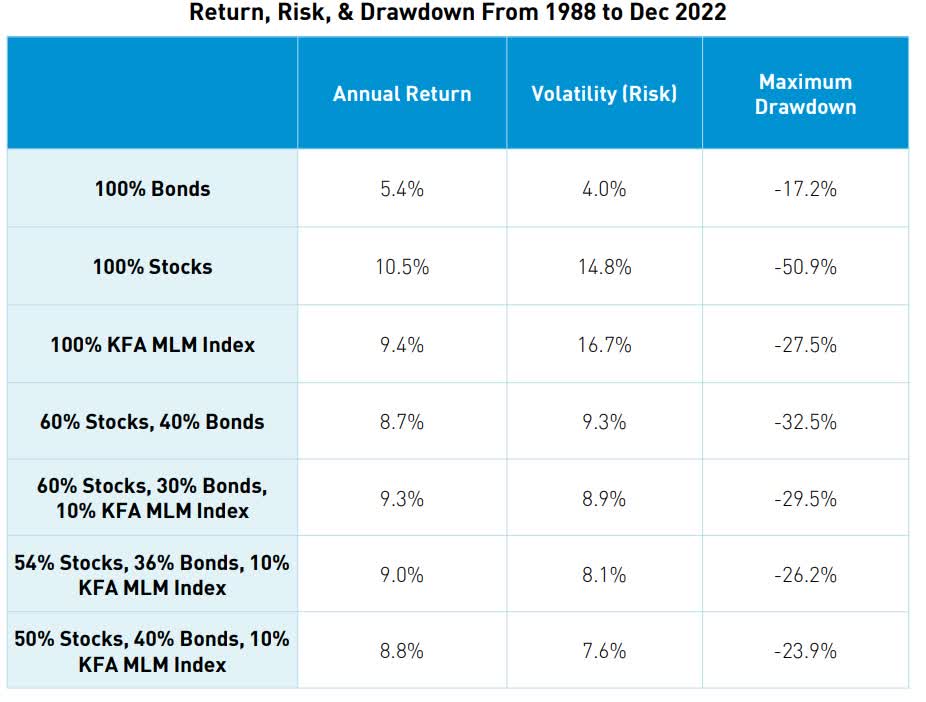
The MLM index is the best-performing managed futures index on Wall Street, historically delivering 9.4% annual returns over the last 24 years.
That's compared to 4.5% returns for the industry and 4% for bonds.
- MLM index has delivered more than 2X the industry's returns for almost a quarter century
- Buffett beat the S&P by 2X for 56 years
- MLM index is the Buffett of managed futures indexes.
Why is KMLM a potentially great addition to a retirement portfolio?
- The historical correlation to the stock market is -0.33
- low correlation to the bond market
- pays out all returns as annual distributions.
In other words, no single ETF is a better hedge against a stock and bond market crash (like we had in 2022) than KMLM.
KMLM Vs. Bonds Vs. 60/40 Vs. S&P Over Time
| Year |
| MLM (KMLM Index) Return |
| 10-Year Treasury Bonds |
| 60/40 |
| S&P |
| 2022 |
| 36.7% |
| -17.8% |
| -18.0% |
| -18.1% |
| 2021 |
| 9.0% |
| -4.4% |
| 15.5% |
| 28.7% |
| 2020 |
| 6.1% |
| 11.3% |
| 15.6% |
| 18.4% |
| 2019 |
| -5.7% |
| 9.6% |
| 22.7% |
| 31.5% |
| 2018 |
| -0.4% |
| 0.0% |
| -2.6% |
| -4.4% |
| 2017 |
| -11.1% |
| 2.8% |
| 14.2% |
| 21.8% |
| 2016 |
| -6.8% |
| 0.7% |
| 7.5% |
| 12.0% |
| 2015 |
| 13.5% |
| 1.3% |
| 1.3% |
| 1.4% |
| 2014 |
| 22.5% |
| 10.7% |
| 12.5% |
| 13.7% |
| 2013 |
| -0.1% |
| -9.1% |
| 15.8% |
| 32.4% |
| 2012 |
| -11.9% |
| 3.0% |
| 10.8% |
| 16.0% |
| 2011 |
| 6.2% |
| 16.0% |
| 7.7% |
| 2.1% |
| 2010 |
| 5.0% |
| 8.5% |
| 12.4% |
| 15.1% |
| 2009 |
| -10.5% |
| -11.1% |
| 11.4% |
| 26.5% |
| 2008 |
| 40.4% |
| 20.1% |
| -14.2% |
| -37.0% |
| 2007 |
| 10.8% |
| 10.2% |
| 7.4% |
| 5.5% |
| 2006 |
| 0.1% |
| 2.0% |
| 10.3% |
| 15.8% |
| 2005 |
| 12.6% |
| 2.9% |
| 4.1% |
| 4.9% |
| 2004 |
| 5.5% |
| 4.5% |
| 8.3% |
| 10.9% |
| 2003 |
| 8.2% |
| 0.4% |
| 17.4% |
| 28.7% |
| 2002 |
| -9.2% |
| 15.1% |
| -7.2% |
| -22.1% |
| 2001 |
| 2.6% |
| 5.6% |
| -4.9% |
| -11.9% |
| 2000 |
| 38.4% |
| 16.7% |
| 1.2% |
| -9.1% |
| 1999 |
| -9.6% |
| -8.3% |
| 9.3% |
| 21.0% |
| 1998 |
| 42.8% |
| 14.9% |
| 23.1% |
| 28.6% |
| 1997 |
| 11.6% |
| 9.9% |
| 24.0% |
| 33.4% |
| 1996 |
| 22.5% |
| 1.4% |
| 14.3% |
| 23.0% |
| 1995 |
| 22.5% |
| 23.5% |
| 31.9% |
| 37.6% |
| 1994 |
| 26.9% |
| -8.0% |
| -2.4% |
| 1.3% |
| 1993 |
| 23.0% |
| 14.2% |
| 11.7% |
| 10.1% |
| 1992 |
| -9.0% |
| 9.4% |
| 8.3% |
| 7.6% |
| 1991 |
| -8.7% |
| 15.0% |
| 24.3% |
| 30.5% |
| 1990 |
| 33.3% |
| 6.2% |
| 0.6% |
| -3.1% |
| 1989 |
| 40.4% |
| 17.7% |
| 26.1% |
| 31.7% |
| 1988 |
| 15.4% |
| 8.2% |
| 13.3% |
| 16.6% |
| Average |
| 10.7% |
| 5.8% |
| 9.5% |
| 12.0% |
| Median |
| 8.2% |
| 6.2% |
| 10.8% |
| 15.1% |
| Annual Volatility |
| 16.9% |
| 9.5% |
| 11.1% |
| 17.6% |
| Correlation |
| NA |
| 0.26 |
| -0.14 |
| -0.24 |
(Source: Krane Shares, Portfolio Visualizer, Charlie Bilello.)
Here are KMLM's best and worst years.
KMLM's Annual Returns Sorted Best To Worst
| Year |
| MLM (KMLM Index) Return |
| 10-Year Treasury Bonds |
| 60/40 |
| S&P |
| 1998 |
| 42.8% |
| 14.9% |
| 23.1% |
| 28.6% |
| 1989 |
| 40.4% |
| 17.7% |
| 26.1% |
| 31.7% |
| 2008 |
| 40.4% |
| 20.1% |
| -14.2% |
| -37.0% |
| 2000 |
| 38.4% |
| 16.7% |
| 1.2% |
| -9.1% |
| 2022 |
| 36.7% |
| -17.8% |
| -18.0% |
| -18.1% |
| 1990 |
| 33.3% |
| 6.2% |
| 0.6% |
| -3.1% |
| 1994 |
| 26.9% |
| -8.0% |
| -2.4% |
| 1.3% |
| 1993 |
| 23.0% |
| 14.2% |
| 11.7% |
| 10.1% |
| 2014 |
| 22.5% |
| 10.7% |
| 12.5% |
| 13.7% |
| 1996 |
| 22.5% |
| 1.4% |
| 14.3% |
| 23.0% |
| 1995 |
| 22.5% |
| 23.5% |
| 31.9% |
| 37.6% |
| 1988 |
| 15.4% |
| 8.2% |
| 13.3% |
| 16.6% |
| 2015 |
| 13.5% |
| 1.3% |
| 1.3% |
| 1.4% |
| 2005 |
| 12.6% |
| 2.9% |
| 4.1% |
| 4.9% |
| 1997 |
| 11.6% |
| 9.9% |
| 24.0% |
| 33.4% |
| 2007 |
| 10.8% |
| 10.2% |
| 7.4% |
| 5.5% |
| 2021 |
| 9.0% |
| -4.4% |
| 15.5% |
| 28.7% |
| 2003 |
| 8.2% |
| 0.4% |
| 17.4% |
| 28.7% |
| 2011 |
| 6.2% |
| 16.0% |
| 7.7% |
| 2.1% |
| 2020 |
| 6.1% |
| 11.3% |
| 15.6% |
| 18.4% |
| 2004 |
| 5.5% |
| 4.5% |
| 8.3% |
| 10.9% |
| 2010 |
| 5.0% |
| 8.5% |
| 12.4% |
| 15.1% |
| 2001 |
| 2.6% |
| 5.6% |
| -4.9% |
| -11.9% |
| 2006 |
| 0.1% |
| 2.0% |
| 10.3% |
| 15.8% |
| 2013 |
| -0.1% |
| -9.1% |
| 15.8% |
| 32.4% |
| 2018 |
| -0.4% |
| 0.0% |
| -2.6% |
| -4.4% |
| 2019 |
| -5.7% |
| 9.6% |
| 22.7% |
| 31.5% |
| 2016 |
| -6.8% |
| 0.7% |
| 7.5% |
| 12.0% |
| 1991 |
| -8.7% |
| 15.0% |
| 24.3% |
| 30.5% |
| 1992 |
| -9.0% |
| 9.4% |
| 8.3% |
| 7.6% |
| 2002 |
| -9.2% |
| 15.1% |
| -7.2% |
| -22.1% |
| 1999 |
| -9.6% |
| -8.3% |
| 9.3% |
| 21.0% |
| 2009 |
| -10.5% |
| -11.1% |
| 11.4% |
| 26.5% |
| 2017 |
| -11.1% |
| 2.8% |
| 14.2% |
| 21.8% |
| 2012 |
| -11.9% |
| 3.0% |
| 10.8% |
| 16.0% |
(Source: Krane Shares, Portfolio Visualizer, Charlie Bilello.)
The power of managed futures, especially the MLM index (the Warren Buffett of managed futures indexes), is that the best returns tend to be when the stock market is melting down.
Crisis alpha is what this is called, and you can see it in 2008's 40% returns for the MLM index while the market fell 37%.
Or how about 2022 when MLM was up 36% and the market was down 18%?
In your hedging bucket, you don't just want something that falls less (like low volatility stocks) or doesn't fall at all (like cash) you want something that goes up, and usually up a lot.
- long bonds during the GFC soared 75% at one point.
When KMLM was suffering, stocks were generally doing well.
The worst bear market for MLM was from 2016 to 2019, when it fell 23%. But the stock market was up 72% during this time, and a 67/33 stock/managed future portfolio delivered 43% returns or 9% annually.
- the worst time for a 67/33 version of ZEUS using KMLM would have still delivered solid returns.
The only year that KMLM and the market both fell in the same year was 2002.
A year when bonds were up 15% and long bonds 51%.
- thus why managed futures + long bonds are the perfect hedging strategy
- zero bear market failures in 42 years.
But if you're looking for maximum safe yield, then KMLM's long-term yield of 9.4% (all returns are in the form of yield, the same as bonds) is what you want.
That's how we were able to push the yield up to 6.7% for a pure blue chip quality portfolio.
One with 11.6% long-term return potential.
Long-Term Consensus Return Potential
| Investment Strategy |
| Yield |
| LT Consensus Growth |
| LT Consensus Total Return Potential |
| ZEUS Income Growth (My family hedge fund) |
| 4.1% |
| 10.4% |
| 14.5% |
| Schwab US Dividend Equity ETF |
| 3.6% |
| 9.4% |
| 13.0% |
| Vanguard Dividend Appreciation ETF |
| 2.2% |
| 10.0% |
| 12.2% |
| Nasdaq |
| 0.8% |
| 10.9% |
| 11.7% |
| ZEUS Max Yield |
| 6.7% |
| 4.9% |
| 11.6% |
| Dividend Aristocrats |
| 1.9% |
| 8.5% |
| 10.4% |
| S&P 500 |
| 1.7% |
| 8.5% |
| 10.2% |
| REITs |
| 3.9% |
| 6.1% |
| 10.0% |
| 60/40 Retirement Portfolio |
| 2.1% |
| 5.1% |
| 7.2% |
(Sources: DK Research Terminal, FactSet, Morningstar.)
This is how ZEUS Max Yield compares to other investing strategies. Note how it offers more than 3X the yield of a 60/40 and 4.4% higher long-term return potential.
In fact, ZEUS Max Yield is a better potential strategy than the S&P or even the dividend aristocrats. It even offers Nasdaq-like long-term return potential.
What do 4.4% higher returns potentially mean for a retired couple over a 30-year retirement?
Inflation-Adjusted Consensus Return Potential: Average Retired Couple's Savings ($510,000)
| Time Frame (Years) |
| 4.8% CAGR Inflation-Adjusted 60/40 |
| 9.4% Inflation-Adjusted ZEUS max Yield |
| Difference Between ZEUS Max Yield Consensus and 60/40 Consensus |
| 5 |
| $644,728.09 |
| $797,742.42 |
| $153,014.33 |
| 10 |
| $815,047.66 |
| $1,247,829.34 |
| $432,781.68 |
| 15 |
| $1,030,361.01 |
| $1,951,855.67 |
| $921,494.66 |
| 20 |
| $1,302,554.28 |
| $3,053,094.22 |
| $1,750,539.95 |
| 25 |
| $1,646,653.58 |
| $4,775,652.47 |
| $3,128,998.89 |
| 30 (retirement time frame) |
| $2,081,654.53 |
| $7,470,079.48 |
| $5,388,424.96 |
| 35 |
| $2,631,570.86 |
| $11,684,704.42 |
| $9,053,133.56 |
| 40 |
| $3,326,760.08 |
| $18,277,224.17 |
| $14,950,464.09 |
| 45 |
| $4,205,599.33 |
| $28,589,248.94 |
| $24,383,649.61 |
| 50 |
| $5,316,603.94 |
| $44,719,326.49 |
| $39,402,722.55 |
| 55 |
| $6,721,105.64 |
| $69,950,006.94 |
| $63,228,901.29 |
| 60 (investing lifetime) |
| $8,496,638.38 |
| $109,415,857.85 |
| $100,919,219.47 |
| 100 (charity trust time frame) |
| $55,424,073.36 |
| $3,921,212,081.66 |
| $3,865,788,008.30 |
(Sources: DK Research Terminal, FactSet.)
For the average retired couple, ZEUS Max yield offers potentially $5.4 million in extra inflation-adjusted wealth and income over 30 years.
- an extra $180,000 per year on average
- an extra $15,000 per month on average.
For younger investors, it offers potentially tens of millions of dollars in extra wealth.
| Time Frame (Years) |
| Ratio ZEUS Max Yield Portfolio Vs. 60/40 Consensus |
| 5 |
| 1.2 |
| 10 |
| 1.5 |
| 15 |
| 1.9 |
| 20 |
| 2.3 |
| 25 |
| 2.9 |
| 30 |
| 3.6 |
| 35 |
| 4.4 |
| 40 |
| 5.5 |
| 45 |
| 6.8 |
| 50 |
| 8.4 |
| 55 |
| 10.4 |
| 60 |
| 12.9 |
| 100 |
| 70.75 |
(Sources: DK Research Terminal, FactSet.)
That's more than 3X the yield of a 60/40 and almost 4X the return potential over a standard retirement time frame.
That is the power of ZEUS. And so is this.
The Ultimate Sleep-Well-At-Night Max Yield Retirement Portfolio
Total Returns Since January 2021
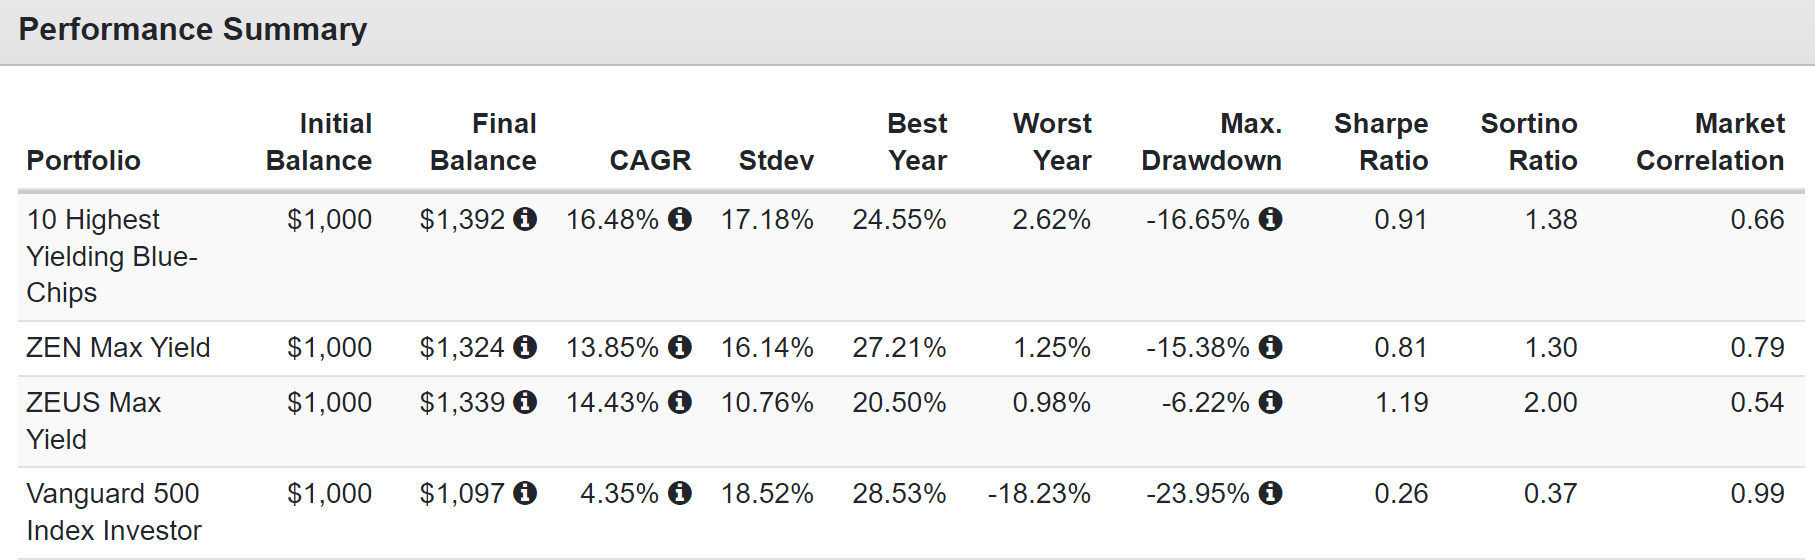
Granted, energy was red hot in 2022, and so were managed futures. So for the 2022 bear market, this was an ideal portfolio that fell a maximum of just 6%.
This is the power of ZEUS. Over the long-term, its superior negative-volatility-adjusted returns are why it beats the market, the 60/40, and potentially even the Nasdaq.
- low volatility is a proven alpha factor that beats the market over time
- by losing less in the downturns and having to recover less to breakeven in the good times.
Bottom Line: These 12 Blue Chips Create The Ultimate 7%-Yielding Dream Retirement Portfolio
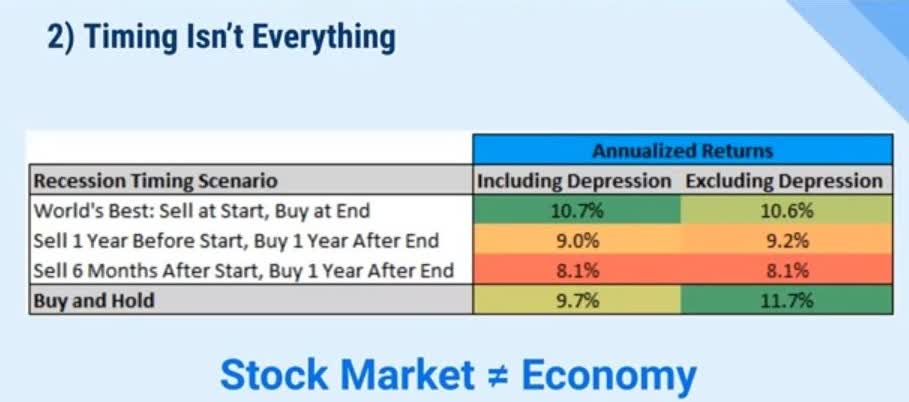
No one knows for sure what the market will do in 2023 or what the economy will do. But guess what? Timing the market and the economy isn't just impossible; it's completely unnecessary.
Even perfect economic timing wouldn't have beaten buy-and-hold blue-chip investing, other than during the Great Depression when the stock market fell 86%.
If you own wonderful companies with strong balance sheets, and skilled and adaptable management teams, all in a diversified portfolio with prudent risk management for your goals, you have nothing to worry about in 2023 or any future recession.
MPLX, MO, MMP EPD, BTI, LGGNY, ENB, VZ, KEYUF, and OKE are the highest yielding non-speculative blue-chips you can buy today.
- 7.3% very safe yield and 12.7% long-term return potential.
Add SCHD to this mix and you get a ZEN Max yield portfolio that has 5.6% yield and the same 12.7% long-term return potential and about 15% to 16% long-term income growth.
And add KMLM as a hedging basket and you get a 6.7% yielding ZEUS Max Yield portfolio with 11.6% return potential that fell a peak of 6% in 2022.
- vs 28% S&P, and 21% 60/40.
It also delivered 28% income growth in 2022, a year when dividend investors won big.
- 2022 inflation: 8%
- S&P dividend growth: 11% dividend growth
- VIG (dividend growth blue-chips) 14% dividend growth
- SCHD (high-yield blue-chips) 18% dividend growth
- ZEUS Income Growth (my family hedge fund) 21% dividend growth
- ZEUS Max Yield 28% dividend growth.
How many people got a 28% raise last year? Investors in this portfolio did.
All while enjoying one of the mildest downturns you can imagine during the only year in U.S. history when stocks and bonds both fell double-digits.
If you want to truly sleep-well-at-night while collecting maximum safe yield and riding over the most extreme market potholes in a limousine, then these 12 dividend blue-chip stocks and ETFs are how you can do it.
For further details see:
Build A 7%-Yielding Dream Retirement Portfolio With 12 Amazing Blue Chips