LMT - Buy Like Buffett: British American's 9.3% Yield Is The Highest In 23 Years
2023-08-18 07:40:00 ET
Summary
- Bear markets for world-beater blue chips like British American Tobacco p.l.c., PepsiCo, and Lockheed Martin Corporation can last as long as eight years.
- "Value trap," "yield trap," and "broken stock" are labels given to great companies purely because the stock prices are weak.
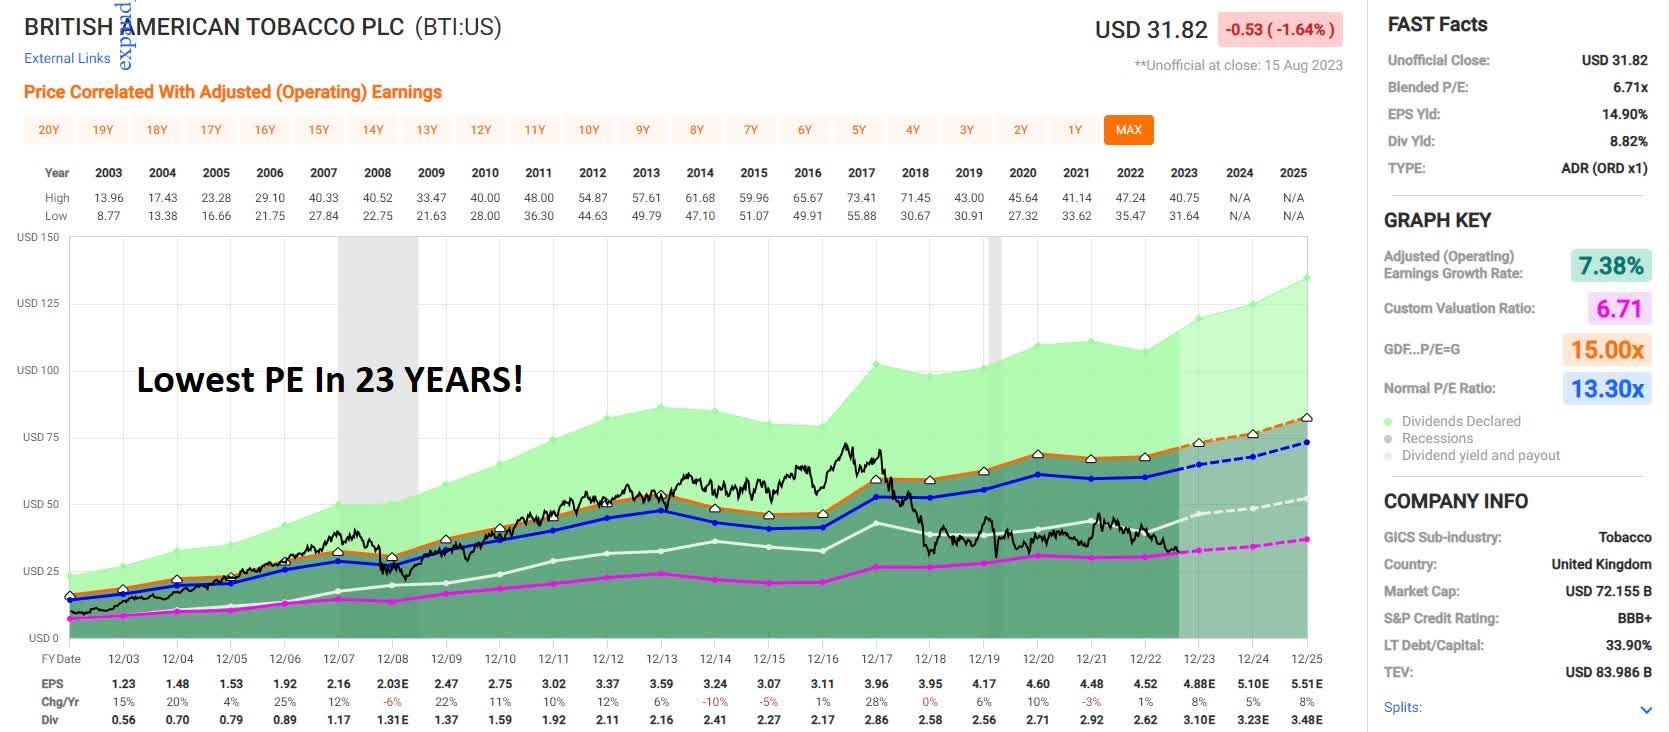
- British American Tobacco is trading at the lowest P/E in 23 years, the highest yield in 23 years, and a 52% historical discount.
- This article debunks 7 myths about British American Tobacco, showing with facts how it's no more "broken" than PepsiCo and Lockheed Martin stocks were during their long bear markets.
- The last time British American Tobacco was this undervalued, it soared 3,500% in the next 17 years, doubling the returns of Amazon and beating the Nasdaq by 21X. Management is guiding for 16% to 18% long-term returns from here, and the stock could soar 160% by 2025 alone, based on its current fundamentals.
Bear markets can last a long time, and so can bubbles. That's why the fear of missing out and cycles of despair and investor disgust is as old as the hills.
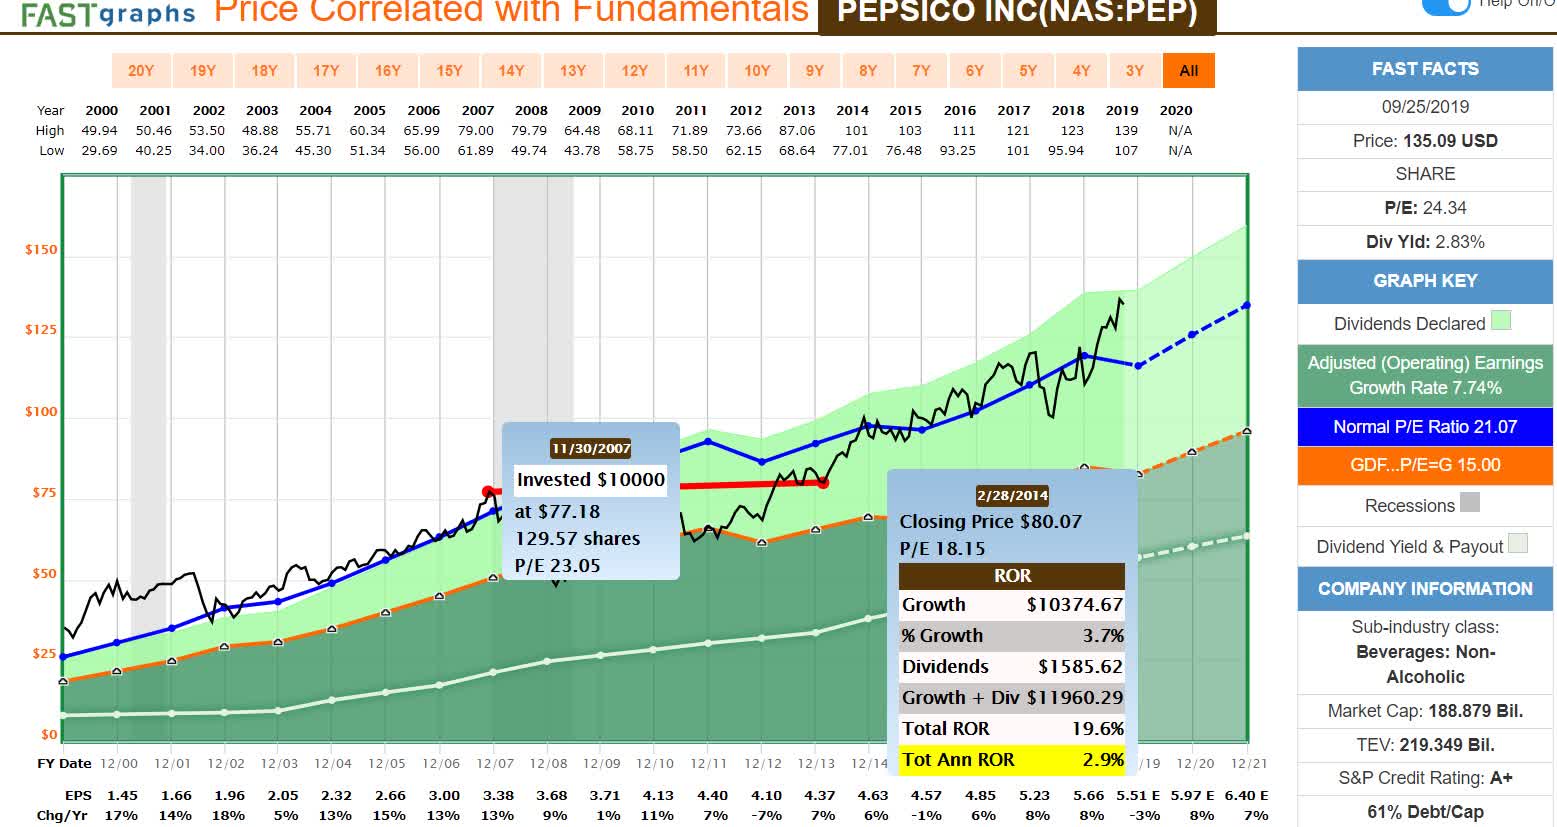
PepsiCo Had Zero Returns For Almost 7 Years
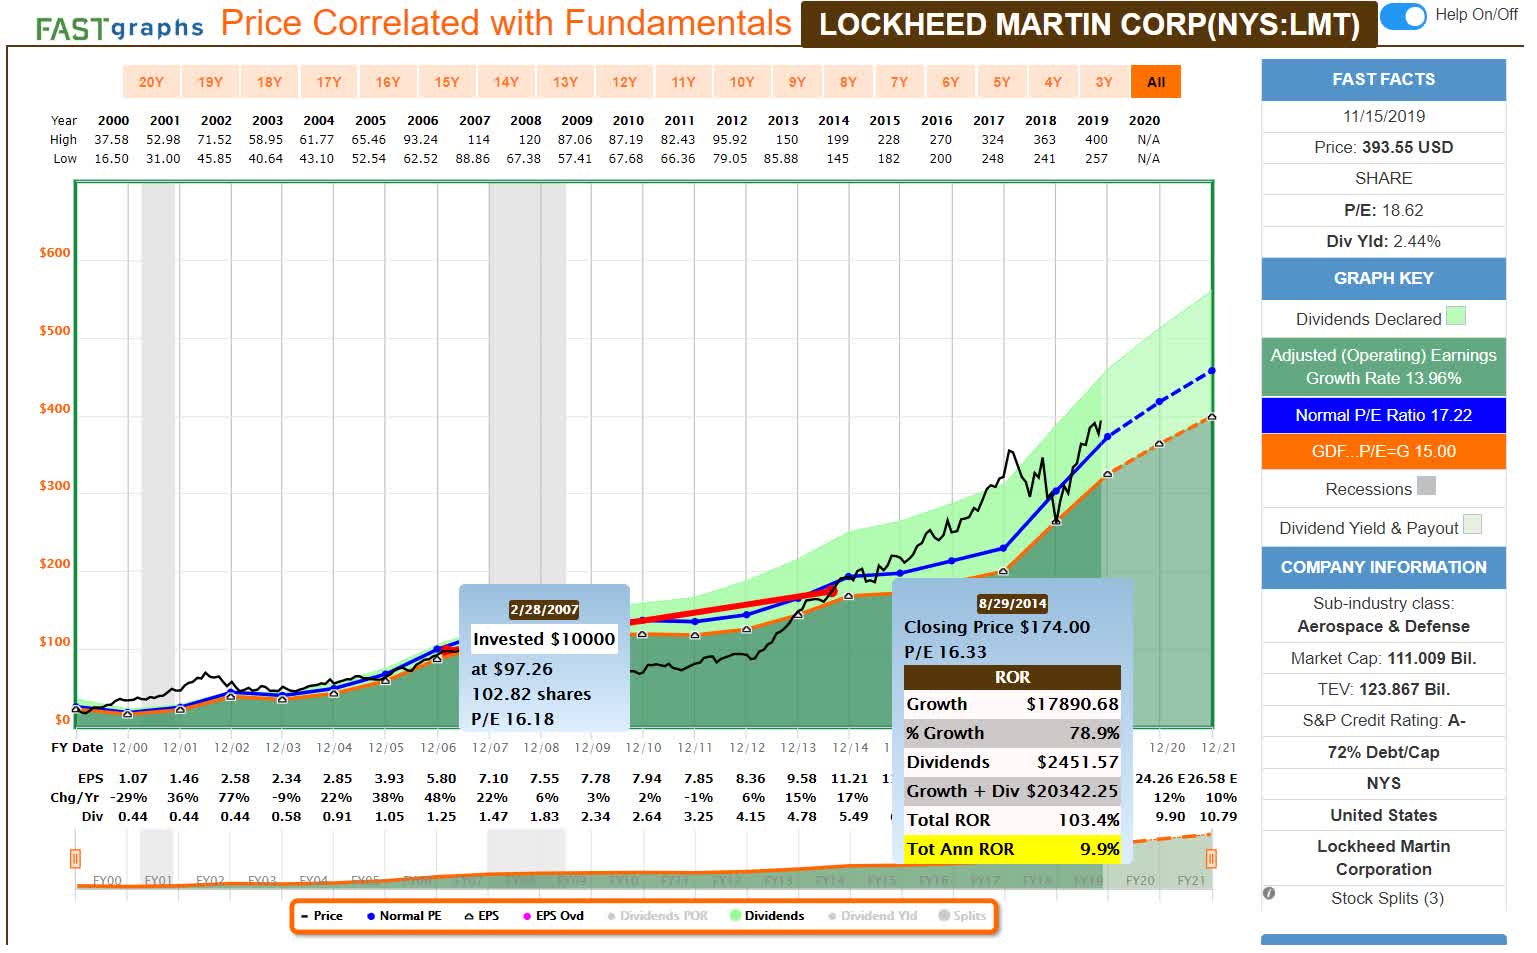
Lockheed Martin's Lost 7 Years
I bring this up because "long-term" investing is a lot longer than most people realize.
| Time Frame (Years) |
| Total Returns Explained By Fundamentals/Valuations |
| 1 Day |
| 0.02% |
| 1 month |
| 0.33% |
| 3 month |
| 1.0% |
| 6 months |
| 2.0% |
| 1 |
| 4% |
| 2 |
| 12% |
| 3 |
| 20% |
| 4 |
| 28% |
| 5 |
| 36% |
| 6 |
| 47% BTI Bear Market |
| 7 |
| 58% PEP, LMT, Midstream Bear Markets |
| 8 |
| 68% |
| 9 |
| 79% |
| 10+ |
| 90% |
| 20+ |
| 91% |
| 30+ |
| 97% |
(Sources: JPMorgan, Bank of America, Fidelity, RIA, Princeton.)
Today I want to update British American Tobacco p.l.c. ( BTI ), which several Dividend Kings members have been asking about because of continued weakness in its six-year bear market.
Buy At A 50% Historical Premium And Suffer A Lost Decade
Buy At A 50% Historical Discount, And You're Still Making Money
Paying 21X earnings for BTI was madness, and paying seven or 8X earnings is pure brilliance.
Thanks to that fat and steadily growing dividend, this likely future dividend aristocrat (in 2025) has been delivering 8% annual returns even during its 2nd worst bear market in history.
If You Don't Buy British American Now, You Just Never Want To Buy British American
The only time BTI has been cheaper than today was February 2000, the end of the ultimate perfect storm of negativity about tobacco.
- Tech bubble value crash (50% decline in value stocks)
- + Master Settlement with 46 states for $206 billion.
British American's Worst Bear Markets Since 1985
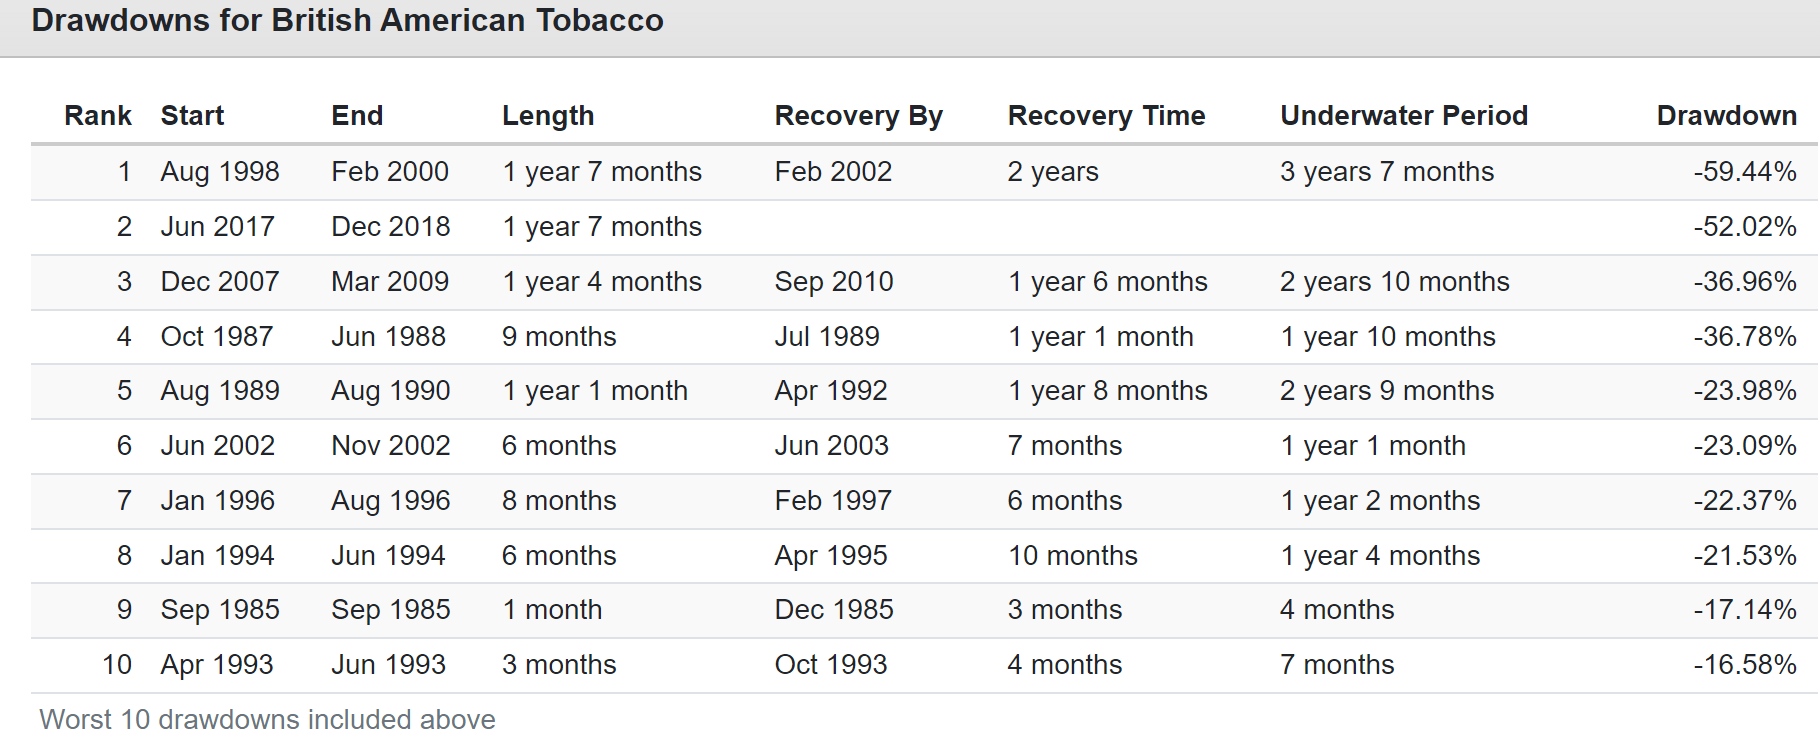
Is this the longest bear market in BTI history? Yes.
And here's why that created the best buying opportunity of the last 23 years.
The Last Time British American Was This Undervalued: February 2000 To May 2017 (50% Undervalued To 50% Overvalued Over 17 Years)
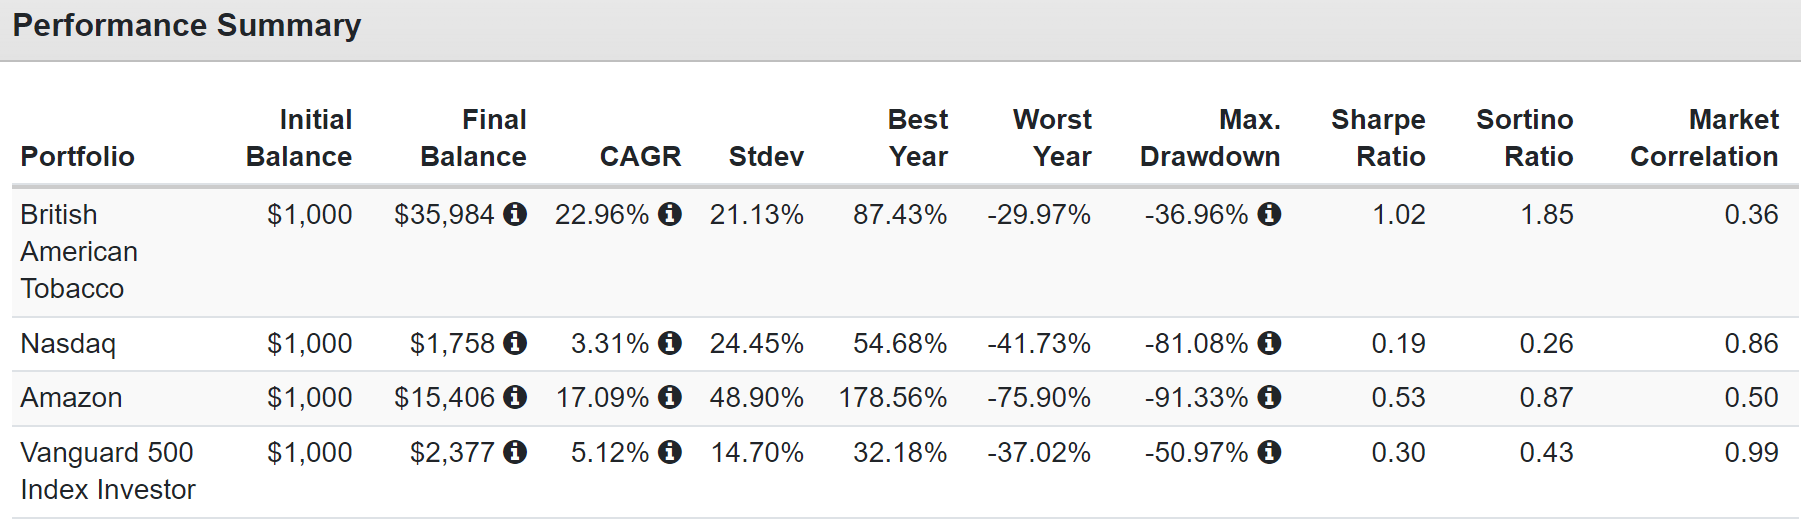
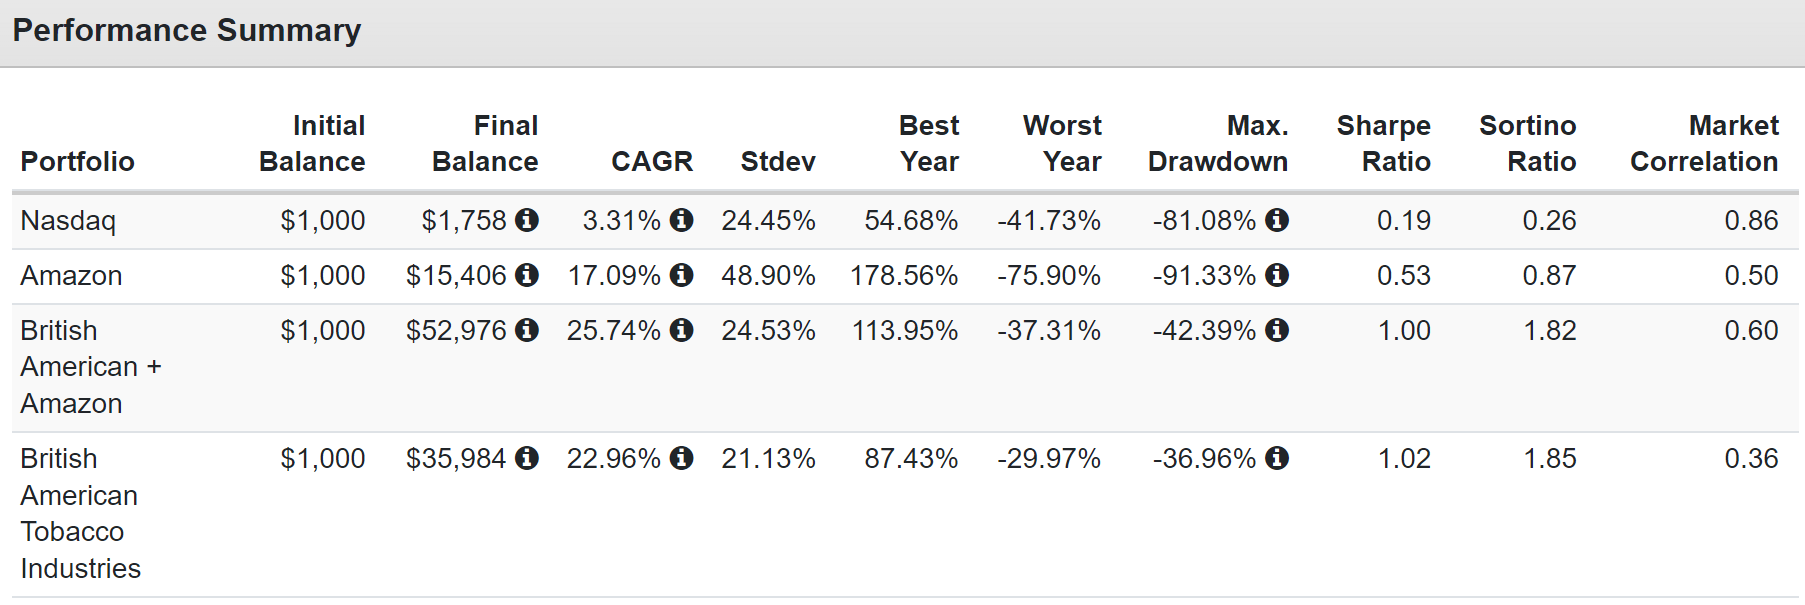
How do you turn $1,000 into $36,000 over 17 years with a value stock? Buying it when its 50% undervalued and then selling when its 50% overvalued.
That's how you can double the returns of Amazon and outperform the Nasdaq by 21X.
Am I cherry-picking those dates? Yes, to prove a point. Valuation always matters.
Anyone telling you "British American's 6-year bear market proves it a value trap" is cherry-picking.
Anyone paying a 50% premium for even God's own company is a pure and simple speculator.
There are two times in a man's life when he shouldn't speculate. When he can't afford it, and when he can." - Mark Twain.
From 2000 to 2016, the Nasdaq went nowhere and lost money adjusted for inflation.
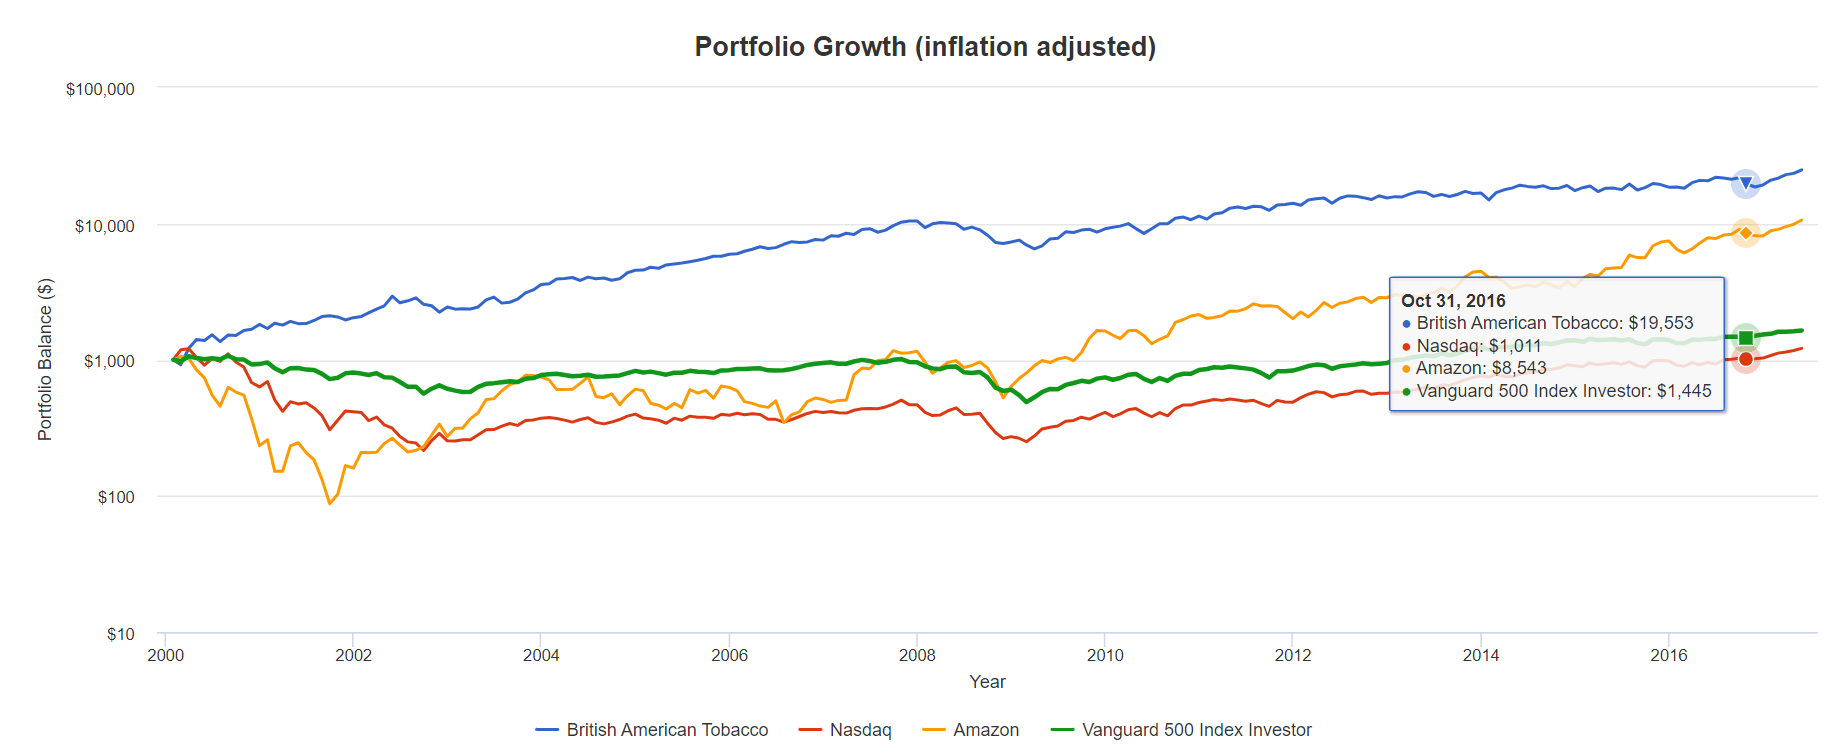
Imagine you gave into FOMO during the tech bubble and bought the Nasdaq (COMP.IND) in March 2000:
- by March 2002, you were down 82%
- by March 2010, you were still down 56%
- October 2016 you finally break even adjusting for inflation.
How much would you have loved tech in 2016? How much would you have loved BTI after it was up 20X adjusted for inflation?
Can you see why so many high-yield investors bought BTI in 2016 and 2017? "Low rates forever, TINA; this time is different, no price too high for BTI!"
Just as the idea of another tech bubble occurring within our lifetime in 2002, at the depths of the tech despair, seemed insane, the idea of a 50% BTI bubble seemed just as insane in Feb 2000.
Right before BTI went on a 3500% rally for 17 years, that left Amazon (AMZN) in the dust.
Do you know the only thing better than BTI during those 17 years when this tobacco stock crushed Amazon? Combining BTI and Amazon.
The Power Of Diversification And Rebalancing (March 2000 To May 2017)
How can combining BTI, one of the hottest stocks during that period, with a worse-performing stock like Amazon result in even higher returns?
Because in the tech crash, BTI was flying, and you were selling at a profit to buy Amazon in the tech crash. You did this three different times.
And during BTI's longest bear market in history?
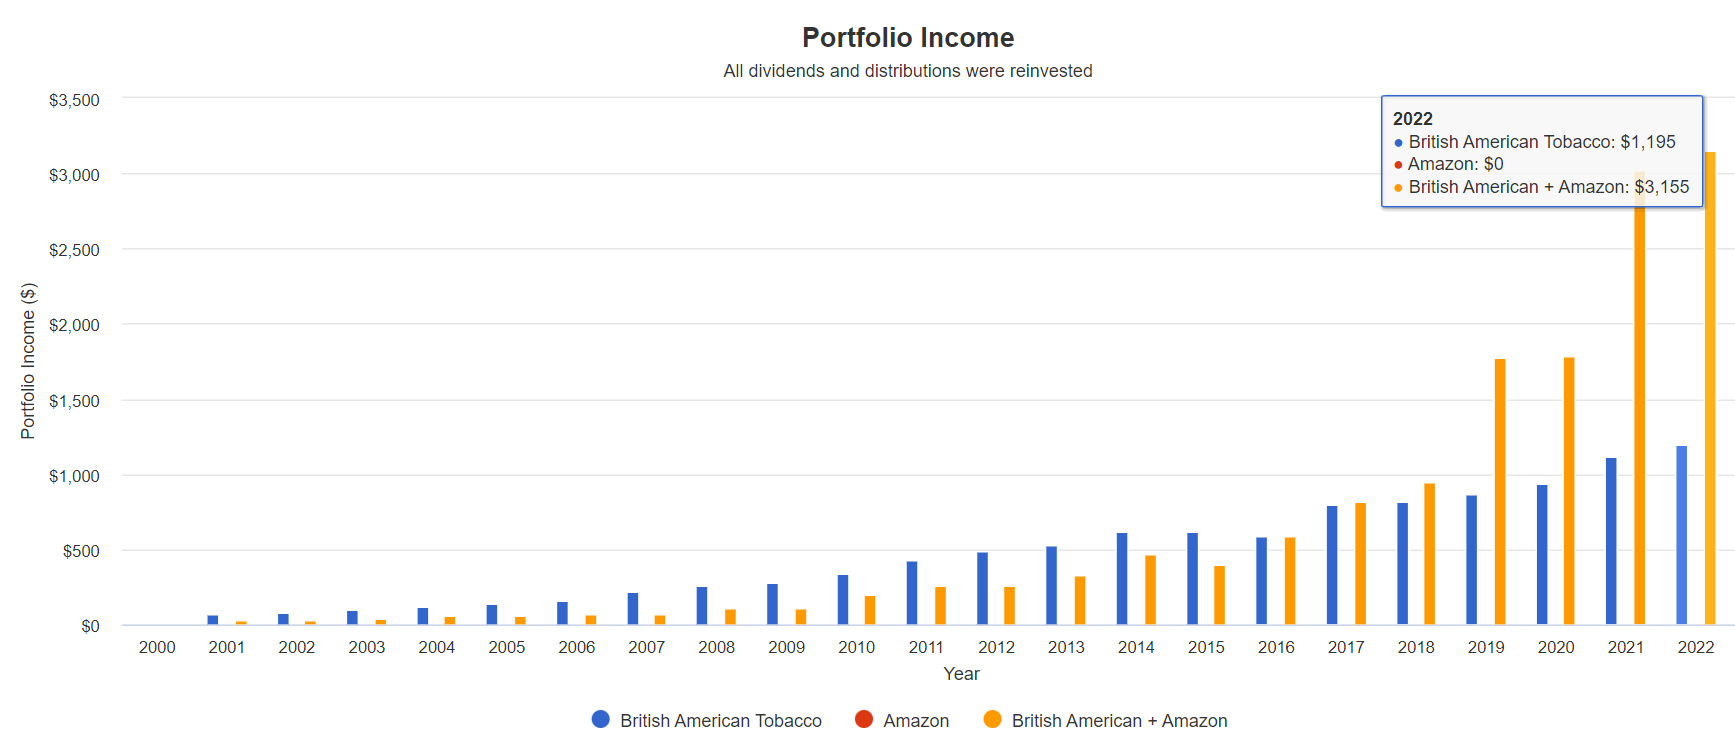
The Power Of Diversification And Rebalancing To Maximize Income (March 2000 To Today)
Amazon fell 93% in the tech crash, and BTI soared to the heavens. In the post-2017 BTI crash, tech soared, and BTI crashed.
Here is the power of annual rebalancing and combining high yield with hyper-growth on display.
Better returns than either stock separately and income growth like this!
Yield + Growth: A Magic Money Minting Machine
| Metric |
| BTI |
| BTI+ AMZN |
| Total Dividends |
| $10,759 |
| $14,599 |
| Total Inflation-Adjusted Dividends |
| $6,148.00 |
| $8,342.29 |
| Annualized Income Growth Rate |
| 14.8% |
| 25.7% |
| Total Income/Initial Investment % |
| 10.76 |
| 14.60 |
| Inflation-Adjusted Income/Initial Investment % |
| 6.15 |
| 8.34 |
| More Inflation-Adjusted Income Than VYM |
| NA |
| 1.36 |
| Starting Yield |
| 6.6% |
| 2.6% |
| Today's Annual Dividend Return On Your Starting Investment (Yield On Cost) |
| 119.5% |
| 315.5% |
| 2023 Inflation-Adjusted Annual Dividend Return On Your Starting Investment (Inflation-Adjusted Yield On Cost.) |
| 68.3% |
| 180.3% |
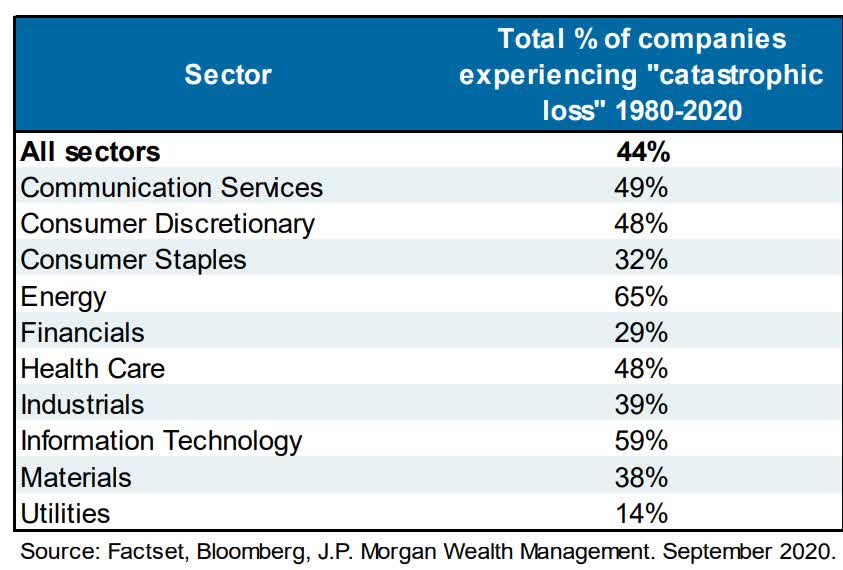
Ok, this is all very compelling math, but what proof is there that BTI isn't one of that 44% of stocks destined to suck forever?
Let me debunk the myth that BTI is a broken stock. I will now prove with math and facts and the reason that BTI today is no more broken than Pepsi or Lockheed were during their 7-year bear markets.
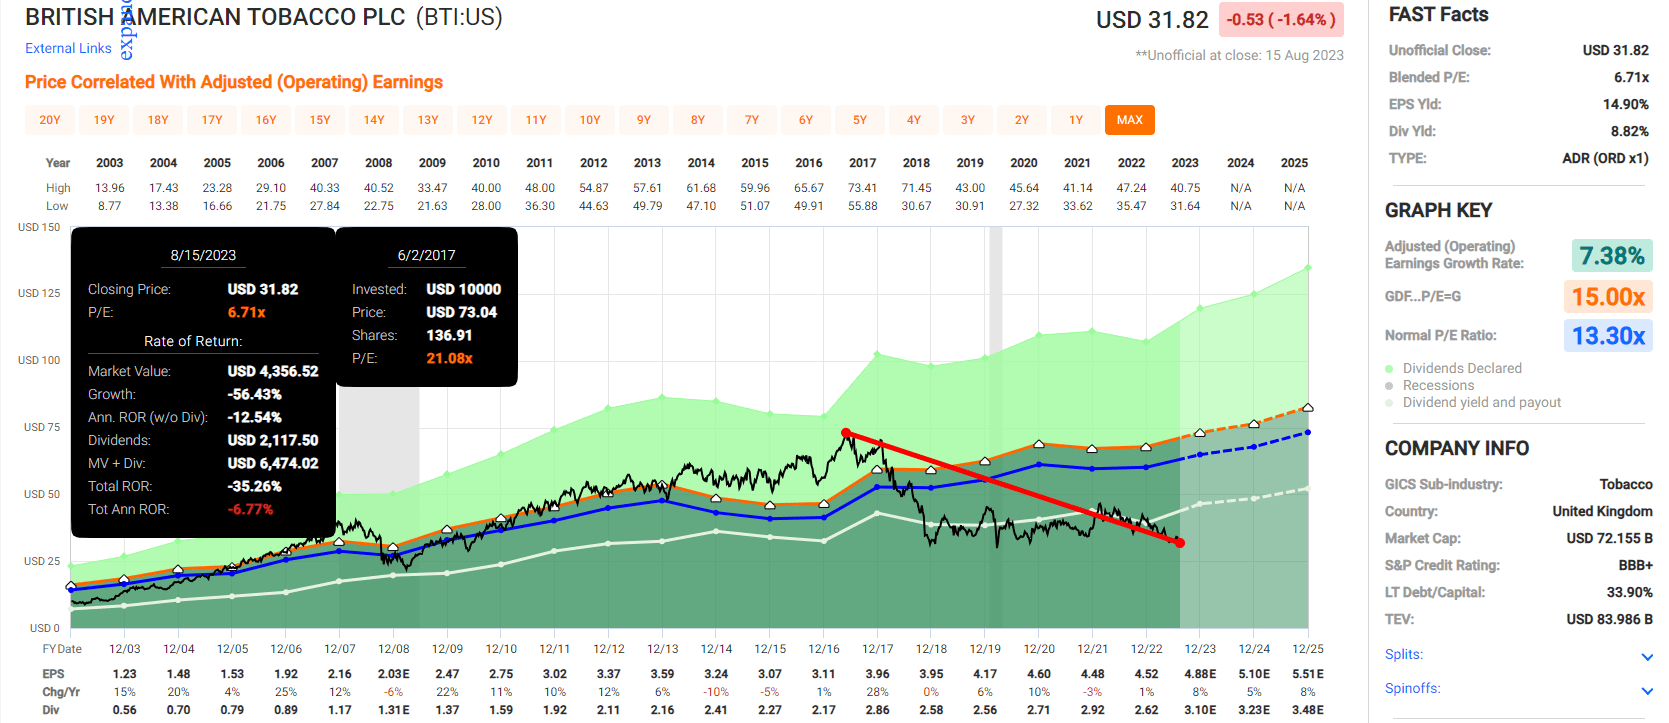
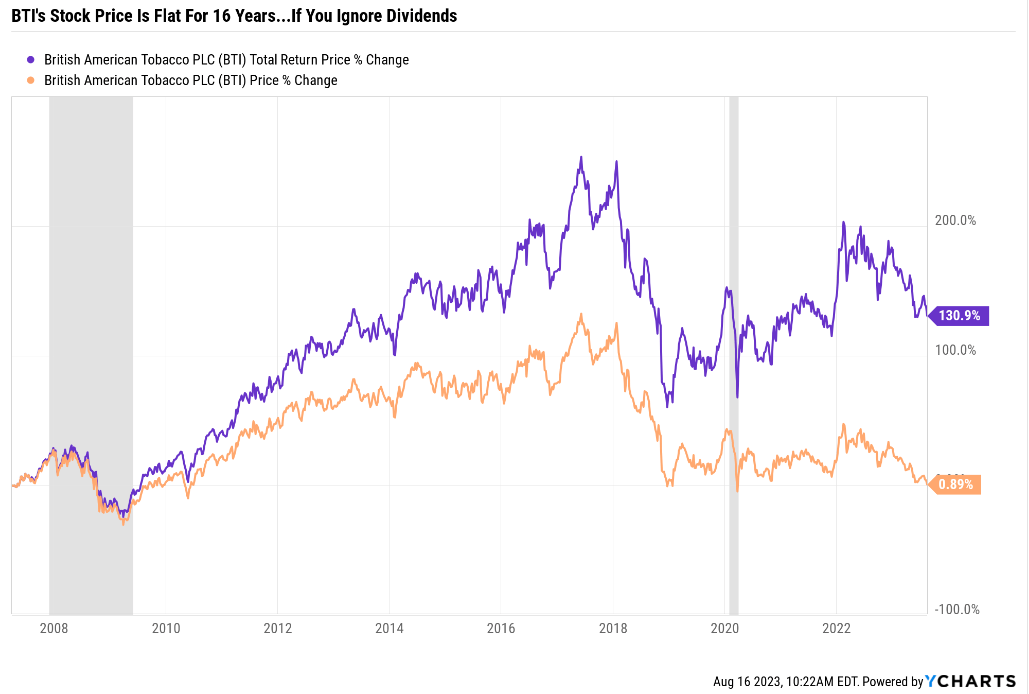
Myth #1: British American Has Delivered No Returns For 16 Years
BTI's stock price is the same as it was in 2007! For 16 years, the stock price has gone nowhere, and adjusted for inflation, its lost money! So that proves BTI is a loser, right? A value trap? A broken company?
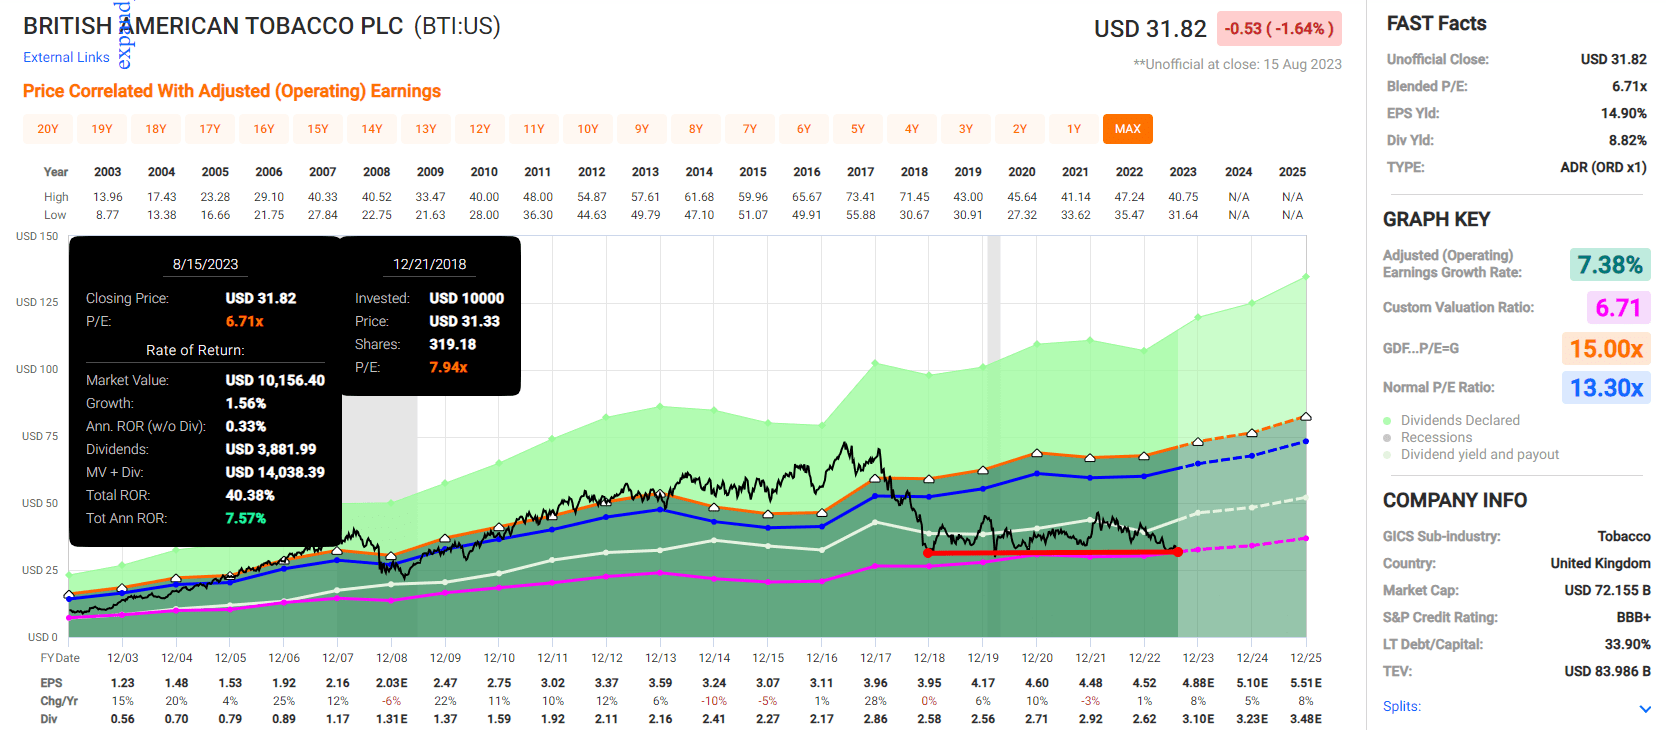
Except if you include dividends, it's up 131%.
This is something I see in the comments all the time. Ignoring dividends, which for high-yield stocks is the entire point.
Imagine a bond investor who didn't count bond income in their total returns. How silly would that be? When 97% of historical bond returns are from income.
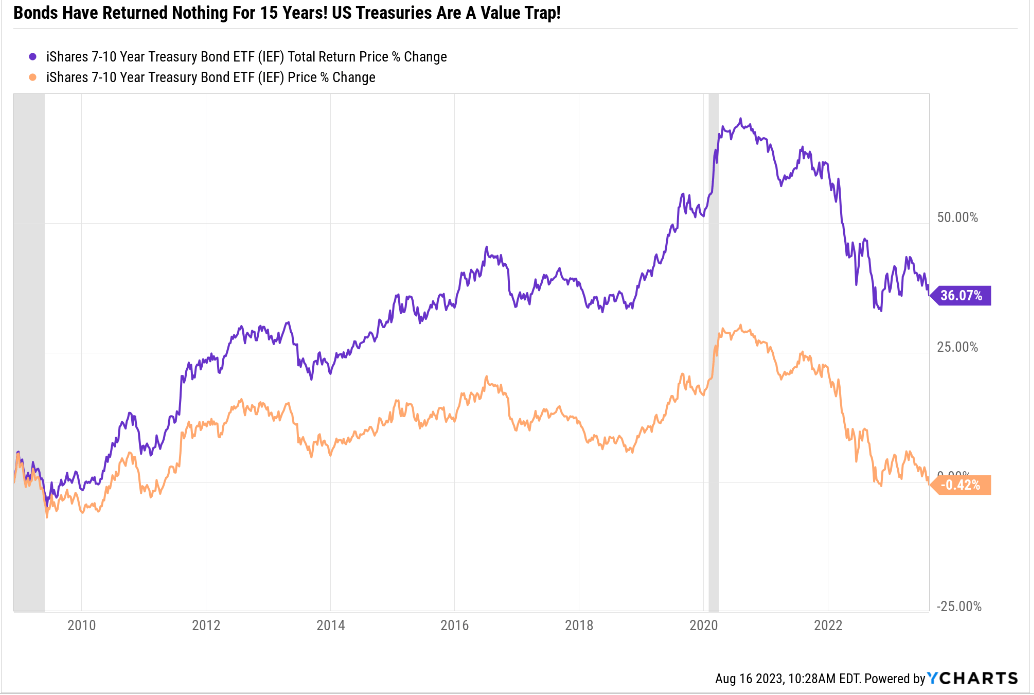
Did I prove that U.S. treasuries are a value trap? Or did I prove that some people who want to lie with statistics can cherry-pick?
Did 16 years of flat returns for the Nasdaq prove that tech stocks suck? That Microsoft being flat for 15 years make it a value trap?
Myth #2: British American Has Dangerous Levels Of Debt, And That's Why It's Getting Crushed
Big debt-funded M&A can sometimes set off long bear markets if a stock is overvalued. It happened with AbbVie (ABBV) and BTI when it bought the rest of Reynolds in 2017 for $50 billion, mostly in debt.
OMG, BTI has $54 billion in debt! It's broke and that's why its stock price is sliding into oblivion! No price is too low to get out of this value trap!
Except for that, debt alone tells you nothing about a company's solvency or safety.
The Bond Market Is Growing Steadily Less Worried About BTI's Debt
FactSet Research Terminal
In the last six months, the risk of BTI defaulting on its debt has fallen 23% according to the bond market, the "smart money" on Wall Street.
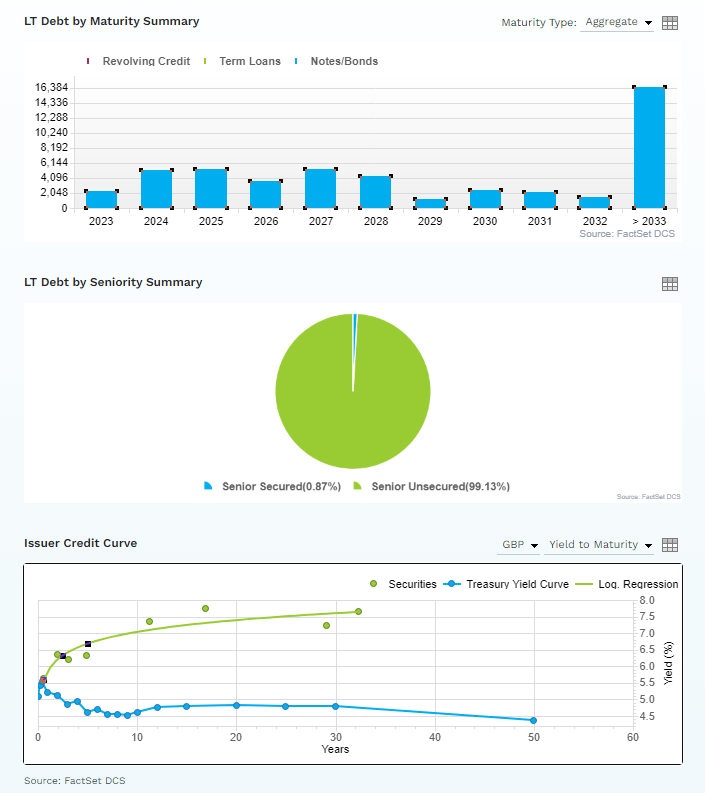
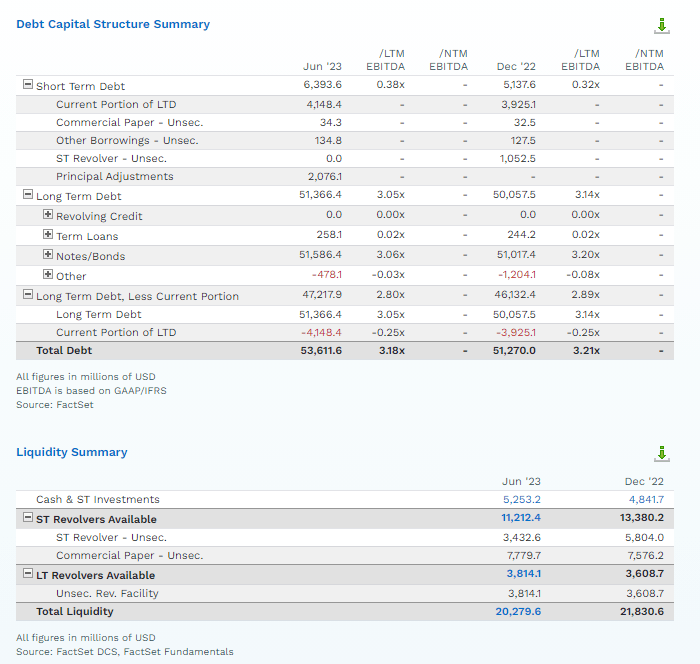
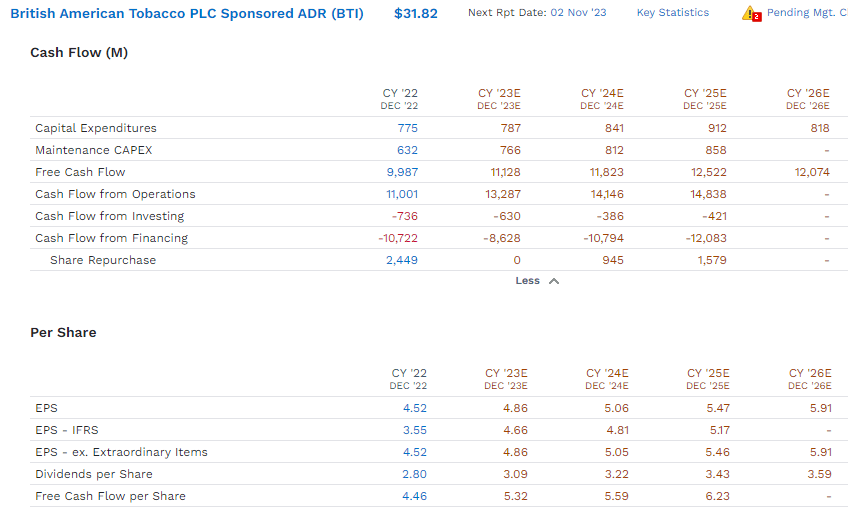
BTI has $7.6 billion in debt maturing between now and the end of 2024.
How much cash does it have? $5.25 billion, but what else will it have between now and 2024?
$5.2 billion in post-dividend free cash flow + $5.25 billion in cash on the balance sheet today + $15 billion in revolving credit available.
That's $25.5 billion in liquidity that BTI will have by the end of 2024. And $10.5 billion in cash that's free to pay off $7.6 billion in debt if BTI wanted to spend the money that way.
BTI is broke? Nope, anyone who tells you that doesn't know the math. But now you do.
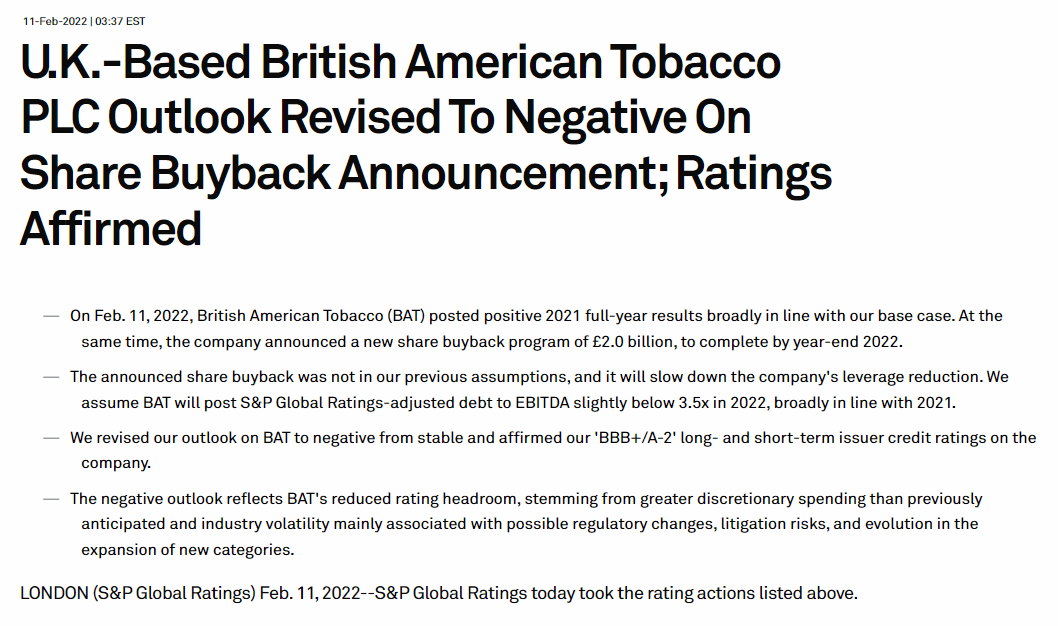
Myth #3: S&P's Downgrade Proves BTI Is Doomed!
A negative outlook means a 33% chance that S&P will downgrade the rating within two years and a positive outlook means the opposite.
BTI's revision down to a negative outlook was back in February 2022 and had nothing to do with anything happening now.
The buyback program is the main deviation from our previous base case. We understand the company remains committed to ongoing leverage reduction, but higher discretionary spending in 2022 will slow this down. Regarding capital allocation, BAT's objectives include investments in new categories (vaping, tobacco heating products [THP], and oral tobacco), a 65% dividend payout ratio, and possible bolt-on acquisitions to expand beyond nicotine products. The company targets a net debt to EBITDA of 2.0x-3.0x (according to the company's adjustments), and at the end of end-2021, it was close to 3.0x." - S&P (emphasis added).
BTI has suspended the buyback for now to focus on deleveraging out of an abundance of caution just in case the Fed has to keep rates higher for longer.
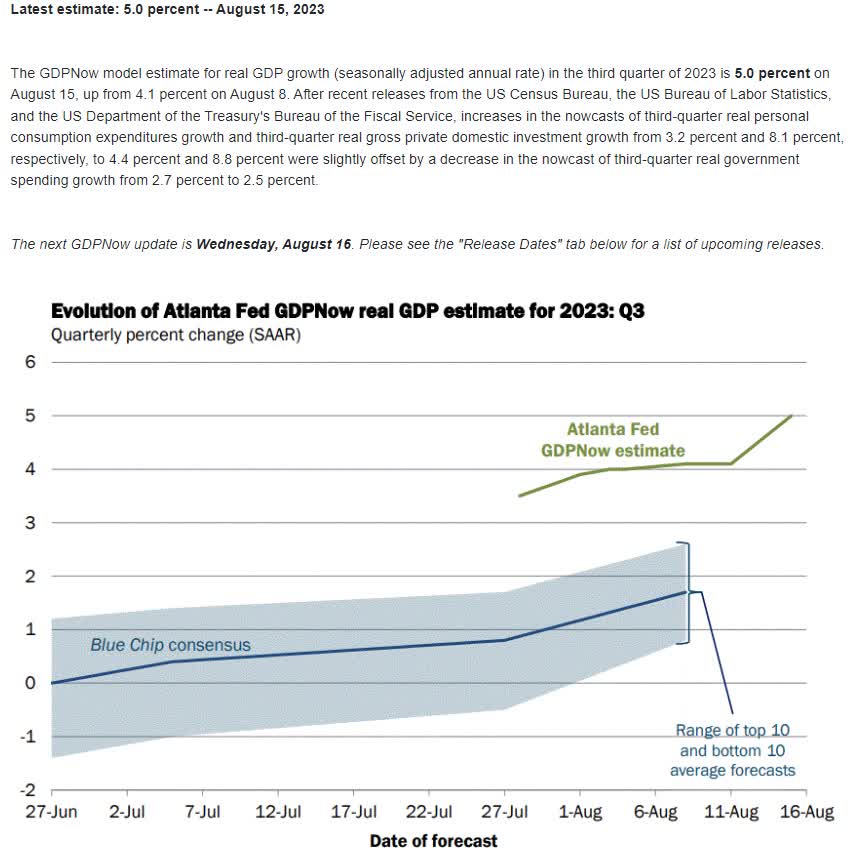
The U.S. economy has started to boom, much as it did after the Pandemic.
- Industrial production just jumped 1% MOM or 12.8% annualized.
Most likely, this is temporary, but if not, the Fed will likely hike several more times and keep rates higher for longer. Possibly several years.
We would consider lowering the rating if the company does not continue its leverage reduction trend, with adjusted debt to EBITDA remaining close to or slightly below 3.5x during 2022-2023. This could stem from weaker operating performance than anticipated or additional discretionary spending due to acquisitions or shareholder remuneration. Other downside risks include changes in the regulatory environment and litigation risks.
We could revise the outlook to stable if BAT's adjusted debt to EBITDA approaches 3.0x over the next 18-24 months. This could derive from stronger performance in new product categories, a robust pricing environment in combustible businesses, and a prudent approach to discretionary spending." - S&P (emphasis added).
OK, so what is BTI's current leverage ratio, and what does the trend look like?
Myth #4: BTI's Balance Sheet Is Dangerous And Getting Worse Due To Rising Rates!
This is a plausible-sounding fear, $53 billion in debts in a higher for longer world.
And here are the facts.
BTI Consensus Balance Sheet Forecast
| Year |
| Cash |
| Net Debt (Millions) |
| Interest Cost (Millions) |
| EBITDA (Millions) |
| Operating Cash Flow (Millions) |
| 2022 |
| $4,162 |
| $47,278 |
| $1,817 |
| $15,987 |
| $15,032 |
| 2023 |
| $5,552 |
| $45,782 |
| $2,377 |
| $17,490 |
| $16,382 |
| 2024 |
| $6,616 |
| $42,772 |
| $2,197 |
| $17,900 |
| $16,756 |
| 2025 |
| $8,080 |
| $39,379 |
| $1,927 |
| $18,697 |
| $17,613 |
| 2026 |
| NA |
| $31,654 |
| NA |
| $19,540 |
| $18,456 |
| Annualized Growth |
| 24.75% |
| -9.54% |
| 1.98% |
| 5.15% |
| 5.26% |
(Source: FactSet Research Terminal.)
Debt is declining by 10% per year, cash is rising at 25% per year, and interest costs are rising at a modest rate. Cash flow to pay interest is rising 2.5X faster than interest costs.
BTI Consensus Balance Sheet Forecast
| Year |
| Debt/EBITDA |
| Net Debt/EBITDA (3 Or Less Safe According To Credit Rating Agencies) |
| Interest Coverage (*+ Safe) |
| 2022 |
| 2.96 |
| 2.96 |
| 8.27 |
| 2023 |
| 2.62 |
| 2.62 |
| 6.89 |
| 2024 |
| 2.39 |
| 2.39 |
| 7.63 |
| 2025 |
| 2.11 |
| 2.11 |
| 9.14 |
| 2026 |
| 1.62 |
| 1.62 |
| NA |
| Annualized Change |
| -13.97% |
| -13.97% |
| 3.38% |
(Source: FactSet Research Terminal.)
BTI's debt is not unsafe; anyone who tells you differently isn't listening to the rating agencies.
Or the bond market.
Or the 18 analysts who cover BTI for a living and collectively know it better than anyone other than management.
| Credit Rating |
| Safe Net Debt/EBITDA For Most Companies |
| 30-Year Default/Bankruptcy Risk |
| BBB |
| 3.0 or less |
| 7.50% |
| A- |
| 2.5 or less |
| 2.50% |
| A |
| 2.0 or less |
| 0.66% |
| A+ (2026 consensus) |
| 1.8 or less |
| 0.60% |
| AA |
| 1.5 or less |
| 0.51% |
| AAA |
| 1.1 or less |
| 0.07% |
(Source: S&P, Fitch, Moody's.)
BTI is on track to achieve an A+ credit rating by the end of the decade, possibly even the industry's first-ever AA rating if management continues to deleverage.
Buybacks are expected to resume next year.
- $956 million in 2024 = 1.3% of shares at current prices
- $1.593 billion in 2025 = 2.3% of shares at current prices.
Myth #5: BTI's Dividend Is At High Risk Of A Cut
Many people will tell you that BTI's dividend is unsafe; that's what a 9% yield means, right?! That's a higher yield than junk bonds (8%), and those have a 34% risk of going bust!
| Company |
| Dividend Payout Ratio Policy (85% Safe) |
| Current Payout Ratio |
| British American |
| 65% |
| 64% |
| Philip Morris |
| 75% |
| 83% |
| Altria |
| 80% |
| 77% |
(Source: Management Guidance.)
The big tobacco giants know that a payout ratio must be 85% or less to be safe and have set company policies to maintain safe payout ratios.
BTI has set the most conservative payout ratio and is hitting it yearly.
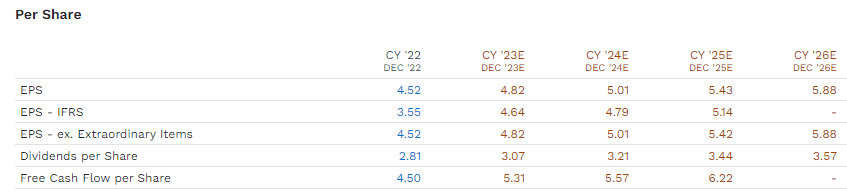
BTI Dividend Consensus Forecast
Do you see a dividend cut here? Nope, just 6.2% annual consensus dividend growth through 2026 when BTI hits a 26-year dividend growth streak.
What about the idea that a low stock price might frustrate management and want to cut the dividend to spend the money on buybacks?
This idea has been floated around many ultra-yield Ultra SWAN aristocrats like (MO) and (EPD).
Remember the Pandemic crash? When oil hit -$38? EPD was a 17% yield and (MMP) 19%. (MPLX) at one point hit a 43% yield!
Did management cut because a 10% yield could allow them to save money and buy back stock?
Heck no! Income dependability is everything for high-yield investors.
Income investors belove MO and BTI because they are aristocrats or soon will be.
Just ask AT&T (T) investors how well their voluntary dividend cut went.
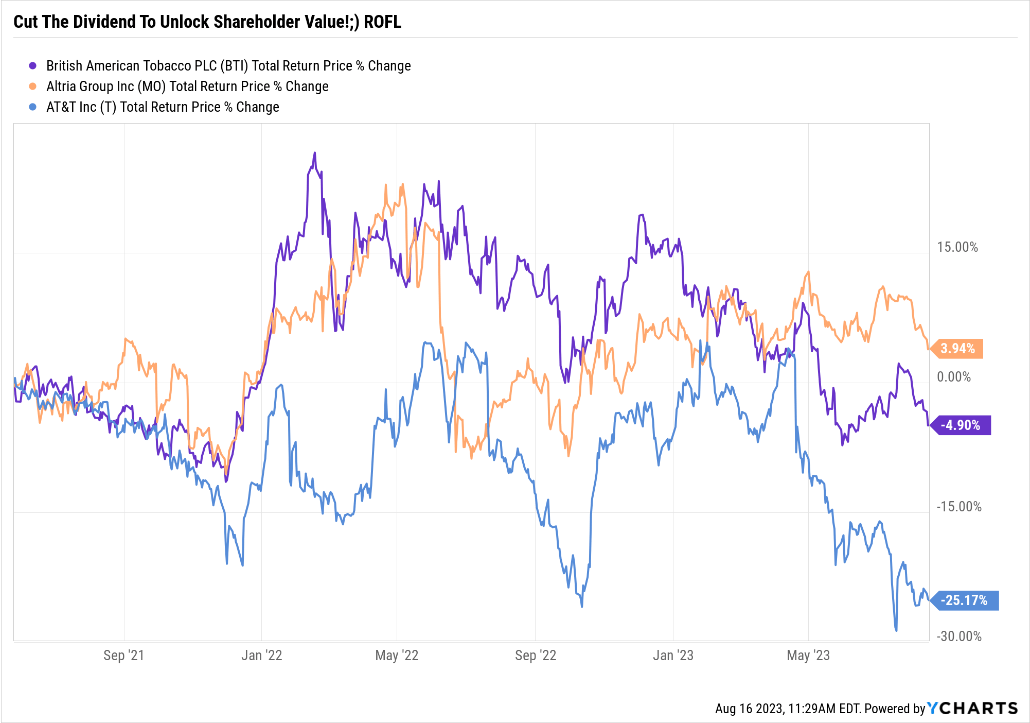
Myth #6: BTI Is A Dying Company!
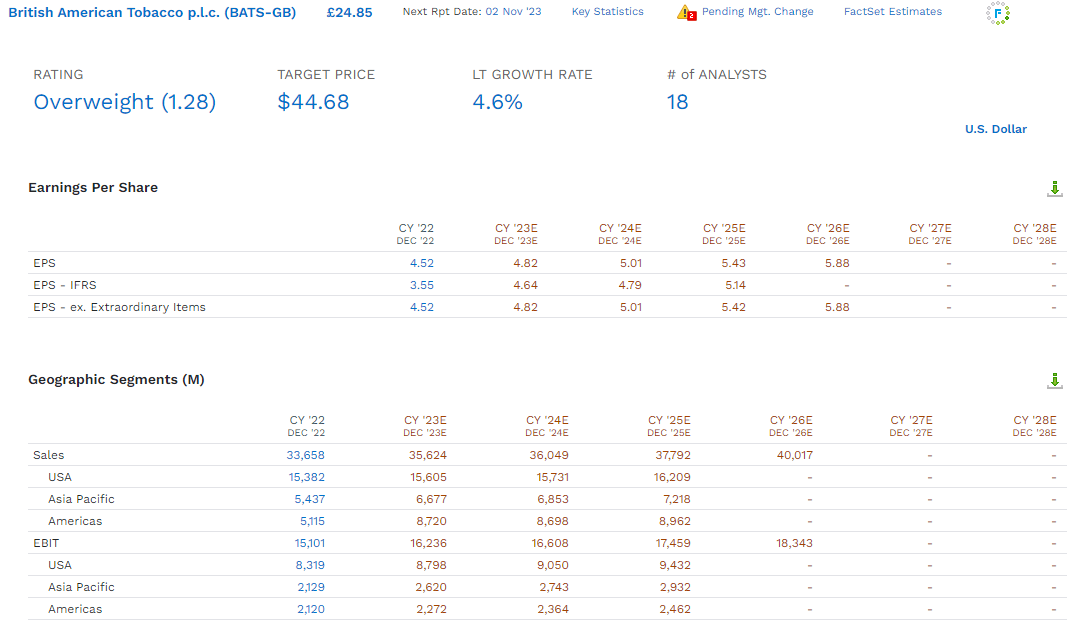
Are sales sliding? Nope.
Are earnings falling in the short-term? Nope, they are hitting record highs every year.
Do the 18 analysts who collectively know BTI better than anyone other than management think it will shrink in the future? Nope, 4% to 5% growth.
| Investment Strategy |
| Yield |
| LT Consensus Growth |
| LT Consensus Total Return Potential |
| Long-Term Risk-Adjusted Expected Return |
| British American Tobacco |
| 9.3% |
| 4.60% |
| 13.9% |
| 9.7% |
| Schwab US Dividend Equity ETF |
| 3.6% |
| 9.70% |
| 13.3% |
| 9.3% |
| Nasdaq |
| 0.8% |
| 11.2% |
| 12.0% |
| 8.4% |
| Vanguard Dividend Appreciation ETF |
| 1.9% |
| 9.7% |
| 11.6% |
| 8.1% |
| REITs |
| 3.9% |
| 7.0% |
| 10.9% |
| 7.6% |
| Dividend Champions |
| 2.6% |
| 8.1% |
| 10.7% |
| 7.5% |
| Dividend Aristocrats |
| 1.9% |
| 8.5% |
| 10.4% |
| 7.3% |
| S&P 500 |
| 1.4% |
| 8.5% |
| 9.9% |
| 6.9% |
| 60/40 Retirement Portfolio |
| 2.1% |
| 5.1% |
| 7.2% |
| 5.0% |
(Source: FactSet, Morningstar.)
9.3% yield today and Nasdaq beating long-term return potential.
Myth #7: British America's P/E Will Never Recover, 7X Earnings Is Now Fair Value
In 2000, BTI was trading at 7X earnings, and the idea that it would ever return to 13 to 14X, its multi-decade historical norm, seemed absurd.
And in 2017, when BTI was 21X earnings, a P/E that had tripled from those bear market lows, it seemed equally absurd to many that it would ever trade as cheap as 14X again.
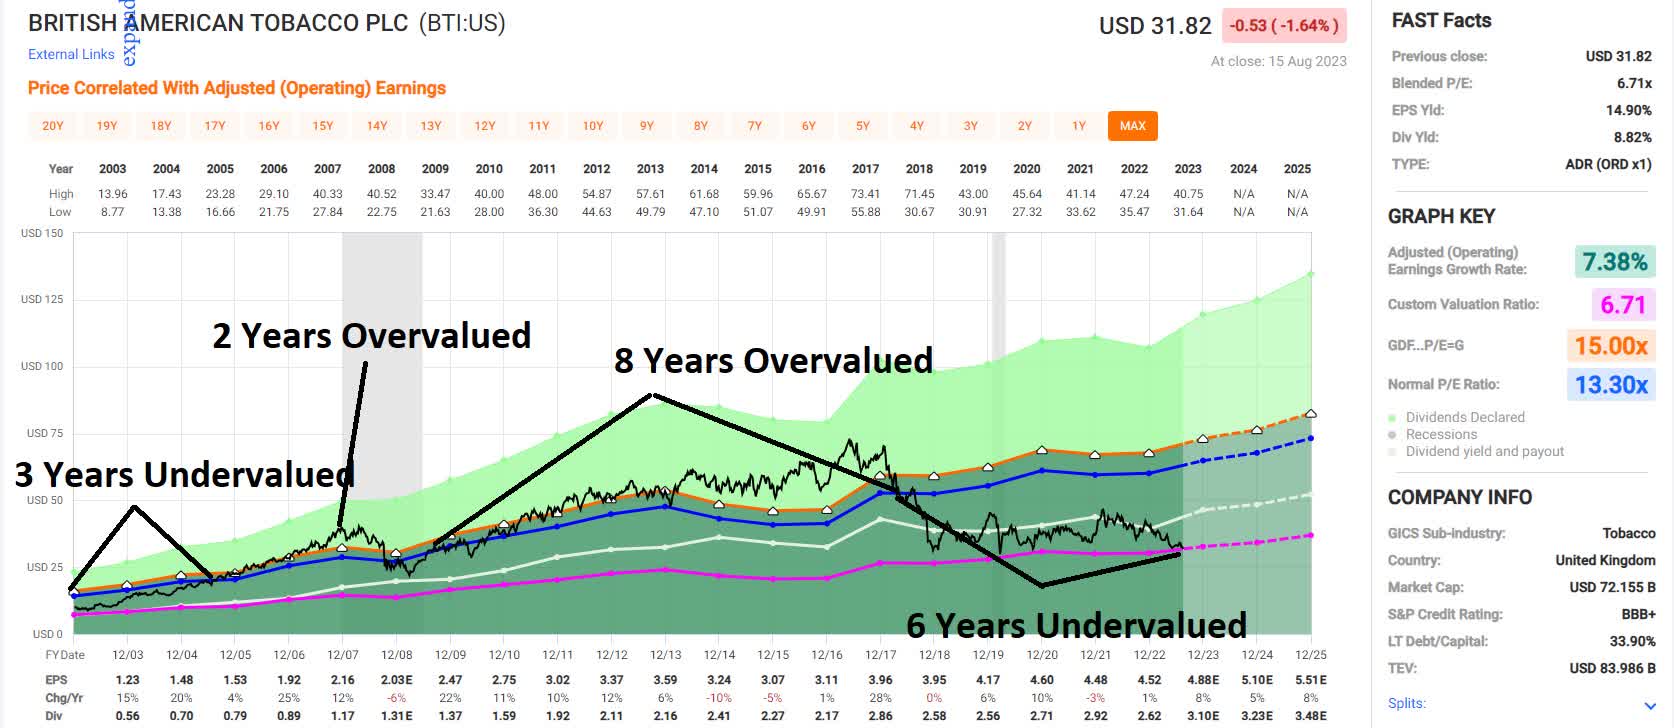
BTI's periods of over and undervaluation can last as long as 8 years.
If you aren't willing to own a stock for 10 years, don't even think about owning it for 10 minutes." - Warren Buffett.
What if BTI's P/E did get stuck at seven forever? Then total returns would still be 9.3% yield + 4.6% growth or 13% to 14% in the future.
The Nasdaq's 37-year return is 13.5%, the best-performing index in history.
BTI can match or even beat that while you earn 12X the yield.
- management growth guidance 7% to 9%
- which would be 16.3% to 18.3% long-term returns.
Bottom Line: Buy British American Before Everyone Else Does, And Your Retirement Will Thank You
You're neither right nor wrong because other people agree with you. You're right because your facts are right, and your reasoning is right—and that's the only thing that makes you right." - Warren Buffett.
- quality score: 93% very low risk 13/13 Ultra SWAN future aristocrat
- historical fair value: $66.45
- current price: $31.79
- discount: 52%
- DK Rating: potential Buffett-style "fat pitch" Ultra Value buy.
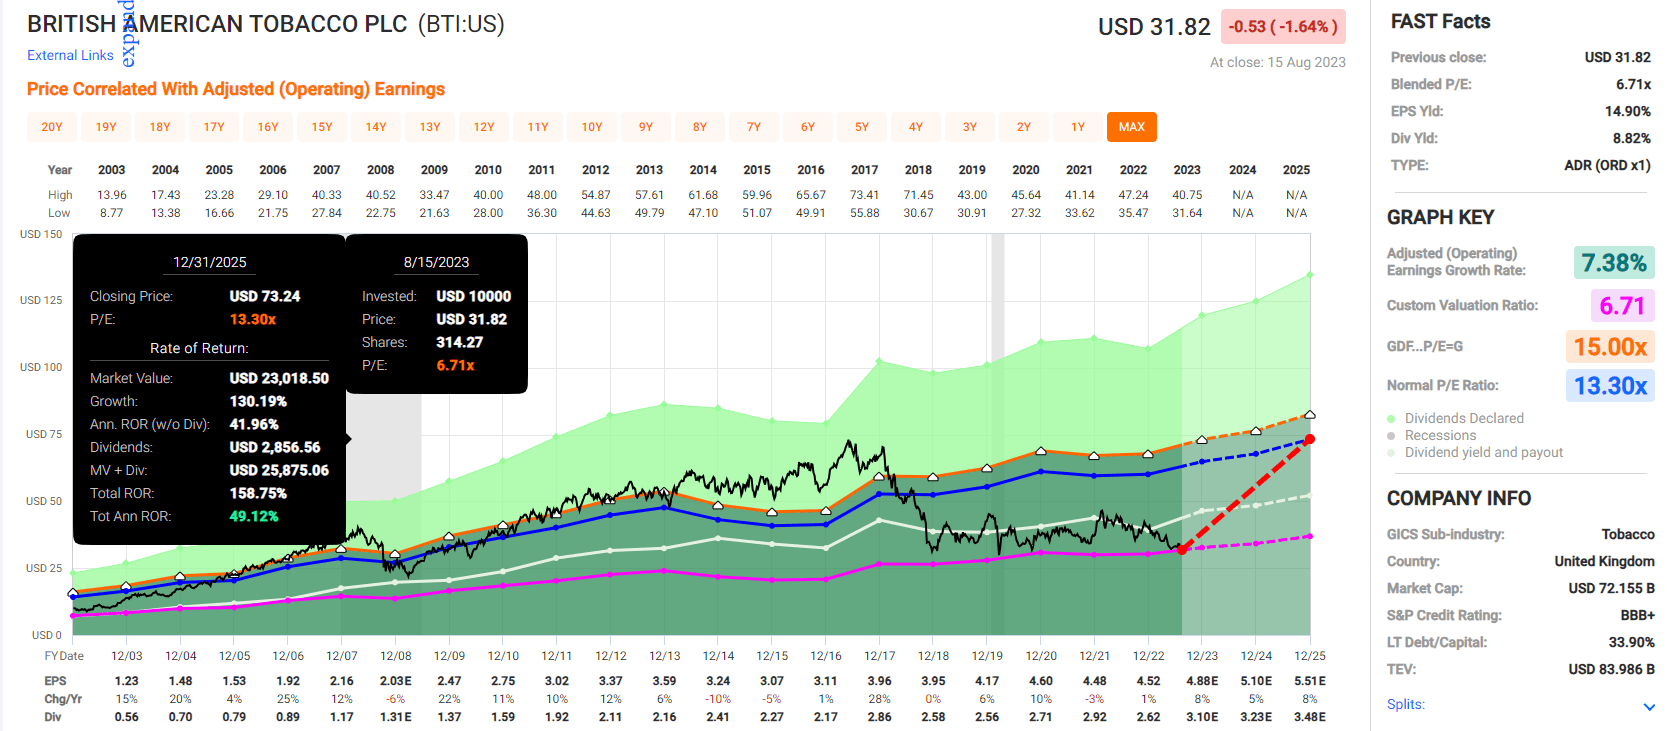
This is NOT a forecast. I don't make forecasts, and I tell you what the latest data says is fair value and what the total return potential is.
If BTI grows as expected and returns to objective market-determined historical fair value (13.3X fair value) by the end of 2025, you will make 160% or a Buffett in his prime 49% annualized return.
This is what the S&P 500 offers you, as far as consensus fundamentally justified total return potential.
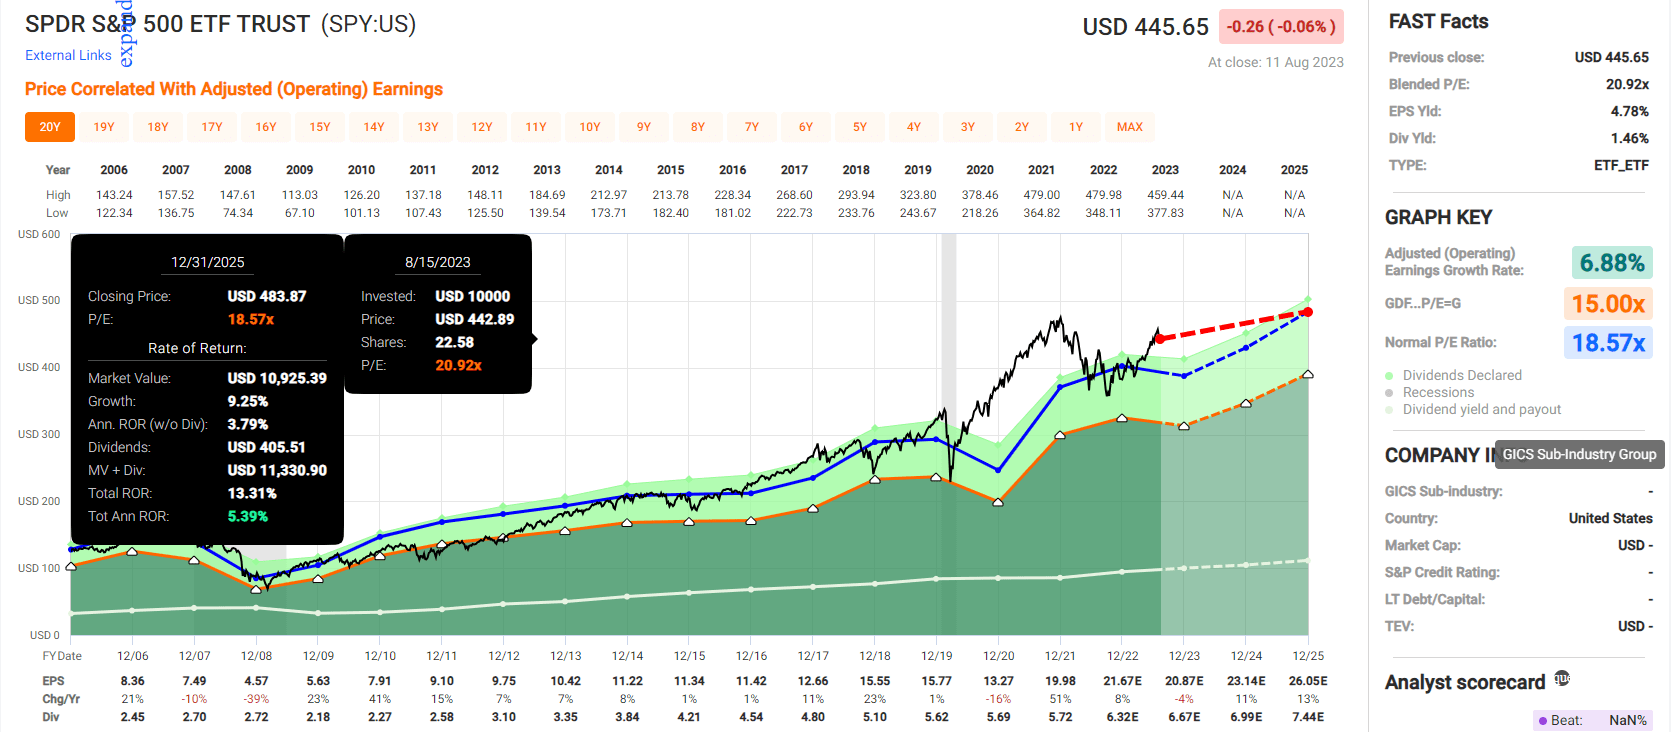
One choice is the 15% overvalued 1.4% yielding S&P 500 that offers 5% short-term return potential through 2025.
The other is 9.3% yielding BTI, which is 52% undervalued and offers 10X the annualized return potential of the broader market.
Does that guarantee BTI will beat the market in the next two years? Nope.
That's not how statistics work.
In the short-term, anything goes. In the long term, fundamentals drive 97% of returns.
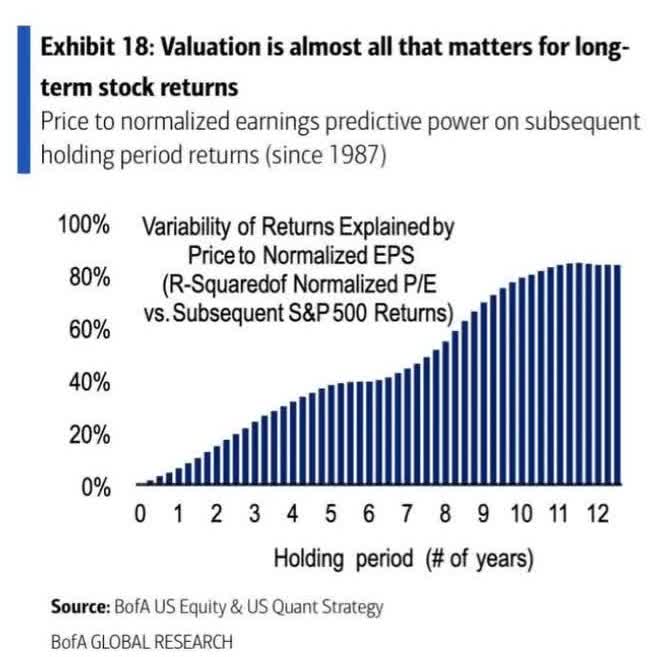
In the very long term, 30+ years, 97% of total returns are earnings and valuation.
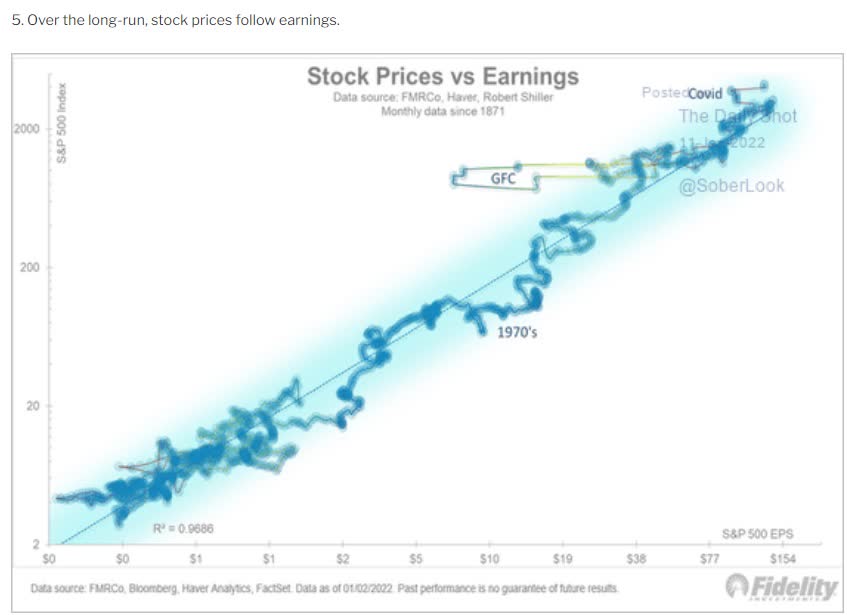
I'm a financial scientist. I go where the facts lead me.
When the facts change, I change my mind, what do you do sir?" - John Maynard Keynes.
Right now, the facts about BTI haven't changed.
It's still growing, its dividend is still safe, and the company is one of the best blue-chip bargains in the world.
If that changes, I'll let you know.
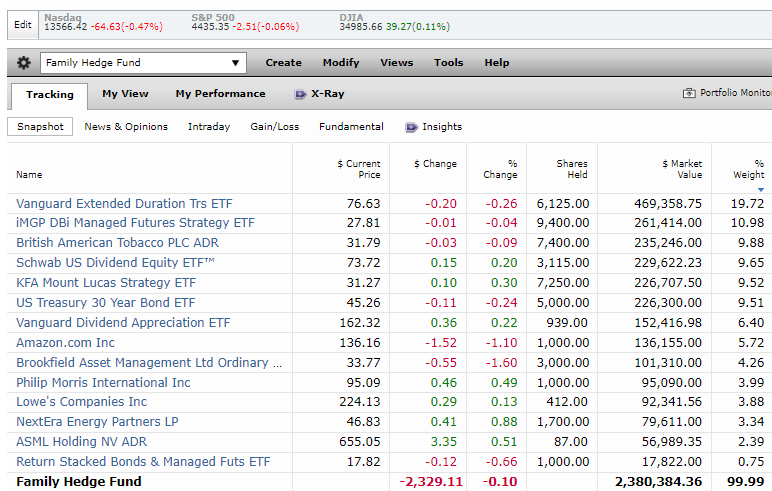
BTI is my biggest stock holding, and I have no plans to change that.
For further details see:
Buy Like Buffett: British American's 9.3% Yield Is The Highest In 23 Years