CA - Chevron Is Better Than Cenovus
2023-08-23 17:11:08 ET
Summary
- Cenovus, a Canadian tar sands producer, offers less to investors as compared to shale oil producers in the lower 48, including Chevron.
- Also, Cenovus does not have exposure to the fast-growing global and very profitable LNG market. Chevron does.
- Bottom line: Chevron has a superior asset base, a higher free cash flow yield, stronger dividend growth, and overall superior total returns.
- That being the case, long-term energy investors should sell Cenovus and buy Chevron.
I had to stretch to rate Cenovus ( CVE )( CVE:CA ) a "Hold" in my last Seeking Alpha article (see Cenovus: What To Expect From Oil Sands Producer's Q4 ). But I shouldn't have… I should have gone with what I have been writing on Seeking Alpha for many years now: The shale oil producers in the lower 48 offer investors superior options as compared to the Canadian tar sands producers: including superior dividend income. This has been demonstrated for years now over multiple commodity price cycles and a pandemic. That being the case, why would any energy investor buy a company like Cenovus when they could just as easily buy Chevron ( CVX ) instead? Not to mention that - over the last decade - the Vanguard S&P 500 ETF ( VOO ) has returned 200% more than Cenovus (which actually has a negative total return over that time frame):
Investment Thesis
The investment thesis for the oil sands producers is relatively simple and straightforward: Before the era of shale oil (i.e., light-sweet crude), U.S. refiners assumed that they would be heavily dependent on heavy crude imports from Venezuela and OPEC for many years into the future in order to meet domestic demand for gasoline, diesel, and distillates. As a result, they reconfigured their refineries to run a larger slate of heavy crude. That slate included Canadian oil sands crude, which were effectively landlocked with pretty much all export capacity going south to its energy-hungry neighbor, the US. Indeed, Phillips 66 ( PSX ) imports more Canadian oil sands crude than any other company and, as a result, has a generally higher distillates yield vs. its peers.
Today, of course, growing U.S. shale production has overwhelmed domestic light-sweet refining capacity and pretty much all the incremental production increases of shale are now being exported. Indeed, according to RBN Energy (see Make That Connection: Understanding North America Crude Oil Markets In The Export Era ), U.S. crude oil exports are currently running at ~4 million bpd with the vast majority being shale barrels and a relatively small percentage originating from Canada in the form of WCS:
RBN Energy
This is that many "analysts" - and especially politicians on the right - don't understand when they say "America is no longer energy independent." They point to U.S. foreign oil imports and somehow reach the conclusion that "America is not energy independent" when just the opposite is true: America is the largest oil producer on the planet, became the No. 1 LNG exporter on the planet last year, and is the No. 1 overall petroleum producer in the world. What these politicians and analysts don't seem to understand is that the American refining industry is all about efficiencies and optimizing your feedstock to run as profitably as possible given the configuration of your refinery.
So, Canada has a ready market for a large portion of its heavy crude production, and any leftover can potentially be exported from the U.S. Gulf Coast, as most all of it shown in the graphic above (in pink) was. However, U.S. refiners pretty much have all they want and need. So it's not a big growth market. For growth, the oil sands producers - including Cenovus - have put all their hopes in the Trans Mountain pipeline, which last I knew is scheduled to go online early next year with an extra 590,000 bpd of badly needed (and long overdue…) oil sands exit capacity (see The Trans Mountain Pipeline Will Benefit Cenovus ).
Meantime, Cenovus' best asset might well be the WRB 50-50 refining joint venture it has with Phillips 66. "WRB" stands for Wood River/Borger, two refineries that are owned and operated by Phillips 66. The distributions from this partnership are likely what kept Cenovus out of bankruptcy back when the oil sands glut in western Canada had the CEO - the one they hired after the one they fired (for making the big oil sands acquisition from ConocoPhillips ( COP )…) - running to the government for production cut mandates. In retrospect, it's quite humorous to consider what a novel idea that was: A CEO of a North American energy company asking the government for a production cut mandate. Regardless, the point is - as I have been saying on Seeking Alpha for years - the best way to play the oil sands is not through the oil sands producers: It's through the refiners:
Comparisons
From a big picture perspective, the slide below from Cenovus' July Presentation summarizes the company's assets:
Cenovus
As you can see from the graphic, Cenovus is very much an oil sands centric producer (76% of production) and has upgrading (i.e., to WCS) and refining capacity that's roughly in line with its production (248,000 bpd with WRB alone). The company has a very large oil sands 3P asset base (i.e., bitumen) with a reserves' life of three-plus decades.
Chevron, on the other hand, has a global asset base that's much more diversified and includes excellent exposure to the Permian Basin, the Gulf of Mexico, the global LNG markets via Australia (Gorgon and Wheatstone) and Angola, a growing and impressive footprint in the Eastern Mediterranean natural gas market, and Tengiz . In Q3 Chevron pumped 772,000 bpd from the Permian Basin alone. That was up 11% year-over-year and was almost as much as Cenovus' total production. Chevron plans to ramp Permian production to over 1 million bpd by 2025 and keep it there for at least a decade.
Chevron also has 1.7 million bbls of refining capacity (primarily in the U.S. and Asia) and a strong presence in the global chemicals market via its 50-50 joint venture with Phillips 66, which is called CPChem, i.e., the Chevron Phillips Chemical Company.
It's All About Free Cash Flow
The following chart summarizes the free-cash-flow profiles of the two companies over the first six months of 2023:
| Free-cash-Flow |
| Revenue |
| FCF Yield |
| Chevron |
| $6.7 billion |
| $99.7 billion |
| 6.7% |
| Cenovus |
| $1.19 billion |
| $24.5 billion |
| 4.9% |
Clearly this is a short-term comparison, and free cash flow can be greatly impacted by a variety of factors from quarter to quarter. However, in general, what you see above is a major reason why Chevron has greatly outperformed Cenovus over the past decade: It's a much more efficient and profitable company with, in my opinion, a superior asset base.
And this is why Chevron has delivered much better dividend growth as well. The chart below shows the 10-year track record of Chevron vs. Cenovus:
| Quarterly dividend 2013 |
| Quarterly Dividend Q2 2022 |
| Current Yield |
| Chevron |
| $1.00 |
| $1.51 |
| 3.8% |
| Cenovus |
| $0.24 |
| $0.14 |
| 1.8% |
As you can see in the chart, Chevron's quarterly grew by ~50% over the past decade to the current $6.04/share on an annual basis. On the other hand, Cenovus' quarterly dividend actually declined by 41% over the past 10 years and the current payout is only $0.56/share annually. Indeed, during 2020, Cenovus suspended its dividend completely (i.e., $0.00) for three quarters in a row.
Risks
From a debt perspective, to my knowledge no leading O&G company has a better balance sheet than Chevron (if you think one does, please let me know). CVX ended Q2 with $9.6 billion in cash, long-term debt of $20.2 billion , and a net debt to equity ratio of only 7%.
Cenovus had $1.6 billion in cash at the end of Q2 and long-term debt of $6.4 billion . With a recent ratings upgrade, Cenovus is rated BBB by Fitch. Chevron has an AA- rating by S&P Global .
Being an oil sands producer that is still dependent on the U.S. export market, and the fact that Cenovus is competing with other big oil sands producers (i.e., Suncor (Suncor Energy Inc. ( SU ), Imperial Oil ( IMO ), Canadian Natural Resources ( CNQ ), etc.) for pipeline exit capacity to reach that market, the discount of WCS (Western Canadian Select) to WTI is important. And, as we have seen in the past, the WCS-to-WTI discount can swing wildly. Indeed, sometimes the price of WCS can reach near $0 during gluts:
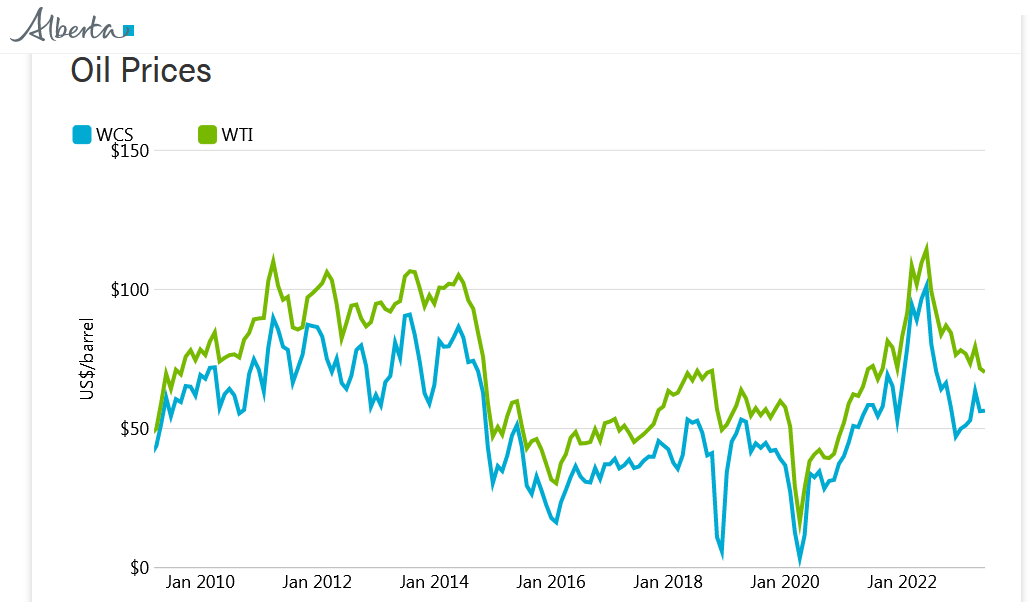
Currently, the discount is ~ $17/bbl (WTI=$79.20/bbl, WCS=$62.14/bbl). As they say, "all barrels are not created equal."
Lastly, what would you rather own in the era of ESG and global warming: Oil sands assets like Cenovus, or a company like Chevron that produces a ton of light-sweet crude and cleaner burning (natural gas) LNG?
Summary and Conclusion
Chevron has a superior and diversified global asset production portfolio as compared to Cenovus, which is still a primarily and oil sands producer. That said, Cenovus has expanded its refining capacity which today roughly equals its total production. Still, Chevron is a much more efficient company with a higher free cash flow yield and a much better long-term track record of delivering dividend growth. That being the case, any investor thinking of buying Cenovus stock should consider buying Chevron instead. And any investor that holds Cenovus in a qualified retirement account (i.e., won't face any tax-selling consequences) should sell CVE and put the proceeds into Chevron.
I'll end with a 10-year total returns chart of the major oil sands producers as compared to some major shale oil producers and the S&P 500. As you can see, Cenovus - along with peer Suncor - is at the very bottom. Shale oil producers like EOG, COP, and CVX significantly outperformed the oil sands producers:
For further details see:
Chevron Is Better Than Cenovus