MSFT - Choosing Between SCHG And SCHX For A Low-Growth Environment
Summary
- It is important to choose the right ETF for the current low-growth environment where there are also talks about a recession.
- For this purpose, I compare two of Schwab's ETFs, namely SCHG and SCHX.
- In this case, SCHX has better sector exposure and is also less concentrated in information technology, or IT.
- Its higher dividend yield can also compensate to some extent for volatility when considering total returns over a relatively long period of time.
- I start by analyzing the price action which is indicative of market sentiment.
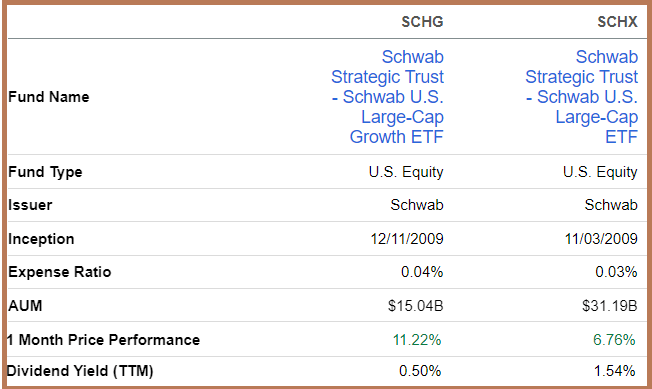
As its very name suggests, the Schwab U.S. Large-Cap Growth ETF ( SCHG ) holds some of the largest publicly listed and rapidly growing companies. As for the Schwab U.S. large-cap ETF ( SCHX ), it does not necessarily focus on growth, but more on owning large corporations operating across more diverse sectors of the economy as this thesis will eventually detail.
Moreover, as evidenced by SCHX’s outperformance of SCHG, the market seems to be favoring its combination of stocks as of mid-August last year, or roughly two weeks before the U.S. central bank hiked interest rates by 75 basis points.
Then, in line with the above chart, the objective of this thesis is to show that investors who are trusting SCHX are right as it is more relevant to investing in the current low-growth economic environment where recessionary risks are also present after the Federal Reserve tightened monetary policy at a pace not seen since the 1980s.
I start by providing insights on SCHG's holdings.
SCHG's Holdings and Sector Exposure
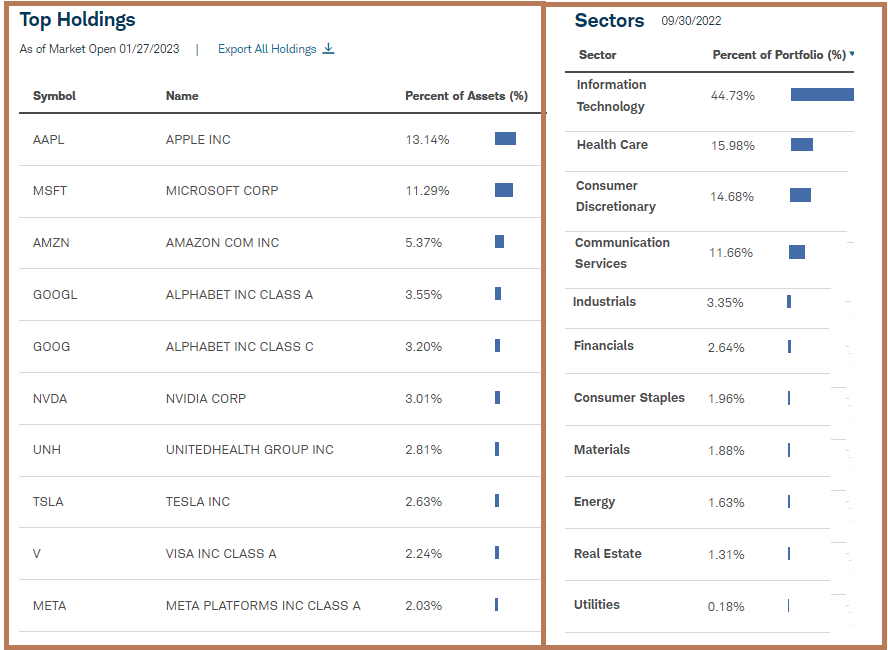
First, the list of top holdings shows that these are companies with large market capitalizations. As such, it is more difficult for them to grow organic revenues at the same pace as small-cap stocks, especially in the current economic cycle characterized by tighter monetary policy. As for growing inorganically, as evidenced by Microsoft's ( MSFT ) bid for video game producer Activision Blizzard ( ATVI ), antitrust regulators are making sure that the competitive scenario does not get disrupted by big sharks getting bigger, all at the expense of smaller market players.
SCHG's products (www.schwabassetmanagement.com)
In this case, despite the change in the calendar year, the difficulties encountered in 2022 are not yet over for big tech, which by the way refers to mega-caps like Apple ( AAPL ), Microsoft, Amazon ( AMZN ), Alphabet ( GOOG ) (GOOGL) and Meta Platforms ( META ).
Now, since the Fed fund rates are still at 40-year highs, the volatility that impacted tech in 2022 looks to continue well into 2023, with one of the reasons being their higher valuations. Morningstar shows a price-to-earnings multiple of 22.2x for SCHG, or more than 30% higher than the S&P 500's 16.92x .
One of the reasons which explain this overvaluation is that, at 44.73%, information technology comprises a substantial part of SCHG’s assets and was largely responsible for the ETF’s performance of over 28% in the last three years as the digital transformation secular trend got a boost from work-from-homers. The ETF’s price performance was also supported by healthcare, which forms 15.98% of its total weight, as Covid abruptly raised awareness about the importance of vaccination, antibiotics, and painkillers in the fight against the virus.
However, with Covid more in distant memory, things have evolved and there are questions as to whether these high valuations can be sustained. Detailing further, growth stocks rely on cheap money and a conducive business environment to rapidly increase revenues, which then trickle down the income statement into higher earnings growth. As a result, investors reward them with a high price-to-earnings multiple.
However, with slow growth and even recessionary risks, things are likely to be different and analysts have cut their total revenue projections for the five largest US tech companies, namely Meta, Amazon, Apple, Alphabet, and Microsoft, by 5% for the first three quarters of 2023. Also, the fact that most of these companies have announced large job cuts as a percentage of their total workforce indeed points to sluggishness in growth.
SCHG Vs SCHX for a Low-Growth Environment
In these conditions, it would seem awkward that it is SCHG that has delivered a better one-month price performance of 11.22% against only 6.76% for SCHX as pictured below. Well, the reason seems to be expectations that the Fed will be much less aggressive as to the pace at which it is raising rates, after the U.S central bank's favorite measure for core inflation, increased by 4.4% from a year ago, or its smallest annual increase since 14 months.
Comparing SCHG and SCHX (seekingalpha.com)
However, investors do not seem to be paying attention to the fact that consumer spending has dropped by 0.2% , augmenting the chances of the economy heading into a recession. This recession thesis is also highlighted by Goldman Sachs ( GS ), but the investment bank also adds there is a glimmer of hope of a protracted slowdown being avoided.
In these circumstances when the economic outlook remains uncertain, with its lower price to earnings of 16.90x , or slightly lower than the broader market, SCHX represents a more measured approach to investing in the large caps.
SCHX's Holdings and Sector Exposure
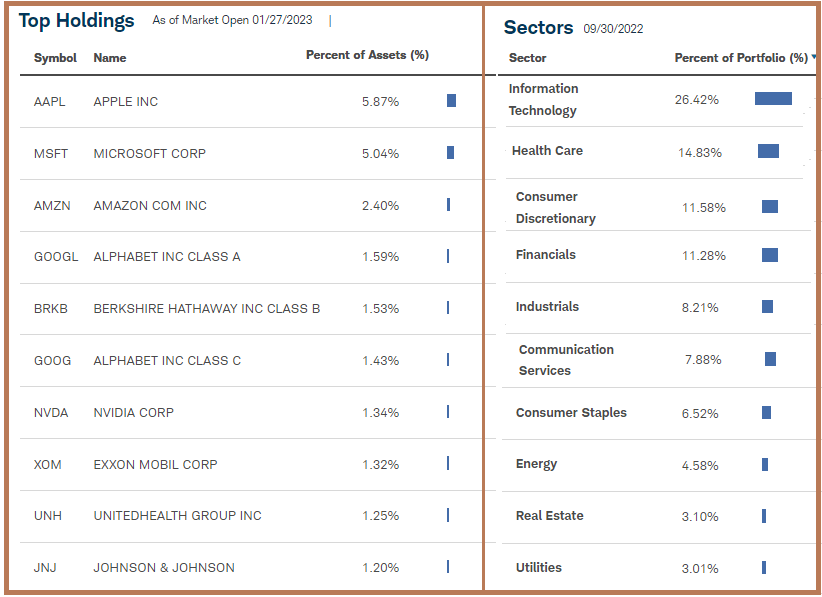
Noteworthily, a quick glance at SCHX's top holdings again reveals names like Apple and Microsoft, but a deeper look, especially at the fifth and eighth positions provides a different perspective with financial and energy names respectively. The difference is confirmed by the sector-level asset allocation in the table below, with tech constituting just 26.4% of the fund's assets, compared to 20% more for the ETF's high-growth peer.
SCHX Holdings (www.schwabassetmanagement.com)
Furthermore, with healthcare, consumer discretionary, and financials at 14.83%, 11.58%, and 11.28% respectively, this is a more balanced ETF. Also, financials include Berkshire Hathaway Inc. Class B. ( BRK.B ) whose CEO is Warren Buffett, a guru for value investors.
Equally important, for those looking towards income, SCHX offers three times the dividend yields as its peers as shown in the above table. This is certainly far from the 3%-5% available for certain investment grade bond ETFs, but again, fixed income which has been battered in 2022 as shown by the lackluster performance of the Vanguard Total Bond Market ETF ( BND ), is still looking for a break, as, despite some favorable inflation-related data, there is no certainty that the Fed will suddenly turn dovish in its fight to crush inflation.
Therefore, with corporations across the board making tough choices amid high borrowing costs, an investment in steadily growing large caps that are relatively more resistant to economic shocks makes sense in the current low-growth environment. Interestingly, the ETF's 5% exposure to energy names needs to be highlighted, as, in the context of the China Covid reopening, demand for oil and gas is likely to stay high.
Discussion around Volatility and Conclusion
Consequently, SCHX is much less concentrated in IT, which conversely allows it to have a more diversified sector exposure. Its lower IT weighting is also positive in light of Gartner having downgraded the expected growth of IT spending to 2.4% for 2023 in January from 5.1% three months earlier.
Now, some can argue that 2.4% still represents growth amid the secular digital transformation trend which would make SCHG still a viable choice. However, another issue faced by the ETF stems from its higher exposure to Consumer Discretionary at 14.68% compared to 11.58% for its peer, which would confer to it higher volatility risks in case there is a further deterioration in consumer spending.
To be realistic and as seen by the one-year downtrend for both ETFs, volatility is still reigning, but, one way in which SCHX can compensate for market turbulence is through its quarterly dividend payments as shown in the three-year performance charts below. In this case, as shown by the blue chart, despite its share price having underperformed SCHG by 3.64% (26.57-22.93), it has actually outperformed in terms of total returns by 0.48% (29.15-28.67). For investors, total returns measure the performance when the dividends are reinvested instead of being cashed out.
Finally, by comparing it with SCHG, this thesis has made the case for investment in SCHX for an economic environment different from what it was like prior to mid-2022 as the era of cheap money has come to an end, and investors now have to get used to low growth. Given that at $48, the ETF is still $7 below its peak of $55, I think its share price could easily climb back to the $50 level in the first quarter of this year as the Fed continues on its hawkish path.
For further details see:
Choosing Between SCHG And SCHX For A Low-Growth Environment