CA - Coeur Mining: Waiting Patiently For Rochester Completion
Summary
- Coeur Mining's quarterly revenue was $182.99 million, representing a decrease of 12% year-over-year. Net loss was $57.44 million or $0.21 per diluted share.
- Total production was 83,438 Au ounces and 2,358 K Ag ounces. The company maintained its 2022 guidance.
- I recommend accumulating CDE between $3.30 and $3.20 with possible lower support at $2.75.
Part I - Introduction
Chicago-based Coeur Mining (NYSE: CDE ) released its third-quarter 2022 results on November 9, 2022.
Note: I have followed CDE quarterly since April 2019. This new article is a quarterly update of my article published on August 20, 2022.
1 - 3Q22 results snapshot
Coeur Mining's quarterly revenue was $182.99 million, representing a decrease of 12% year-over-year. Gold and silver sales represented 76.1% and 23.9% of quarterly revenue. Net loss was $57.44 million or $0.21 per diluted share, compared to a loss of $54.77 million or $0.21 per share last year.
Gold Production increased at Kensington, Wharf, and Rochester this quarter. Total production was 83,438 Au ounces and 2,358 K Ag ounces. The company maintained its 2022 guidance.
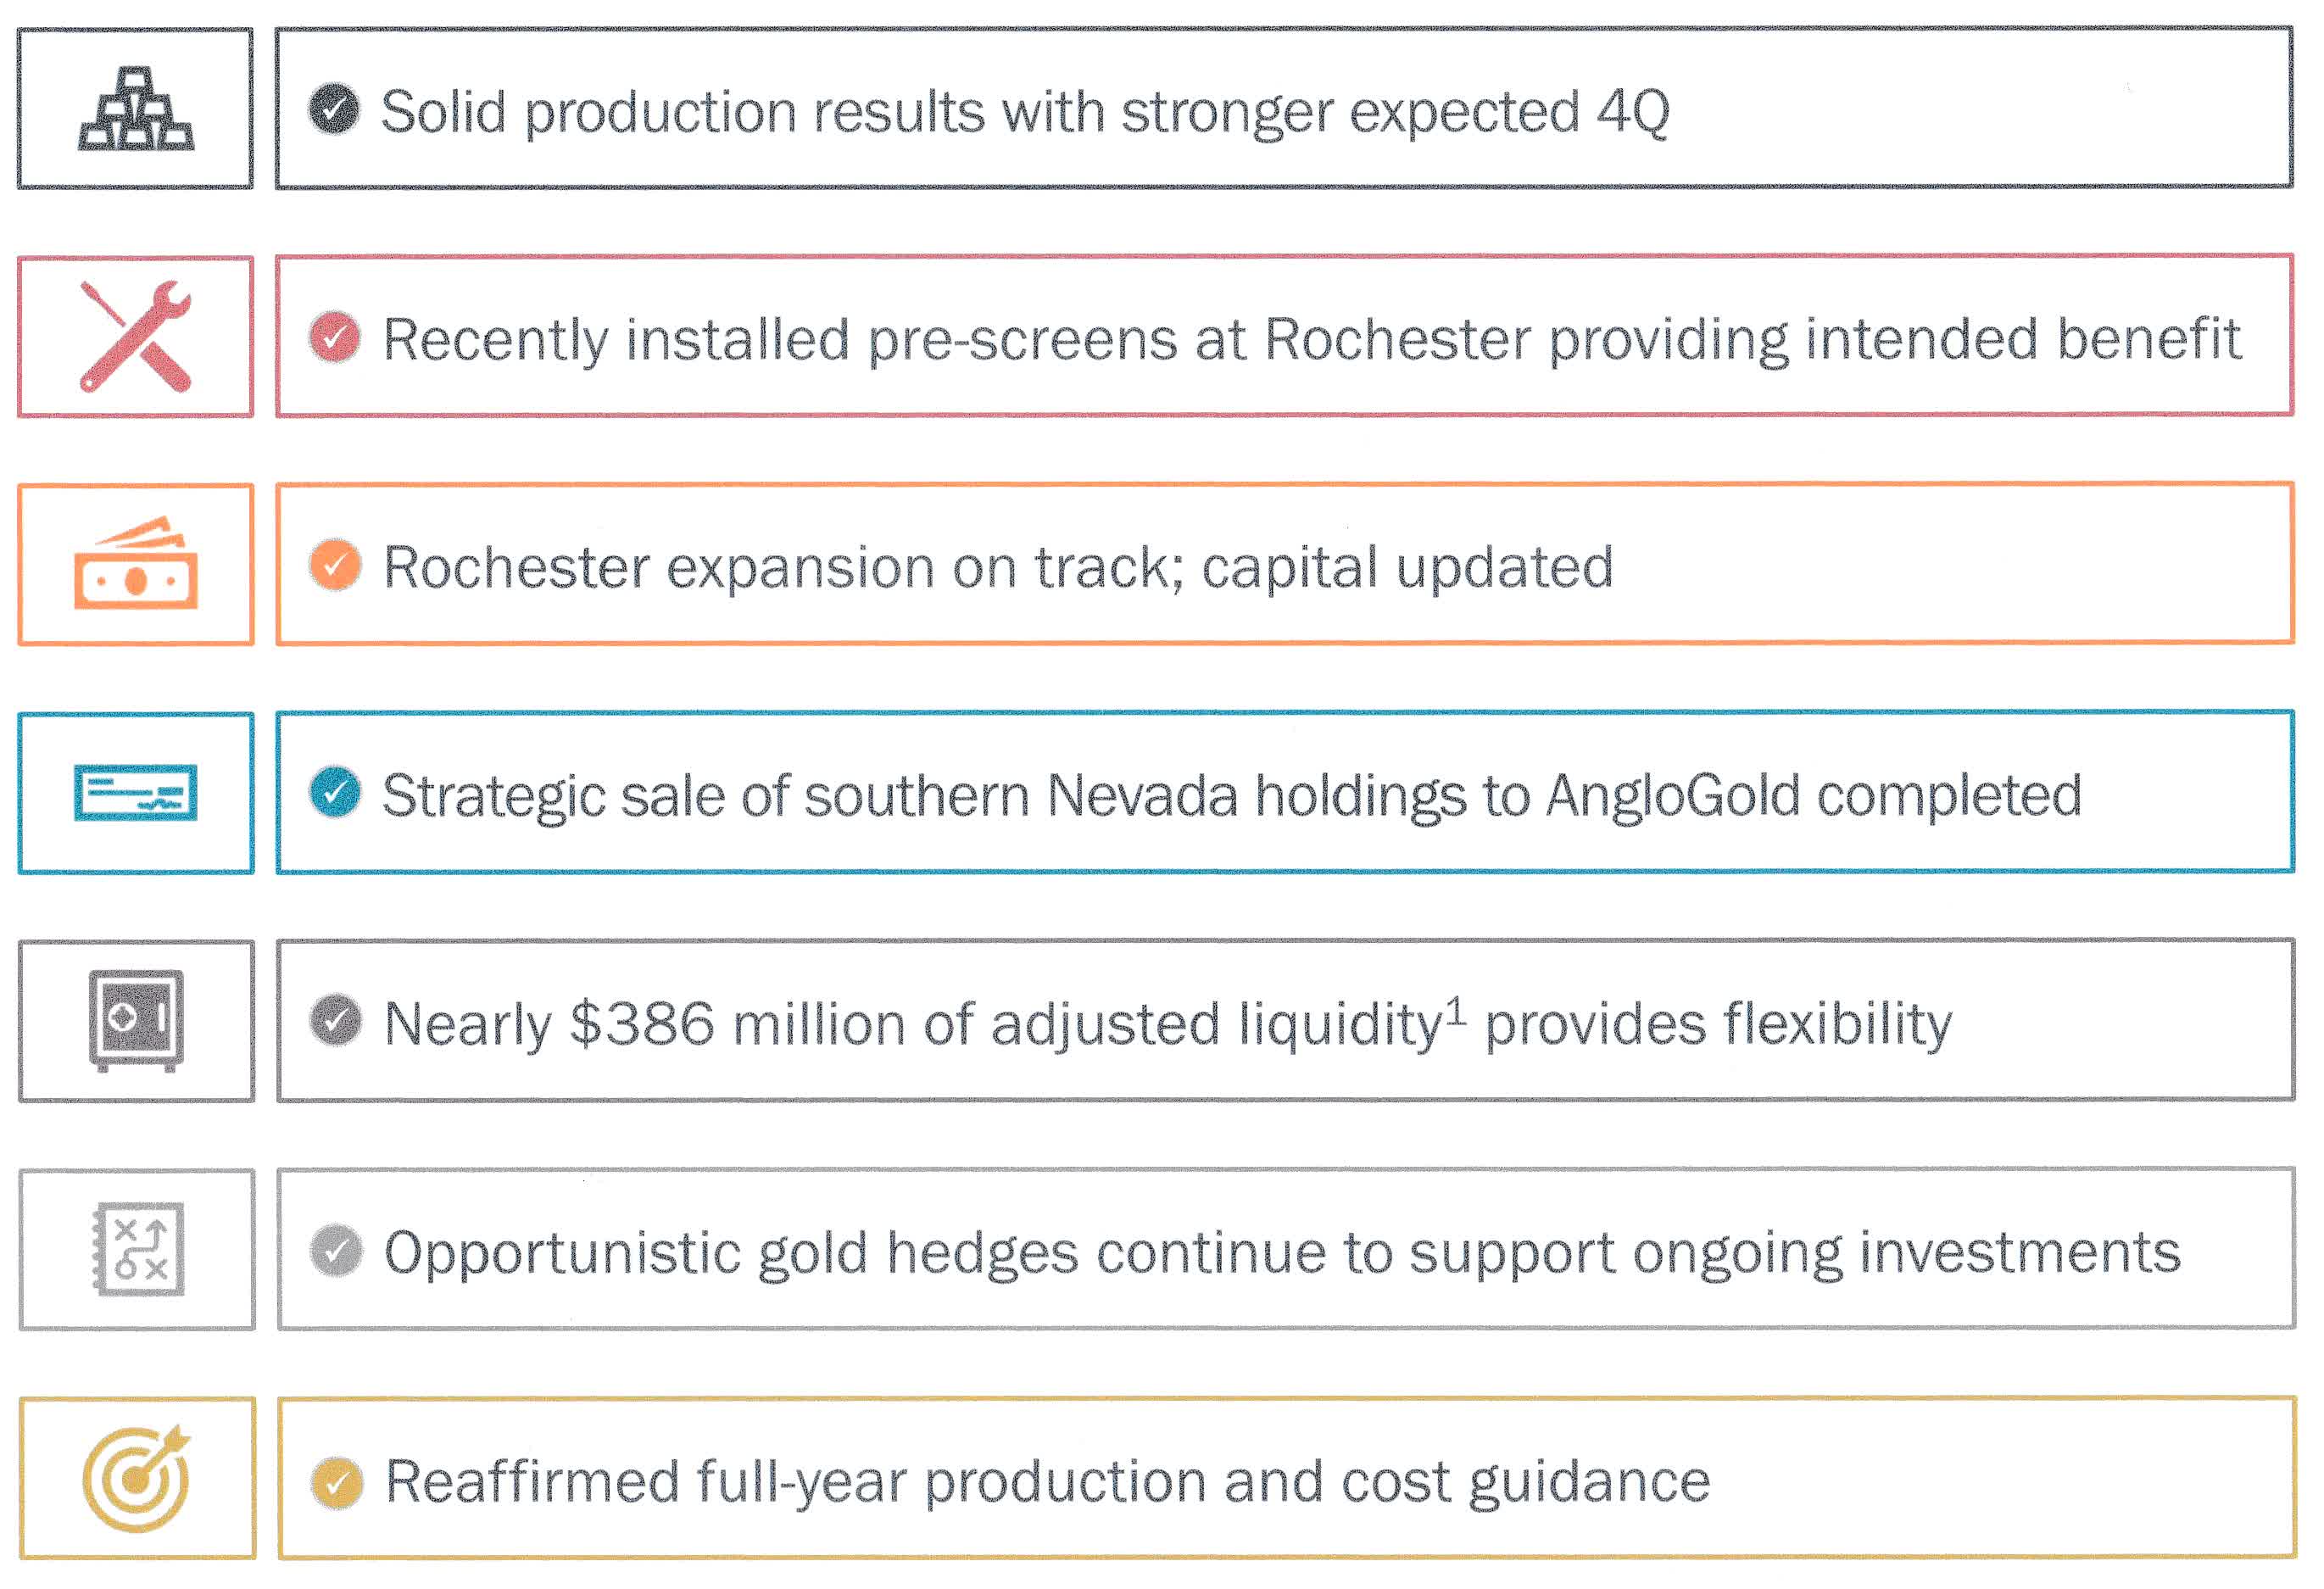
Below indicated are the 3Q22 highlights from the company's presentation:
CDE 3Q22 highlights (CDE Presentation)
CEO Mitch Krebs said in the conference call:
third quarter production results were in line driven by quarter-over-quarter production growth at Rochester, Kensington and Wharf. While cash flow in the quarter was negatively impacted by lower prices, higher consumable costs and lower grades at Palmarejo along with a $21 million noncash inventory adjustment at Rochester.
2 - Stock Performance
CDE sank dramatically on a one-year basis and has underperformed the iShares Silver Trust ETF ( SLV ) and the VanEck Vectors Gold Miners ETF ( GDX ), and even Pan American Silver ( PAAS ), and Fortuna Silver Mines ( FSM ). It has been the worst performer in my gold and silver miners in my portfolio. The stock is down 35%.
3 - Gold And Silver Production In 3Q22
Strong performances at Rochester, Kensington, and Wharf mines this quarter.
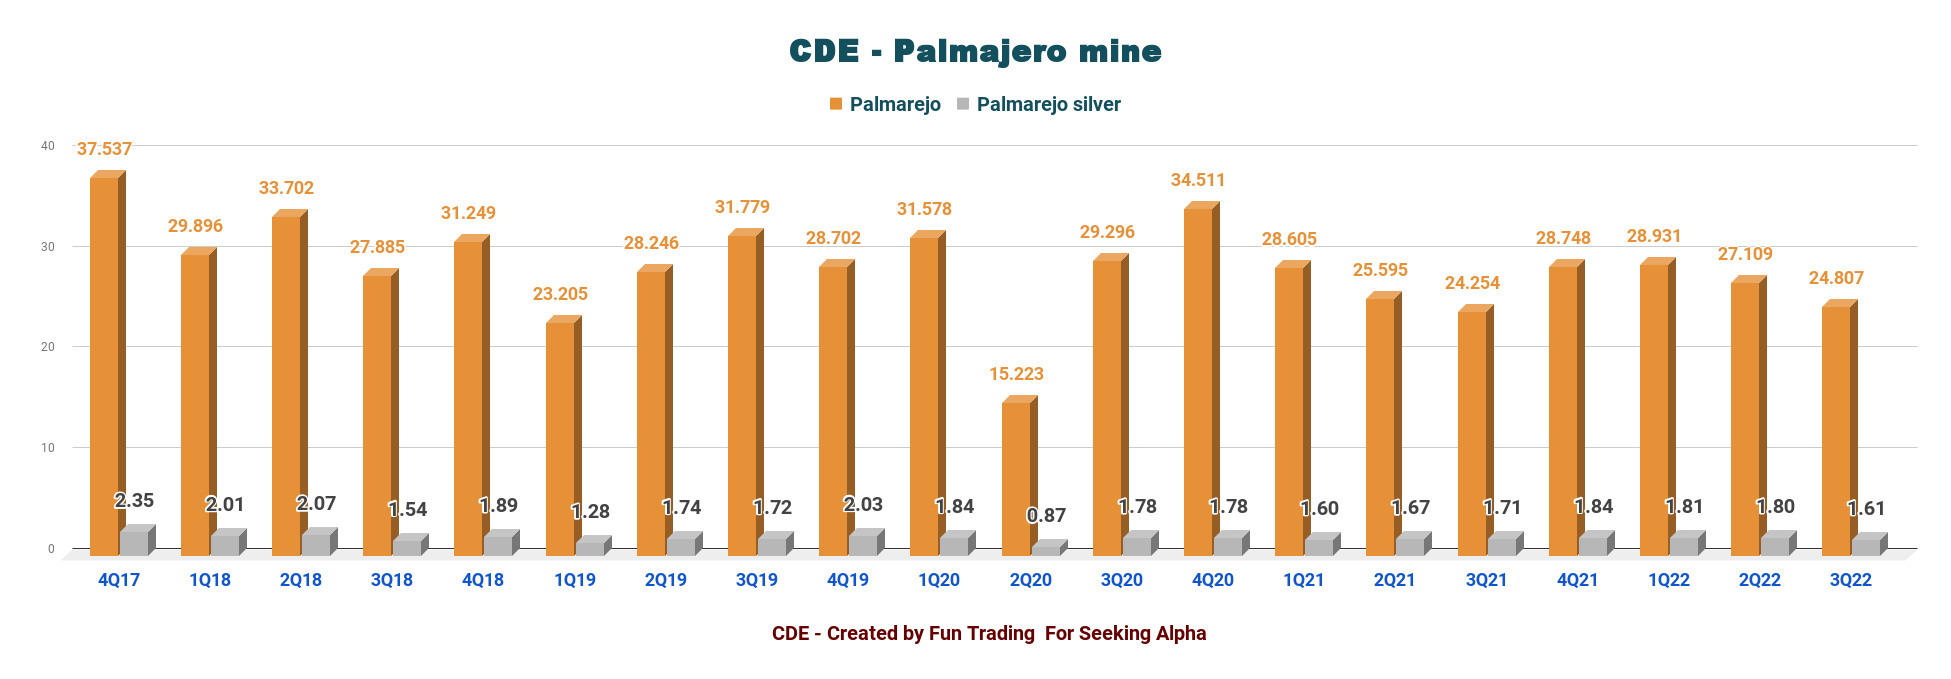
3.1 - Palmarejo mine. Solid quarter.
CDE Palmarejo Production history (Fun Trading)
Production in 3Q22 was impacted by lower gold and silver grades, partially offset by higher average gold and silver recoveries. Higher recoveries in the quarter reflect recent enhancements in the flotation and solution management processes.
3.2 - Kensington mine. A better production this quarter.
CDE Kensington Gold production (Fun Trading)
Higher production in 3Q22 was driven by a slightly higher average gold grade, partially offset by lower average gold recoveries.
3.3 Rochester mine. Good performance.
CDE Rochester gold and silver production history (Fun Trading)
Coeur Mining achieved several critical milestones at the Rochester expansion this quarter.
- Completion of significant concrete work in all areas except the primary crusher pocket and the pre-screens, both of which are in progress,
- Continuation of structural, mechanical, piping, electrical, and instrumentation construction work throughout the project,
- Commencement of final major high-voltage electrical distribution and substation construction,
- Completion of the majority of commitments for the pre-screens.
A $132 million CapEx budget remains to be spent before ramp-up and commissioning anticipated in H2 2023. The expansion is advancing on schedule, with overall completion now at 61%.
3.4 - Coeur Mining metal production
Gold and silver sales were 76.1% and 23.9% of quarterly revenue. Coeur Mining produced 83,438 Au ounces of gold (but sold 81,782 Au Oz) and 2.358 million Ag ounces (sold 2.3 Ag Moz) during the third quarter.
CDE Quarterly Gold and silver production history (Fun Trading)
Average realized gold and silver prices for the quarter were $1,702 and $19.09 per ounce, respectively, compared to $1,645 and $24.18 per ounce in the prior year period.
CDE Quarterly Gold and silver price history (Fun Trading)
Below is the production per mine:
CDE Quarterly production gold and silver per mine 3Q22 (Fun Trading)
COO Mick Routledge said in the conference call:
Wrapping up with Wharf, a 6% production increase quarter-over-quarter was driven primarily by recovery timing of higher grade ore placed in the previous period. Wharf remains on track to finish the year around the top of its 2022 production guidance range.
Part II - Coeur Mining: Financials in 3Q22 - The Raw Numbers
| Coeur Mining |
| 3Q21 |
| 4Q21 |
| 1Q22 |
| 2Q22 |
| 3Q22 |
| Total Revenues in $ Million |
| 207.97 |
| 207.88 |
| 188.40 |
| 204.12 |
| 182.99 |
| Net income in $ Million |
| -54.77 |
| -10.76 |
| 7.68 |
| -77.43 |
| -57.44 |
| EBITDA $ Million |
| -14.58 |
| 27.91 |
| 39.96 |
| -33.29 |
| -21.01 |
| EPS diluted in $/share |
| -0.21 |
| -0.05 |
| 0.03 |
| -0.28 |
| -0.21 |
| Cash from operating activities in $ Million |
| 21.85 |
| 34.94 |
| -6.43 |
| 22.64 |
| -19.12 |
| Capital Expenditure in $ Million |
| 71.27 |
| 100.87 |
| 69.50 |
| 73.16 |
| 96.60 |
| Free Cash Flow in $ Million |
| -49.42 |
| -65.93 |
| -75.93 |
| -50.51 |
| -115.72 |
| Total cash $ Million |
| 85.02 |
| 56.66 |
| 73.33 |
| 161.70 |
| 111.64 |
| Total Debt (including lease obligation) In $ Million |
| 419.42 |
| 487.50 |
| 485.51 |
| 547.5 |
| 635.7 |
| Shares outstanding in Million |
| 254.7 |
| 257.15 |
| 263.56 |
| 278.04 |
| 278.11 |
Data Source: Company release
Analysis: Revenues, Free Cash Flow, Debt, And Production Details
1 - Revenues and trends - Revenues were $182.99 million in 3Q22
CDE Quarterly Revenues history (Fun Trading) Coeur Mining posted $182.99 million in revenues, with an EBITDA loss of $21.01 million and a cash flow loss from operating activities loss of $19.12 million. The adjusted net income was a loss of $44.16 million, or $0.16 per share. Another weak quarter.
The company reported a net loss of $57.44 million, or $0.21 per diluted share, compared with a loss of $0.21 per share a year ago.
Costs applicable to sales increased quarter-over-quarter to $163.2 million due to inflationary pressures on consumable costs. In the press release:
largely due to a $21 million LCM adjustment at Rochester. Coeur continues to experience inflationary pressures on consumable costs on a year-over-year basis, but these costs remained relatively flat compared to the previous quarter.
Note: On September 18, 2022, the Company sold to a subsidiary of AngloGold to sell its Crown and Sterling holdings for a closing cash consideration of $150 million. The transaction closed on November 4, 2022, and is not included as part of Coeur’s third-quarter results due to the closing timing.
Coeur Mining has agreed to sell its CROWN and Sterling subsidiary to a unit of AngloGold Ashanti for an upfront cash consideration of $150 million. The transaction also has a $50 million deferred cash consideration, which is payable upon Crown Sterling achieving at least 3.5 million gold ounces of the total resource.
2 - Free cash flow was a loss of $115.72 million in 3Q22
CDE Quarterly Free cash flow history (Fun Trading)
Note: Generic free cash flow is cash from operations minus CapEx
Coeur Mining's free cash flow for the third quarter of 2022 was a loss of $115.72 million, and the trailing 12-month free cash flow was a loss of $308.09 million.
The company's CapEx in 3Q22 was $96.6 million, and cash flow from operations was a loss of $19.12 million.
This recurring free cash flow loss since 1Q21 is quite concerning. However, The Rochester Expansion seems to be the main reason for the loss and should be resolved by H2 2023.
3 - Available capital, net debt, liquidity, and hedges
CDE Quarterly Cash versus Debt history (Fun Trading)
Total debt was $635.7 million, and net debt was $524.06 million. Cash, cash on hand, and marketable securities were down to $111.64 million. However, the sale of Crown and Sterling to AngloGold Ashanti (AU) for $150 million is not included.
Total potential Liquidity is now $492 million.
For financial ratios and Metal sales hedges, please see below:
CDE Balance sheet (CDE Presentation)
The only issue as a shareholder is that the company established a $50 million ATM program, a dilution potential.
CFO Tom Whelan said in the conference call:
We worked with our banks to complete an amendment to our revolving credit facility to provide additional balance sheet flexibility through to the end of 2023.
4 - 2022 outlook
In 2022 gold production is expected to be between 315K-353K oz, while silver production is between 9,000 to 11,000 Koz.
CDE 2022 Guidance (CDE Presentation)
Technical Analysis And Commentary
CDE TA Chart (Fun Trading StockCharts)
CDE forms an ascending channel pattern with resistance at $4.45 and support at $3.25. However, for frequent traders, I recommend trading the $3.85-$3.50, which could be considered an intermediate resistance here.
Ascending channel patterns are short-term bullish moving higher within an ascending channel, but these patterns often form within longer-term downtrends as continuation patterns.
The trading strategy is to sell about 40%-50% of your position LIFO and keep a core long-term position for a higher target back of around $5 to $6.
I suggest taking profits LIFO(about 40%-50%) between $4.25 and $4.45 and waiting patiently for a retracement below $3.25 to accumulate again. We are almost here now. As I said earlier, you may eventually take some profit off between $3.50 and $3.85, which could be the first resistance.
CDE Gold and Silver Comparison 1-year (Fun Trading StockCharts)
CDE is highly correlated to gold and silver prices which are fluctuating wildly now due to the Fed's action against rampant inflation.
Gold and mostly silver recovered from their recent lows, but it is difficult to know how prices will be affected by the next FED decision. Technically, I see a cup and handles pattern, which means gold and silver could go up in H1 2023.
Be cautious and watch the gold and silver prices like a hawk.
Warning: The TA chart must be updated frequently to be relevant. It is what I am doing in my stock tracker. The chart above has a possible validity of about a week. Remember, the TA chart is a tool only to help you adopt the right strategy. It is not a way to foresee the future. No one and nothing can.
Author's note: If you find value in this article and would like to encourage such continued efforts, please click the "Like" button below to vote for support. Thanks.
For further details see:
Coeur Mining: Waiting Patiently For Rochester Completion