VZ - Dividend Harvesting Portfolio Week 113: $11300 Allocated $939.05 In Projected Dividends
2023-05-04 09:00:00 ET
Summary
- The Dividend Harvesting Portfolio is now generating $939.05 in annual dividends, yielding 8.24%.
- The Dividend Harvesting portfolio has a 67.26% record of finishing the week in the black since its inception, 76/113 weeks.
- In week 113, I added to my positions in SLG, VNO, GSBD, ENB, and PTY.
The markets came alive this week as tech earnings pushed the S&P up 0.79% and the Nasdaq 1.17% higher. The battle between being in positive or negative territory on invested capital continues as the Dividend Harvesting Portfolio climbed back into the black. Apple ( AAPL ) is the last of big tech to report this week. If AAPL can keep the string of earnings beats alive and the Fed isn't too destructive on rates, and in the press conference, the markets may continue higher this summer.
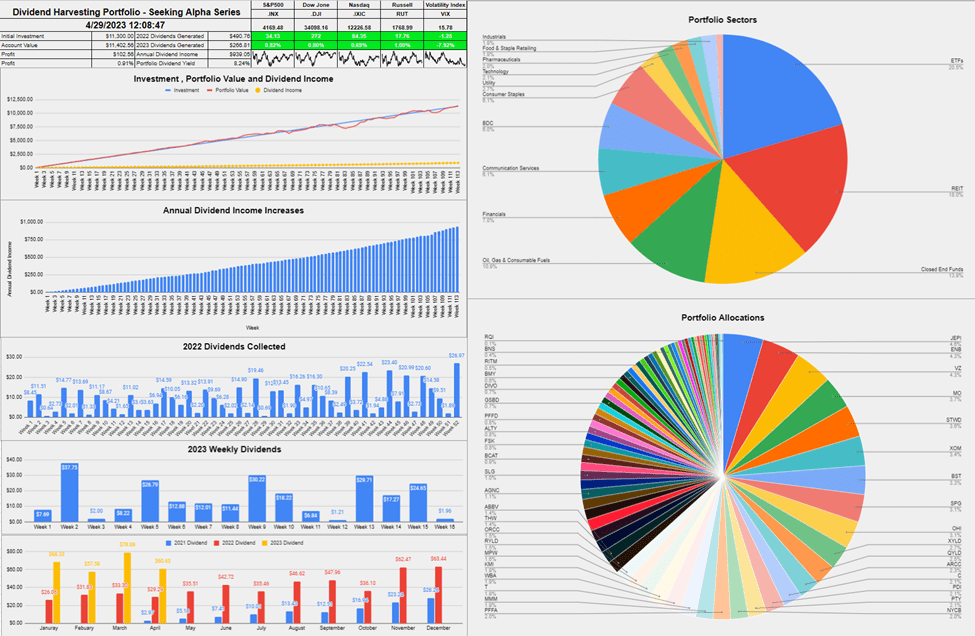
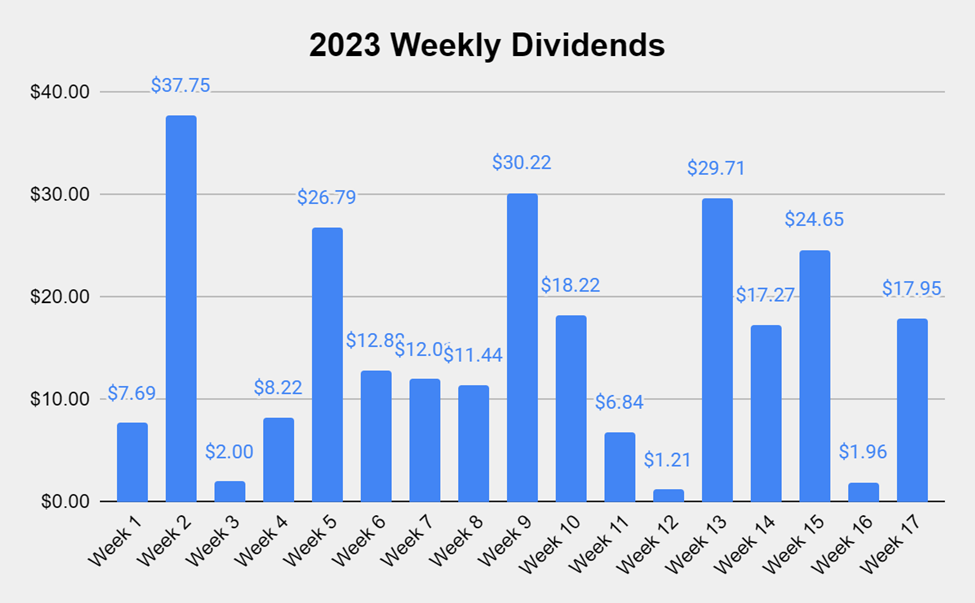
After 113 weeks and $11,300 allocated, the balance of the Dividend Harvesting Portfolio is $11,404.28. The account is up $104.28 or 0.92% on invested capital. In the fourth week of April, I collected $17.95 in dividend income, bringing 2023's total dividend income generated to $266.81. In week 113, I dollar cost averaged into SL Green Realty ( SLG ), Enbridge ( ENB ), Vornado Realty ( VNO ), Goldman Sachs BDC ( GSBD ), and the PIMCO Corporate & Income Opportunity Fund ( PTY ). At the end of week 113, my projected annual dividend income increased by $12.20 or 1.32% to $939.05, which is a forward yield of 8.24%.
I allocate capital toward big tech, funds, dividends, and growth outside of my retirement accounts. These are not my only investments, but I did open a separate account, so I could easily track and document this series. I intentionally created broad diversification throughout the Dividend Harvesting portfolio so I could benefit from sector rotations and mitigate my downside risk. Investors who are too exposed to growth companies or large-cap tech have gotten crushed as the investment landscape changes. On the growth and tech side of my investments, I'm feeling the pain as some of my favorite companies, including Alphabet ( GOOG , GOOGL ), Amazon ( AMZN ), and Meta Platforms ( META ), have been taken to the woodshed.
I'm going to address a question that continues to surface. I'm not trying to beat the market with this portfolio. I love index funds and am invested in several index funds. I love dividend investing due to the stream of cash flow it generates. I don't want 100% of my assets outside of real estate tied to an S&P index fund. I have created a personal investment strategy that works to achieve my investment goals, and having a stream of income generated from dividends is part of my investment strategy. Low-cost index funds are one of the best investments anyone can make in my opinion, and the Dividend Harvesting portfolio is not meant to be a substitute for an index fund. I have read many questions about dividend investing and wanted to start a portfolio from the ground up and document its progress to disprove many misconceptions, including that you need a large amount of seed capital to make dividend investing work for you.
This series has never been about hitting a target yield, generating a certain amount of profit, or beating the market. I had two specific goals with this series. The first was to create a blueprint for constructing a dividend portfolio by documenting the journey starting from the beginning. The second goal was to illustrate how allocating capital each week toward investing, regardless of the amount, would be beneficial in the long run.
Too many people are under the illusion that you need tens of thousands or even hundreds of thousands to benefit from investing. Instead of using my real dividend portfolio as an example, I decided to start a new account, fund it with $100, and add $100 weekly, providing a step-by-step guide to dividend investing. This methodology doesn't have to be used for dividend investing, and it could be as simple as an S&P index fund or a Total Market fund. Hopefully, this series is inspiring people to invest in their future to attain financial freedom.
A historical recap of the Dividend Harvesting Portfolio's investment principles
Investment Objectives
- Income generation
- Downside mitigation through diversification
- Capital appreciation
Below are the fundamental rules I have put in place for this Portfolio:
- Allocate $100 weekly to this Portfolio
- Only invest in dividend-producing investments
- No position can exceed 5% of the Portfolio
- No sector can exceed 20% of the Portfolio
- All dividends and distributions are to be reinvested
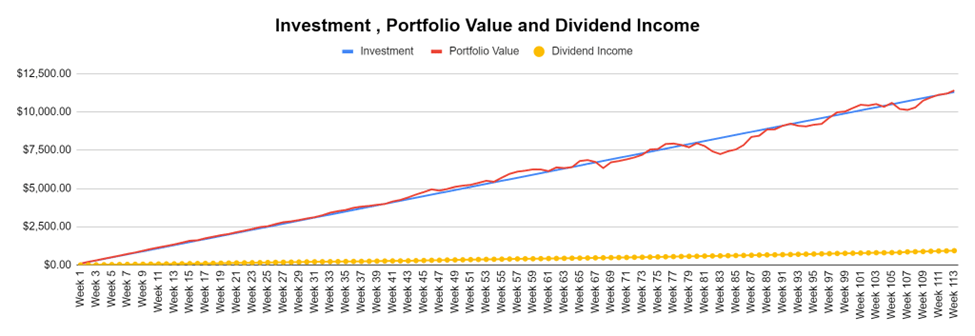
Below is a chart that extends from week 1 through the current week to illustrate the Dividend Harvesting Portfolio's Progression
- Blue line is my initial investment $100 in week 1, $1,000 in week 10, etc.
- Red line is the account value at the end of each week
- Yellow line is the annual dividend income the Dividend Harvesting Portfolio was projected to generate after that week's investments and dividends reinvested
The Dividend Harvesting Portfolio dividend section
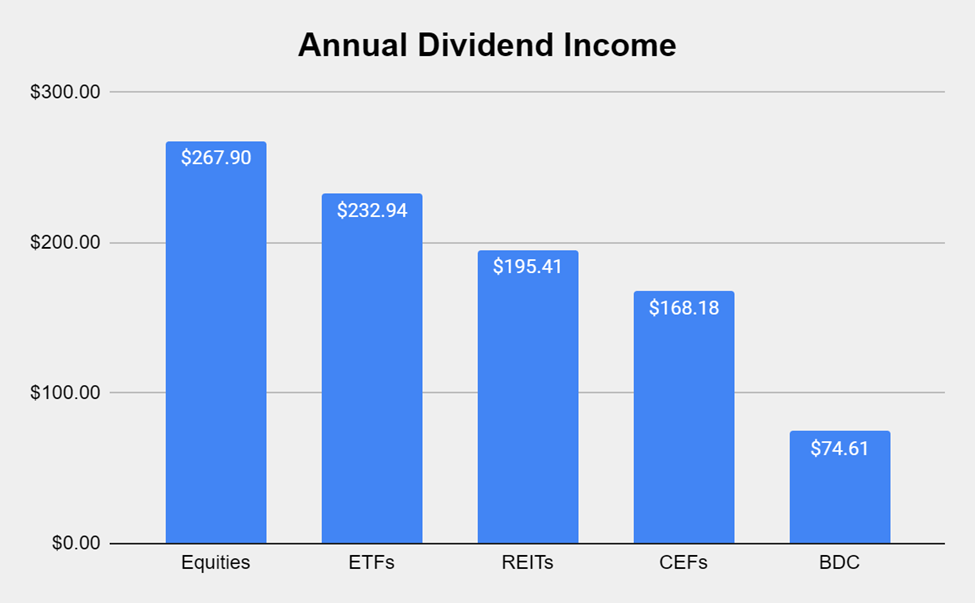
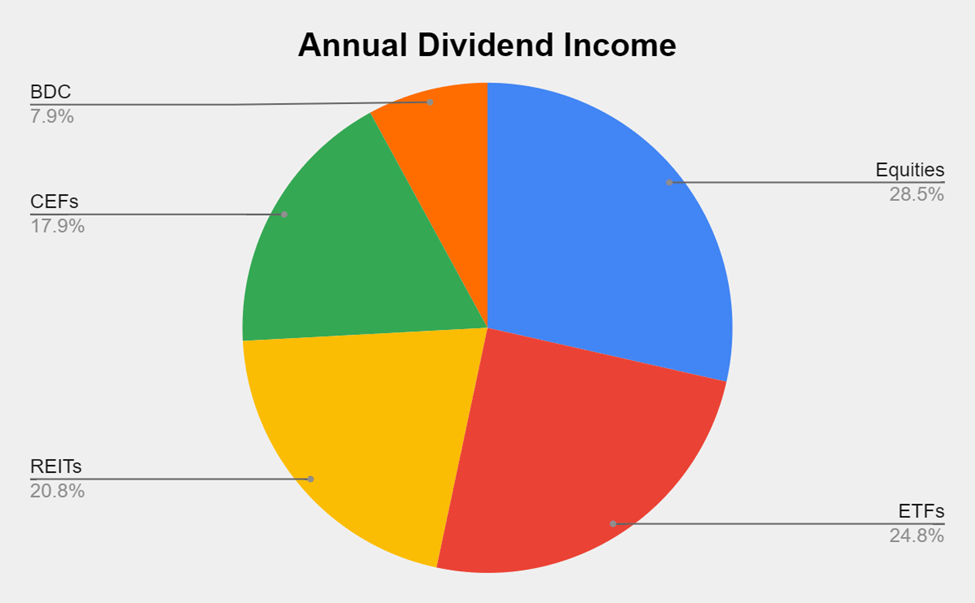
Here's how much dividend income is generated per investment basket:
- Equities $267.90 (28.53%)
- ETFs $232.94 (24.81%)
- REITs $195.41 (20.81%)
- CEFs $168.18 (17.91%)
- BDCs $74.61 (7.95%)
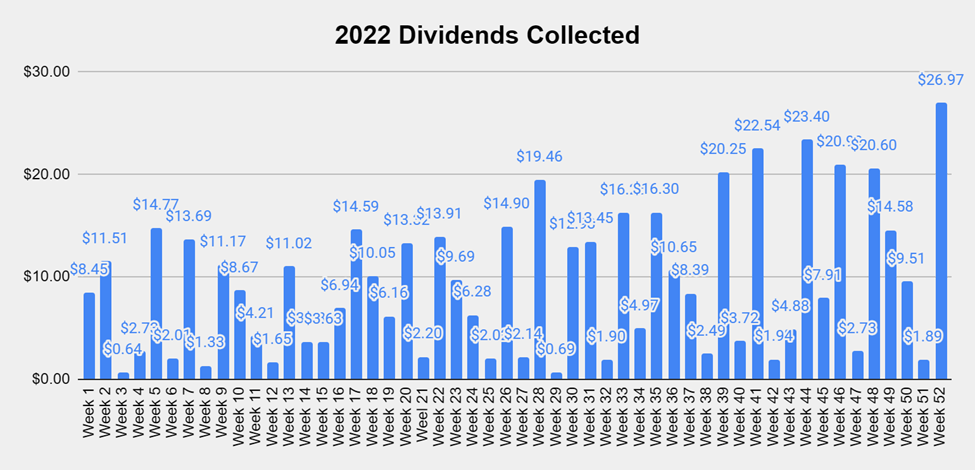
Collecting dividends can serve many functions in a portfolio. Some investors utilize dividends to supplement their income and live off of them. I'm building a dividend portfolio for myself 30 years into the future. In 2022, I collected $490.76 in dividend income from 533 dividends. In week 17 of 2023, I collected $17.95 in dividends, and in 2023 I've generated $266.81 in dividend income. YTD I have generated 54.37% of my 2022 dividend income from 210 dividends which is 39.40% of the dividends generated throughout 2022.
These dividends allow me to gain additional equity in my investments while increasing my future cash flow in down markets. This style of investing isn't for everyone, but if you're looking to generate consistent cash flow while mitigating downside risk, this method has worked for me. I'm hoping to collect around $1,000 in dividends in 2023, which will be reinvested.
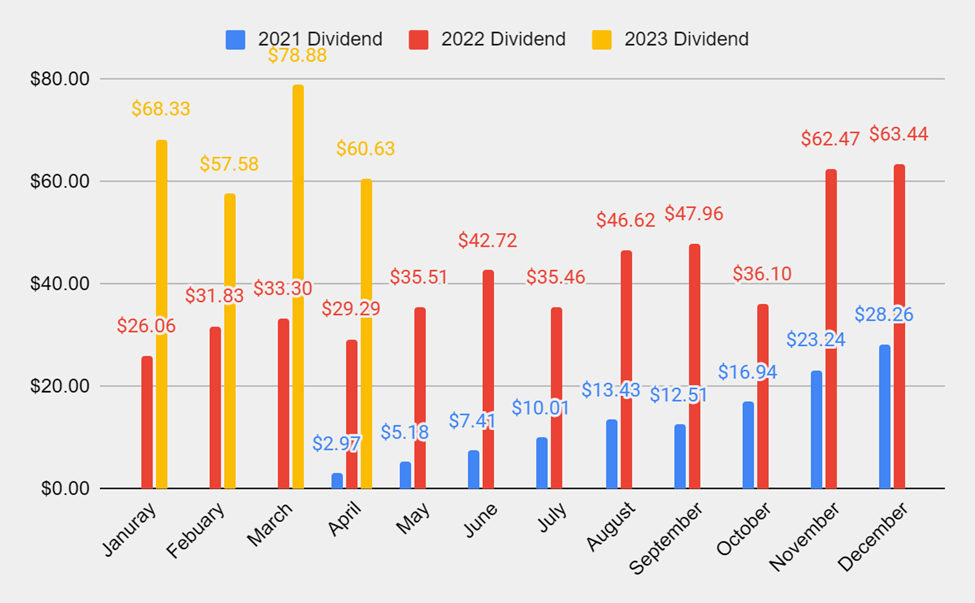
April is over and there is another month of data in my YoY comparison. My YoY stats are very encouraging as my dividend income in the month of April has increased by $26.32 (886.2%) YoY in 2022, then by another 107% YoY in 2023. From a dollar perspective, my April dividend income grew by $26.32 in 2022 and another $31.34 in 2023. At this rate April's dividend income in 2024 should be in the $90-$100 range.
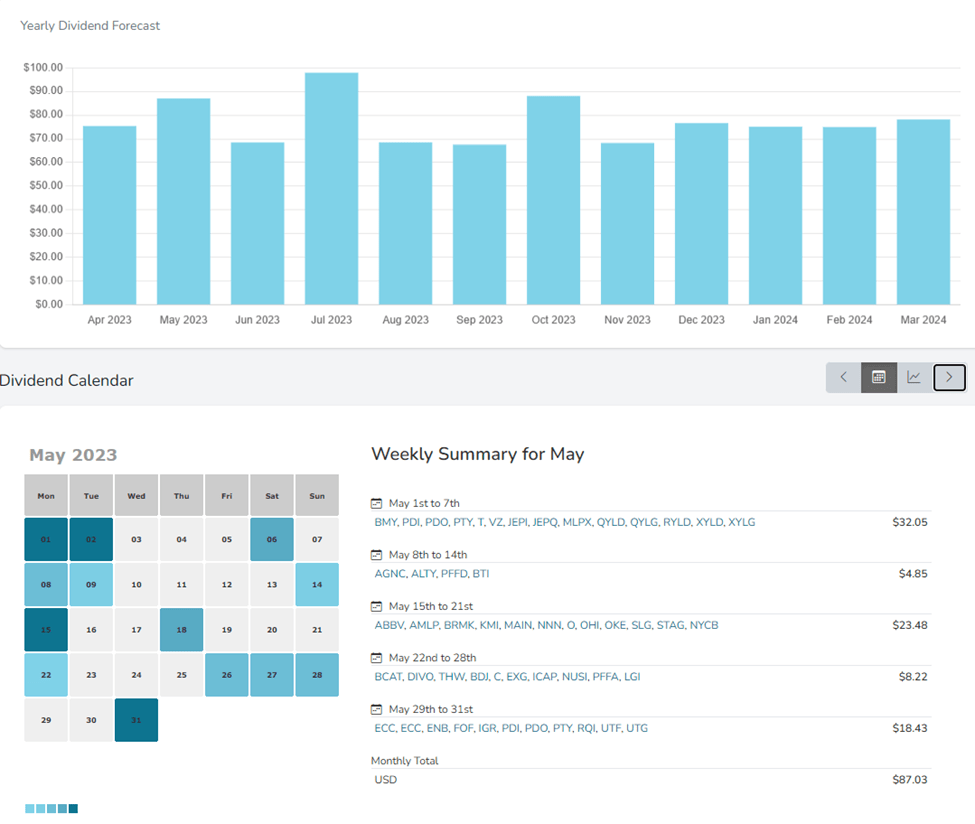
I found a tool that can track and visualize my monthly and weekly dividend income. I plan on showing this graph rather than the full year as it's a better visualization than what I had created. In week 113, I added to existing positions, so the number of dividends generated didn't increase. It's getting very interesting seeing the amount of monthly dividend income being generated and the number of days that dividends are produced. In May I have dividends rolling in throughout half the month.
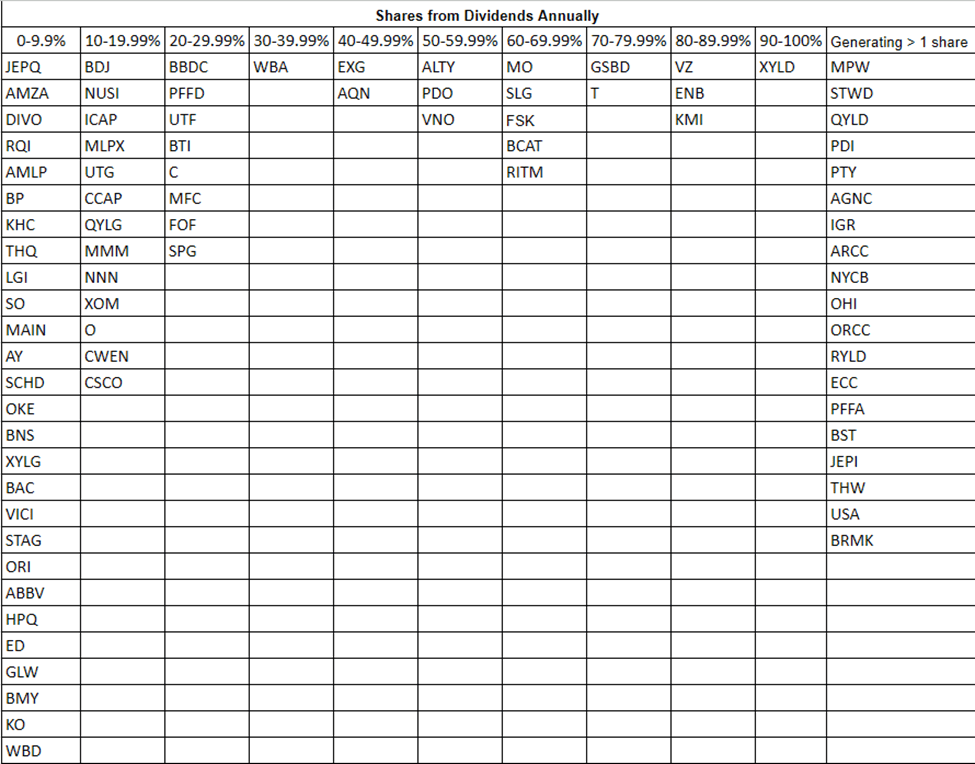
The goal of generating enough income from the dividends to purchase an additional share per year has been the never-ending project of this portfolio. There are now 19 positions generating an additional share per year. I am continuously working on getting more positions over the 100% threshold. I think I can finish 2023 with at least 25-30 positions generating a share per year from their dividends. Looking at the grid I feel that several positions will move into the far right column over the next several weeks.
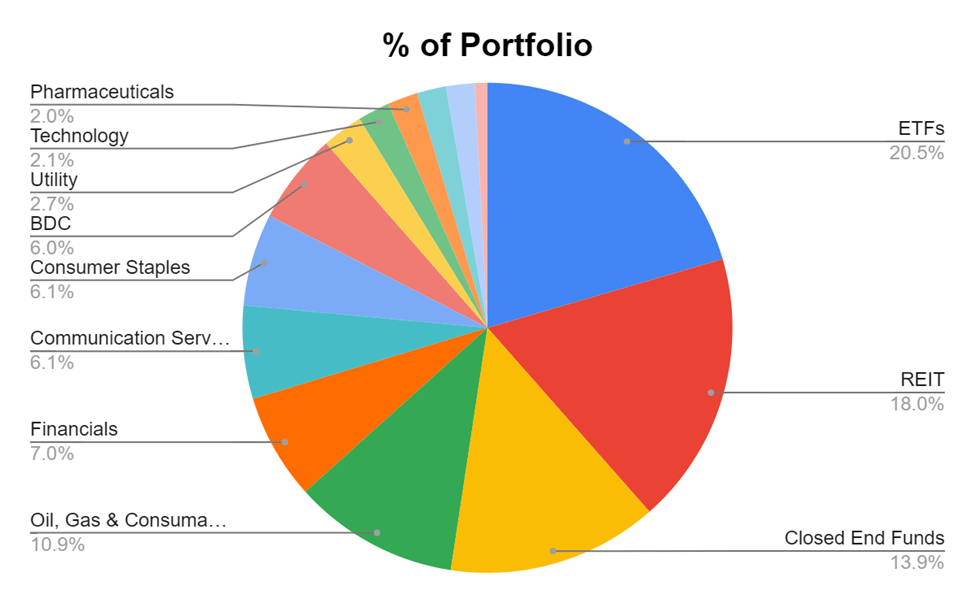
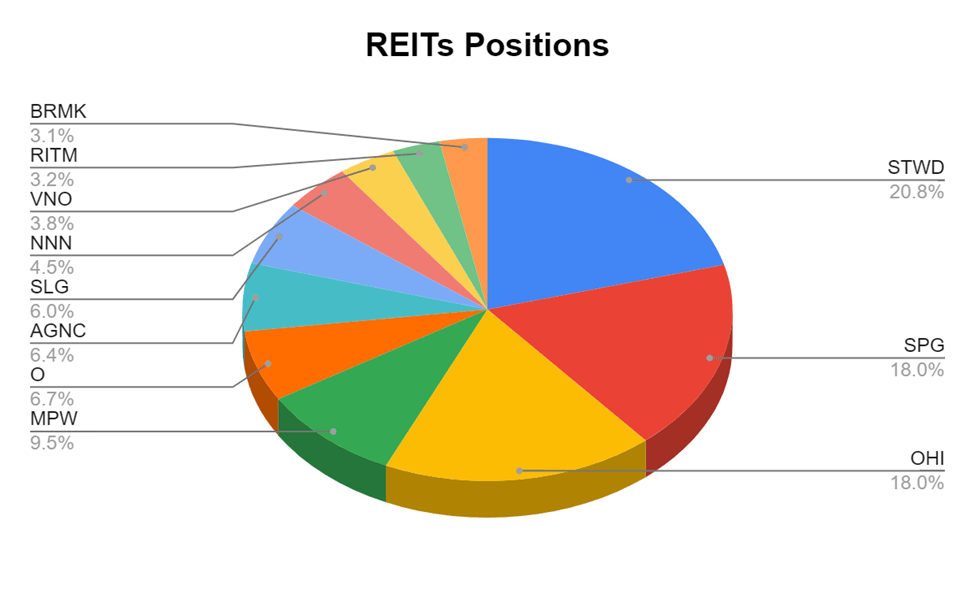
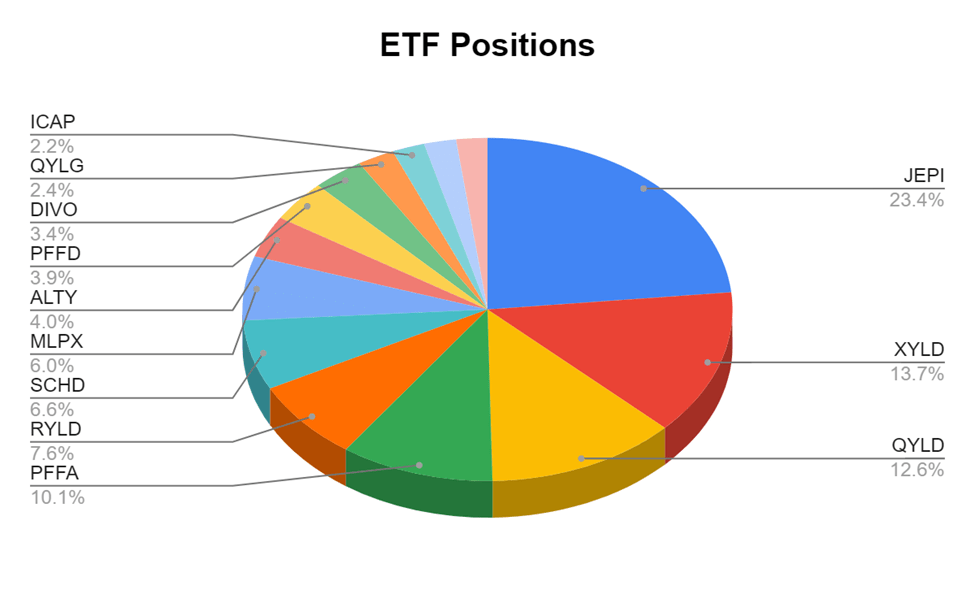
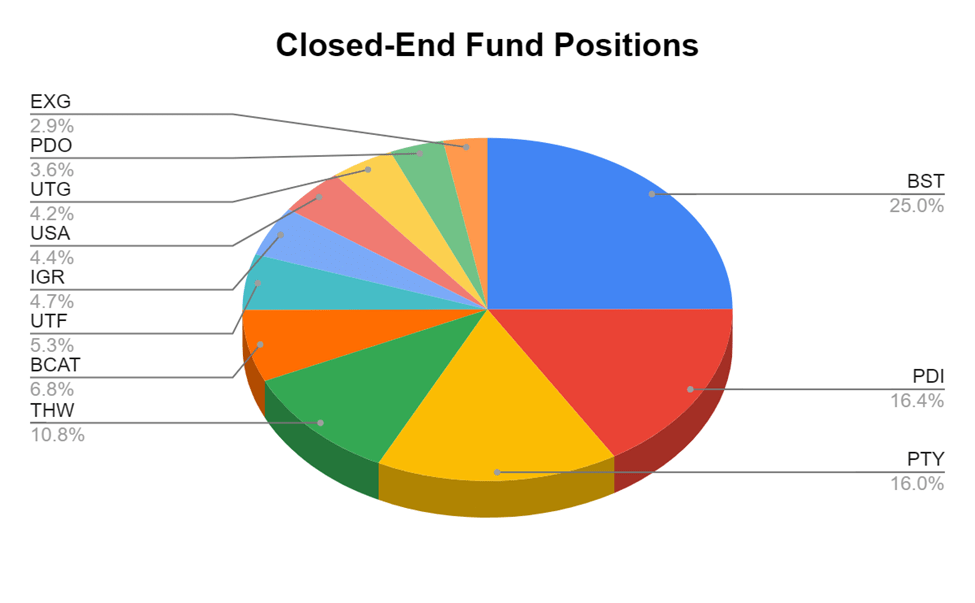
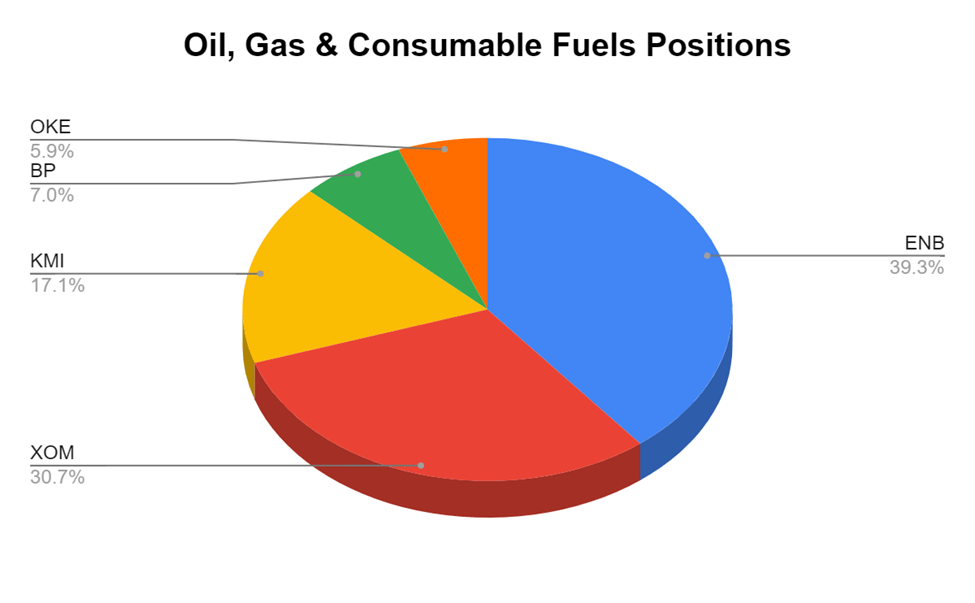
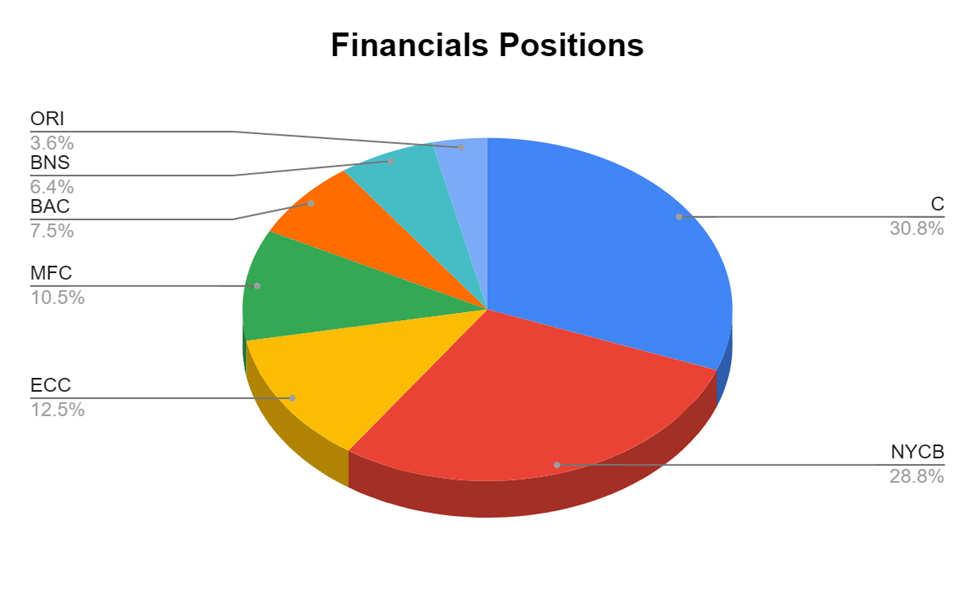
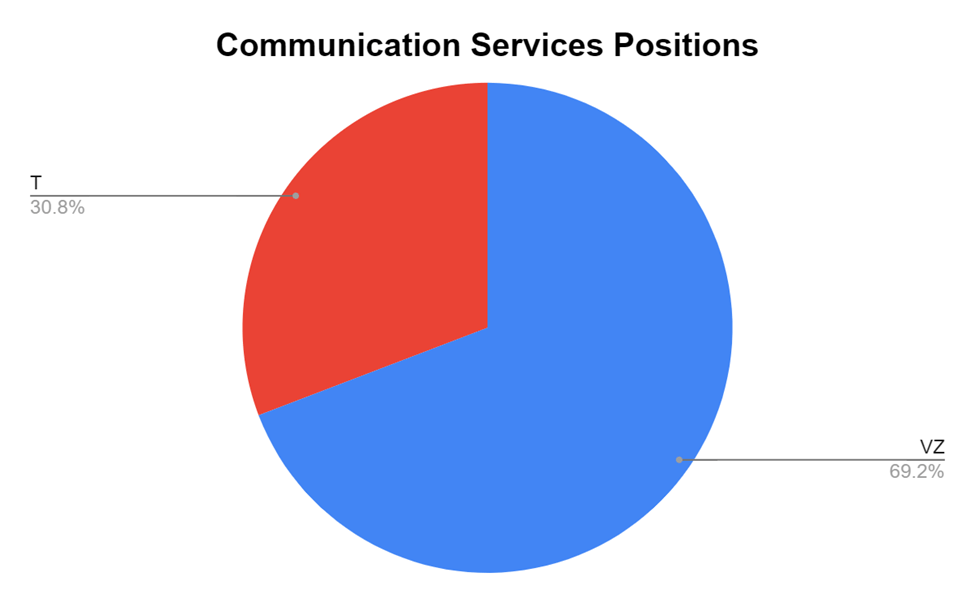
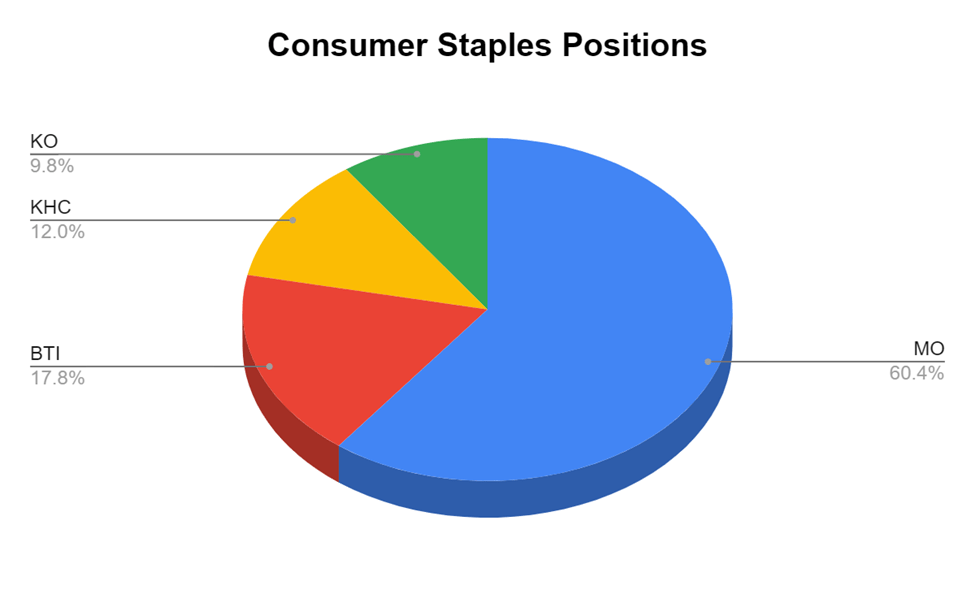
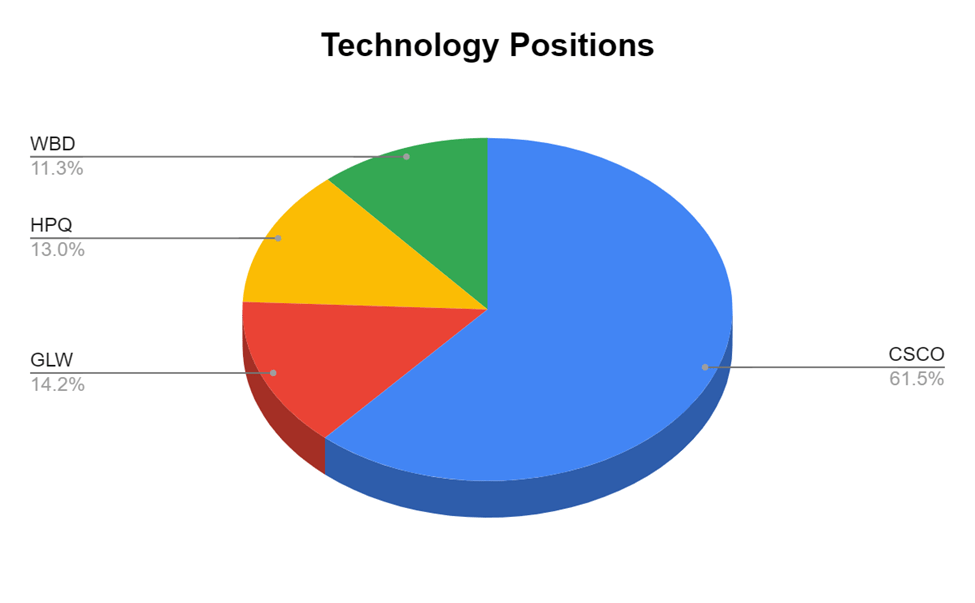
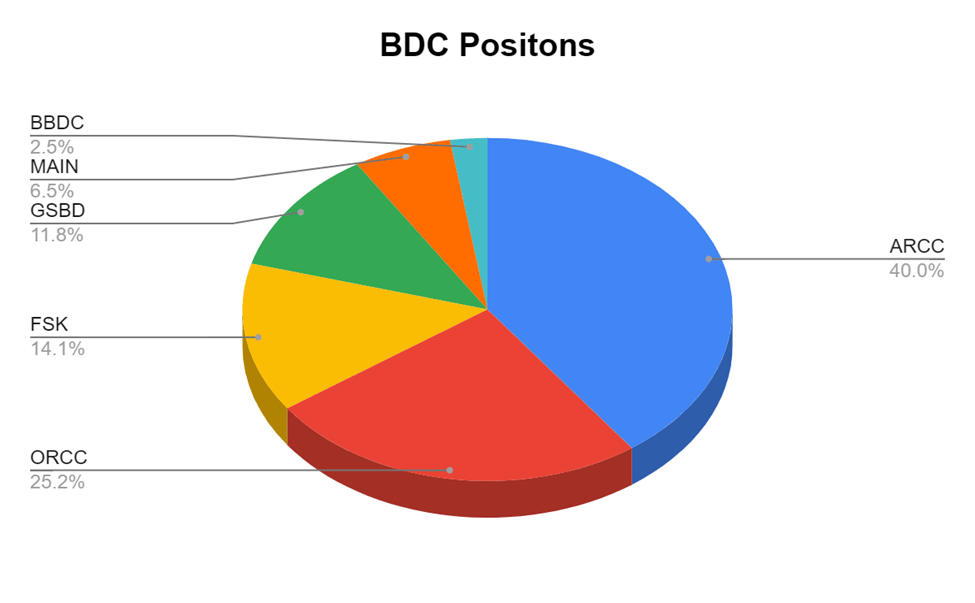
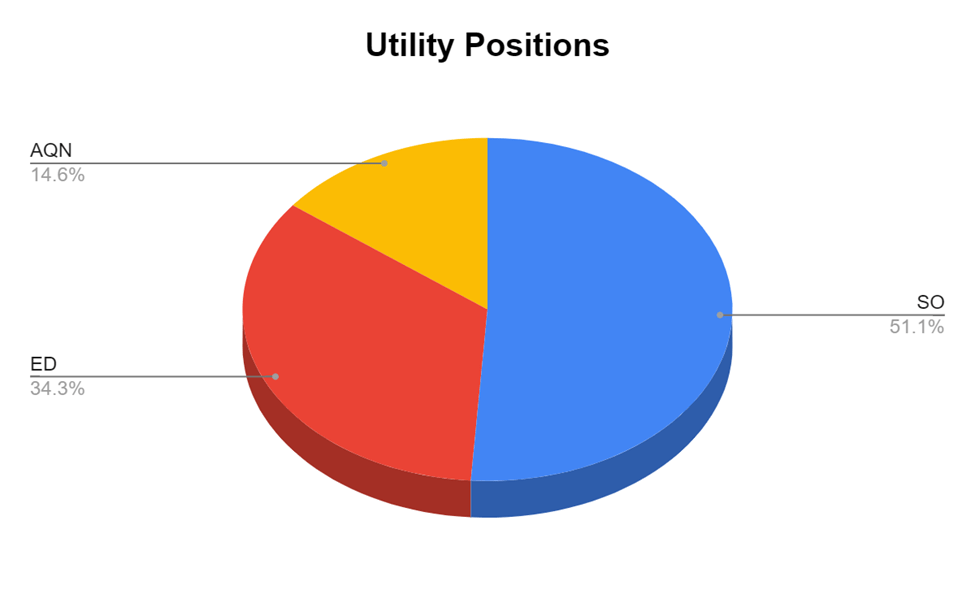
The Dividend Harvesting Portfolio Composition
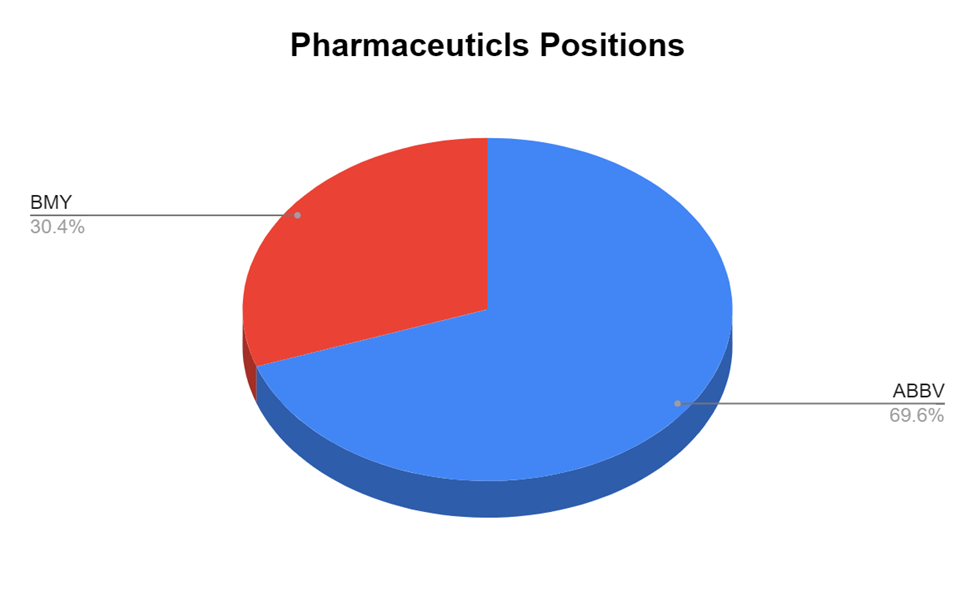
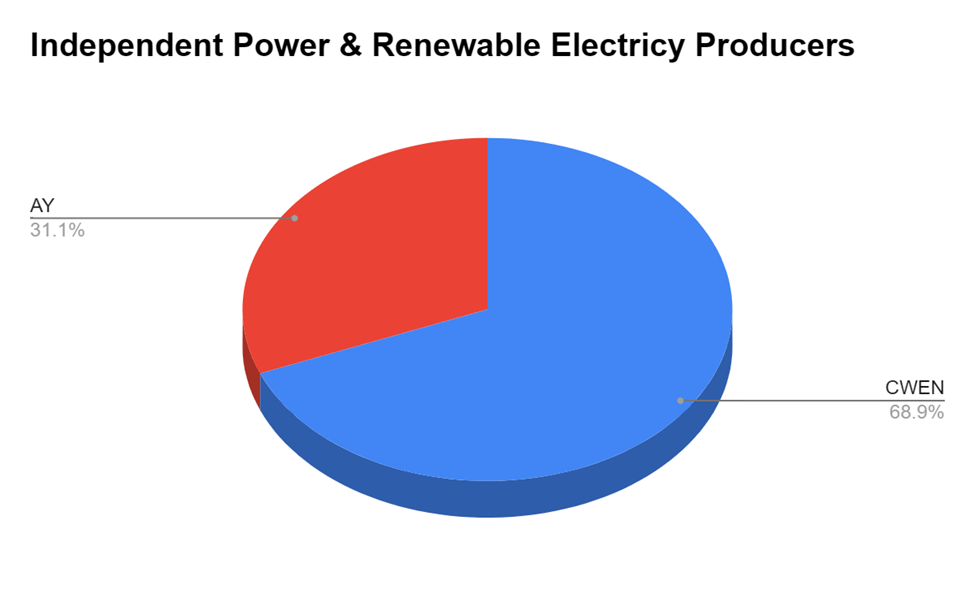
Many of the readers have asked if I could break down the individual positions within these sectors. I created pie charts for each individual sector and have illustrated how much each position represents of that sector of the Dividend Harvesting portfolio. Since I only have one position in Food & Staple Retailing and Industrials, I did not make a chart for those. 3M ( MMM ) and Walgreens Boots Alliance ( WBA ) represent 100% of those sectors. The charts will follow the normal portfolio total I have constructed. Please keep the ideas coming, as I am happy to add as much detail to this series as I can.
ETFs are starting to get closer to the 20% threshold, but in week 113, ETFs still remained the largest section of the Dividend Harvesting Portfolio's composition. Individual equities make up 41.61% of the portfolio and generate 28.53% of the dividend income, while exchange-traded funds ("ETFs"), closed-end funds ("CEFs"), real estate investment trusts ("REITs"), business development companies ("BDCs"), and exchange-traded notes ("ETNs") represent 58.39% of the portfolio and generate 71.47% of the dividend income.
I have a 20% maximum sector weight, so when a singular sector gets close to that level, I make sure capital is allocated away from that area to balance things out. This is the first time I have exceeded 20% in a single sector of the portfolio. I will be allocating capital away from ETFs for a while to get this sector under 20%.
| Industry |
| Investment |
| Portfolio Total |
| % of Portfolio |
| ETFs |
| $2,334.15 |
| $11,402.56 |
| 20.47% |
| REIT |
| $2,056.10 |
| $11,402.56 |
| 18.03% |
| Closed End Funds |
| $1,584.06 |
| $11,402.56 |
| 13.89% |
| Oil, Gas & Consumable Fuels |
| $1,247.47 |
| $11,402.56 |
| 10.94% |
| Financials |
| $795.97 |
| $11,402.56 |
| 6.98% |
| Communication Services |
| $701.06 |
| $11,402.56 |
| 6.15% |
| Consumer Staples |
| $694.34 |
| $11,402.56 |
| 6.09% |
| BDC |
| $683.41 |
| $11,402.56 |
| 5.99% |
| Utility |
| $308.08 |
| $11,402.56 |
| 2.70% |
| Technology |
| $240.45 |
| $11,402.56 |
| 2.11% |
| Pharmaceuticals |
| $227.77 |
| $11,402.56 |
| 2.00% |
| Industrials |
| $218.81 |
| $11,402.56 |
| 1.92% |
| Food & Staple Retailing |
| $215.27 |
| $11,402.56 |
| 1.89% |
| Independent Power & Renewable Electricity Producers |
| $95.32 |
| $11,402.56 |
| 0.84% |
| Cash |
| $0.28 |
| $11,402.56 |
| 0.00% |
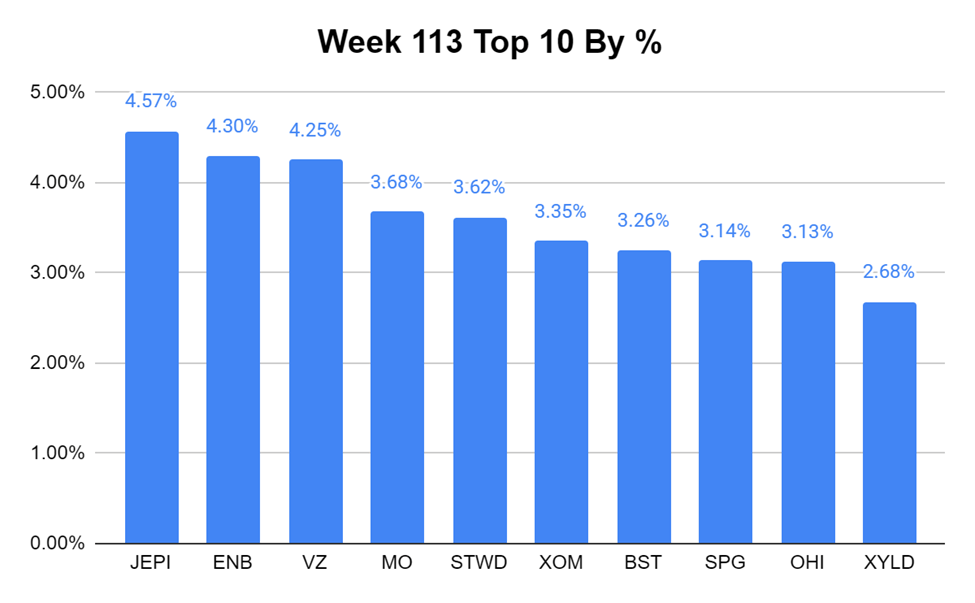
In week 113, the JPMorgan Equity Premium Income ETF ( JEPI ) remained the largest position in the Dividend Harvesting Portfolio. Enbridge ( ENB ) is the 2 nd largest position, and Verizon ( VZ ) declined much closer to 4%. While VA and ENB are still above 4%, I want to get them to the point where they are generating more than a share per year through their dividends.
Week 113 Additions
In week 113, I added to the following positions:
- SL Green Realty ( SLG )
- Enbridge ( ENB )
- Vornado Realty ( VNO )
- Goldman Sachs BDC ( GSBD )
- PIMCO Corporate & Income Opportunity Fund ( PTY )
SL Green Realty
- I could be wrong, but I think SLG is going to be a solid investment. Short interest is almost 28% and I think their wrong. Q1 earnings were solid, there is a large flow of deals in the pipeline, and SLG continues to pay a dividend that yields almost 14%. I think the fears about office space are warranted to a degree but SLG is being lumped in with everyone else. My feeling is that class C and B buildings will suffer, and Class A buildings will thrive as more companies demand workers come back to the office.
Vornado Realty
- I need to address something. I wrote a dedicated article on VNO ( can be read here ), and on 4/26, VNO dropped some huge news. VNO issued a statement that it will postpone dividends on its common shares until the end of 2023. Upon finalization of its 2023 taxable income, including the impact of asset sales, VNO will pay the 2023 dividend in either cash or a combination of cash and securities. VNO also announced that in order to enhance shareholder value, its Board of Trustees has authorized the repurchase of up to $200 million of its outstanding common shares under a newly established share repurchase program. Cash retained from dividends or from asset sales will be used to reduce debt and/or fund share repurchases. The interesting thing is that VNO has $1.49 billion in cash, cash equivalents, restricted cash, and investments in U.S. Treasury bills on the books, with $22 million of debt due in 2023 and $396 million due in 2024.
Since the dividend is suspended until the end of the year and not reduced or cut, I am keeping the dividend payment in the total dividend income section of this series because it's basically deferred. I am not selling my shares, as this release doesn't change my investment thesis. I will reevaluate my investment theory if VNO releases information that changes the situation.
Enbridge
- ENB is one of my favorite energy infrastructure companies, with more than two decades of consecutive dividend increases. I want to get ENB over the line and generate a new share each year from its dividend. As long as shares drop below $40, I will always look to buy.
Goldman Sachs BDC
- I wanted to increase my exposure to BDCs and increase my position in GDBD
PIMCO Corporate and Income Opportunity Fund
- I am still in the red, so I dollar cost averaged into PTY. I think PTY will rebound in the second half of 2023.
Week 114 Gameplan
I am looking to increase my position in ENB and Altria Group ( MO ). I may also add another share of SLG
Conclusion
The Dividend Harvesting Portfolio is back in the black, and I am hoping for another good week in the market. This is a long-term project, and even if the Fed derails the rally, I will continue to invest in long-term positions. Currently, the portfolio has 84 positions and is generating an estimated $939.05 in annual dividend income for a portfolio yield of 8.24%. Not half bad for starting with $100 and continuing to invest $100 each week. I am excited for the future of all my accounts, but to be honest, I have the most fun allocating capital to the Dividend Harvesting Portfolio.
For further details see:
Dividend Harvesting Portfolio Week 113: $11,300 Allocated, $939.05 In Projected Dividends