CA - Dividend Harvesting Portfolio Week 118: $11800 Allocated $993.79 In Projected Dividends
2023-06-08 09:00:00 ET
Summary
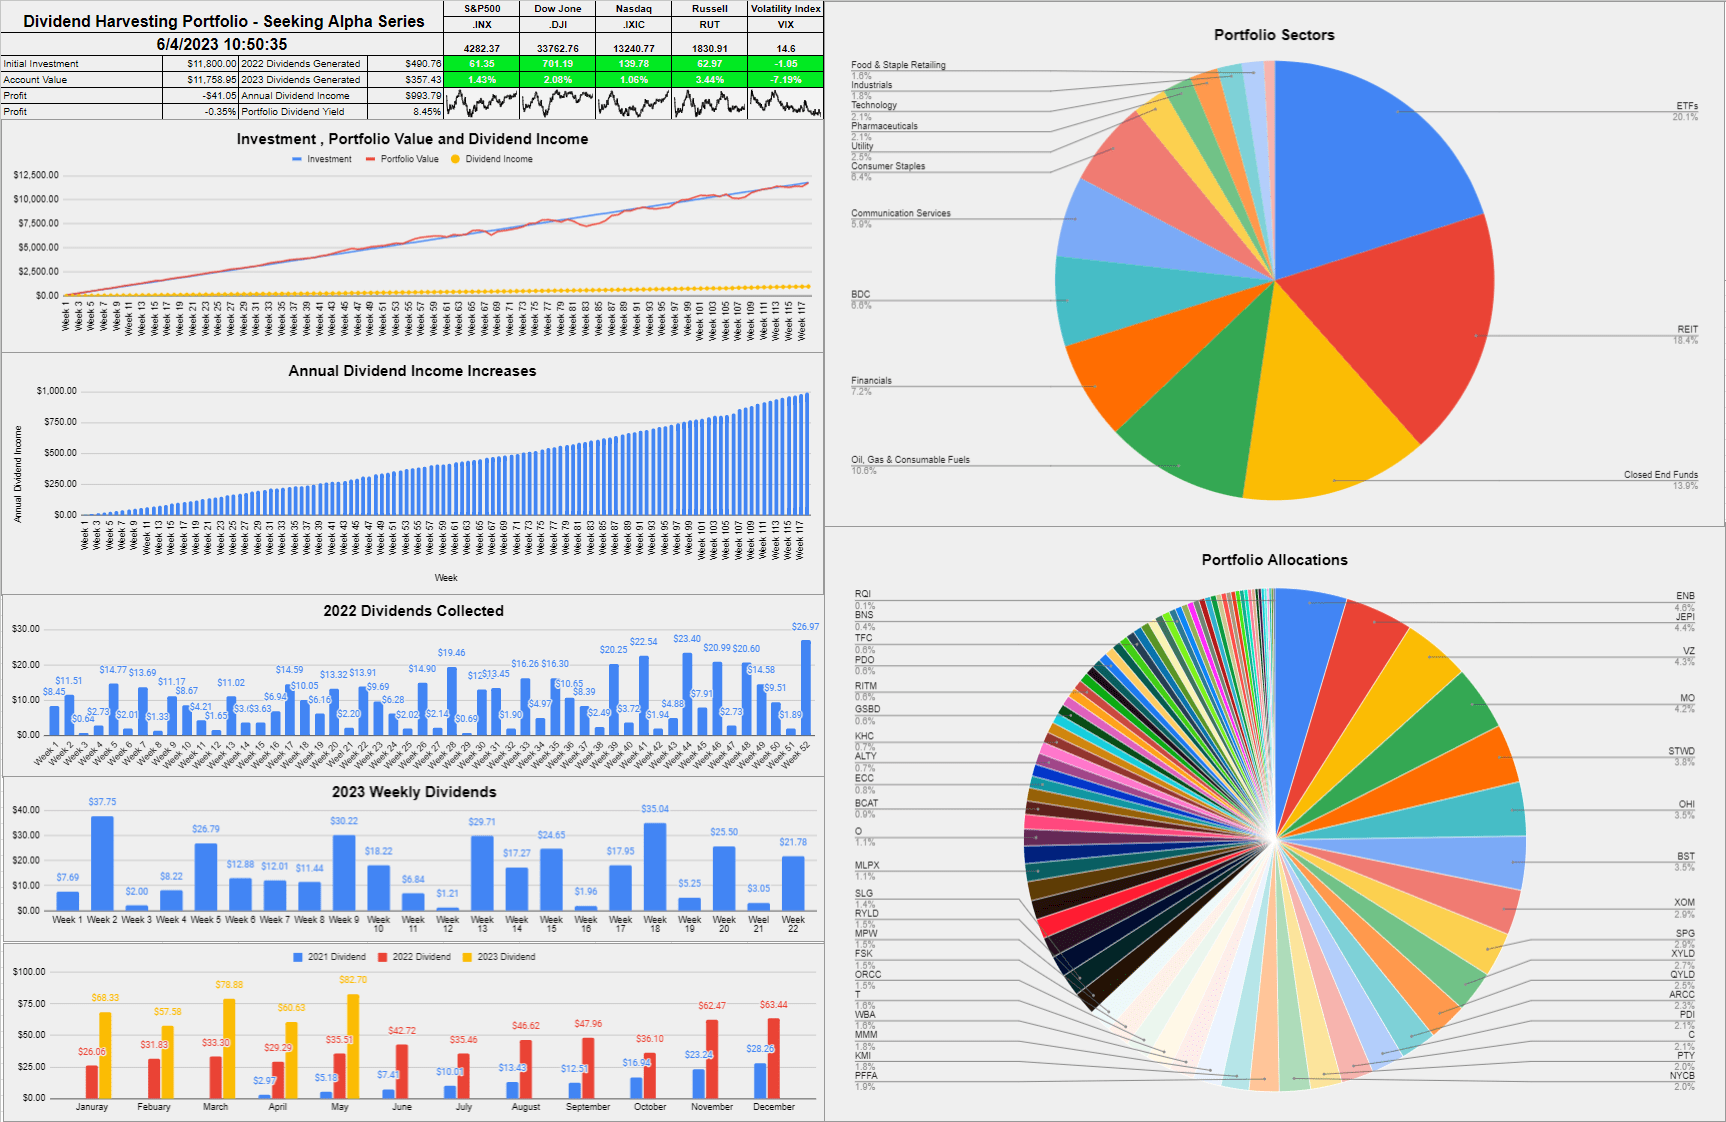
- The Dividend Harvesting Portfolio's balance reached $11,758.95 after 118 weeks, with a projected annual dividend income of $993.79.
- The portfolio focuses on income generation, downside mitigation through diversification, and capital appreciation.
- In week 118, Altria Group and FS KKR Capital Corp were added to the portfolio, with a potential milestone of $1,000 in projected annual dividends expected in week 119.
The markets had a good week as a deal was reached on the debt ceiling, and President Biden signed the bill into law. With one crisis adverted, the S&P 500 increased by 1.34% this week, while the Nasdaq rose 0.75%. Now all eyes are on the Fed as the next FOMC meeting takes place in less than 10 days, with the probability of another rate hike cut to 25.3%. The price of crude is down -38.28 YoY, while natural gas has declined -74.38%. If commodity prices stay in this range, my opinion is that the Fed pauses and sees how things progress over the summer. Regardless of what occurs, I will continue allocating capital on a weekly basis.
After 118 weeks and $11,800 allocated, the balance of the Dividend Harvesting Portfolio is $11,758.95. The account has declined by -$41.05 or -0.35% on invested capital as it regained substantial ground in week 118. This was a solid week for dividends as 17 positions generated $21.78 of income, bringing 2023's total dividend income generated to $357.43. In week 118, I added to my positions in Altria Group ( MO ), and FS KKR Capital Corp ( FSK ). At the end of week 118, my projected annual dividend income increased by $13.68 or 1.4% to $993.79, which is a forward yield of 8.45%. There is a high probability that in week 119, I will cross over the $1,000 level for projected annual dividend income.
I allocate capital toward big tech, funds, dividends, and growth outside of my retirement accounts. These are not my only investments, but I did open a separate account, so I could easily track and document this series. I intentionally created broad diversification throughout the Dividend Harvesting portfolio so I could benefit from sector rotations and mitigate my downside risk. Investors who are too exposed to growth companies or large-cap tech have gotten crushed as the investment landscape changes. On the growth and tech side of my investments, I'm feeling the pain as some of my favorite companies, including Alphabet ( GOOG , GOOGL ), Amazon ( AMZN ), and Meta Platforms ( META ), have been taken to the woodshed.
I'm going to address a question that continues to surface. I'm not trying to beat the market with this portfolio. I love index funds and am invested in several index funds. I love dividend investing due to the stream of cash flow it generates. I don't want 100% of my assets outside of real estate tied to an S&P index fund. I have created a personal investment strategy that works to achieve my investment goals, and having a stream of income generated from dividends is part of my investment strategy. Low-cost index funds are one of the best investments anyone can make in my opinion, and the Dividend Harvesting portfolio is not meant to be a substitute for an index fund. I have read many questions about dividend investing and wanted to start a portfolio from the ground up and document its progress to disprove many misconceptions, including that you need a large amount of seed capital to make dividend investing work for you.
This series has never been about hitting a target yield, generating a certain amount of profit, or beating the market. I had two specific goals with this series. The first was to create a blueprint for constructing a dividend portfolio by documenting the journey starting from the beginning. The second goal was to illustrate how allocating capital each week toward investing, regardless of the amount, would be beneficial in the long run.
Too many people are under the illusion that you need tens of thousands or even hundreds of thousands to benefit from investing. Instead of using my real dividend portfolio as an example, I decided to start a new account, fund it with $100, and add $100 weekly, providing a step-by-step guide to dividend investing. This methodology doesn't have to be used for dividend investing, and it could be as simple as an S&P index fund or a Total Market fund. Hopefully, this series is inspiring people to invest in their future to attain financial freedom.
A historical recap of the Dividend Harvesting Portfolio's investment principles
Investment Objectives
- Income generation
- Downside mitigation through diversification
- Capital appreciation
Below are the fundamental rules I have put in place for this Portfolio:
- Allocate $100 weekly to this Portfolio
- Only invest in dividend-producing investments
- No position can exceed 5% of the Portfolio
- No sector can exceed 20% of the Portfolio
- All dividends and distributions are to be reinvested
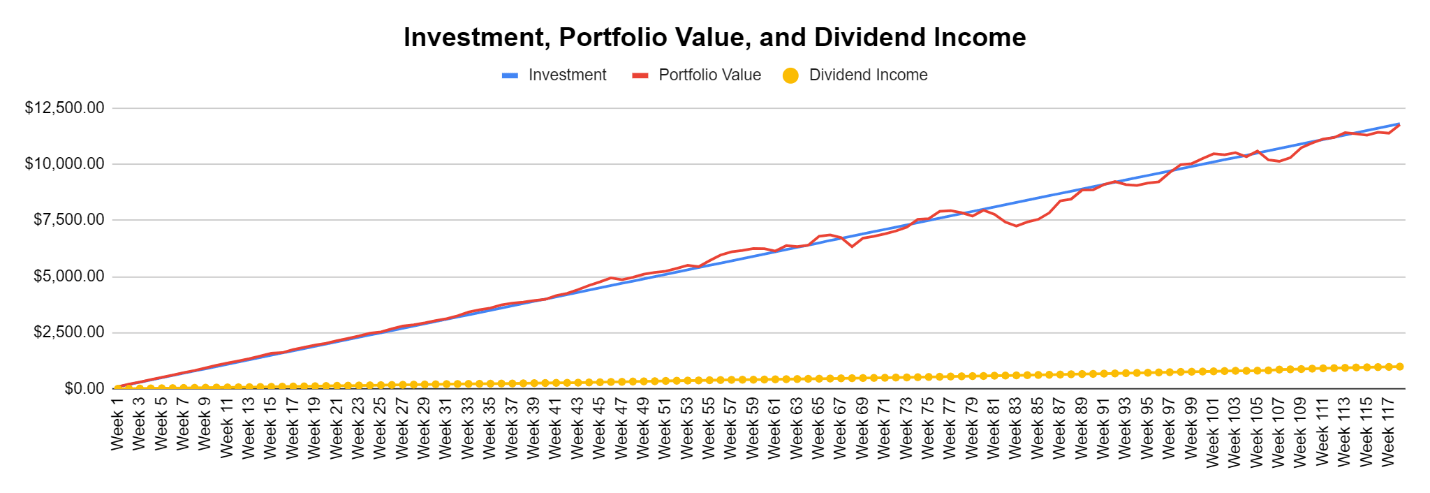
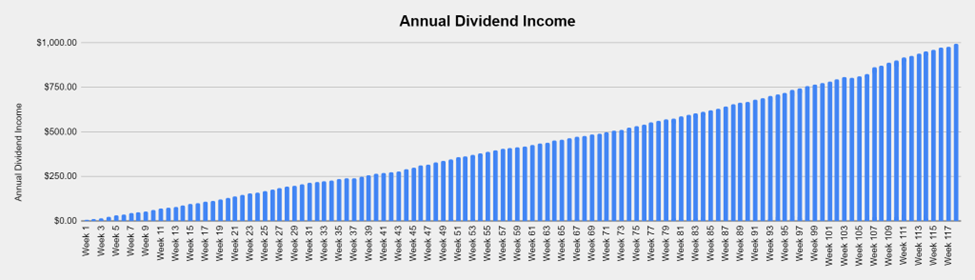
Below is a chart that extends from week 1 through the current week to illustrate the Dividend Harvesting Portfolio's Progression
- Blue line is my initial investment of $100 in week 1, $1,000 in week 10, etc.
- Red line is the account value at the end of each week
- Yellow line is the annual dividend income the Dividend Harvesting Portfolio was projected to generate after that week's investments and dividends reinvested
The Dividend Harvesting Portfolio dividend section
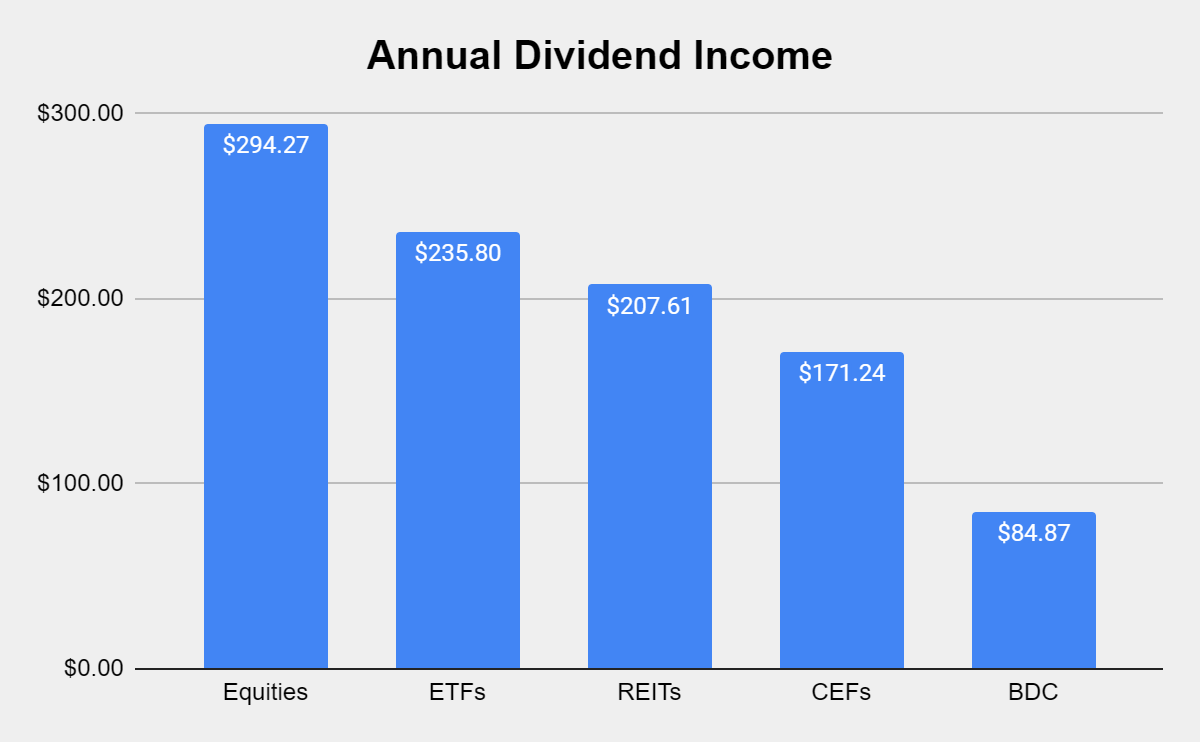
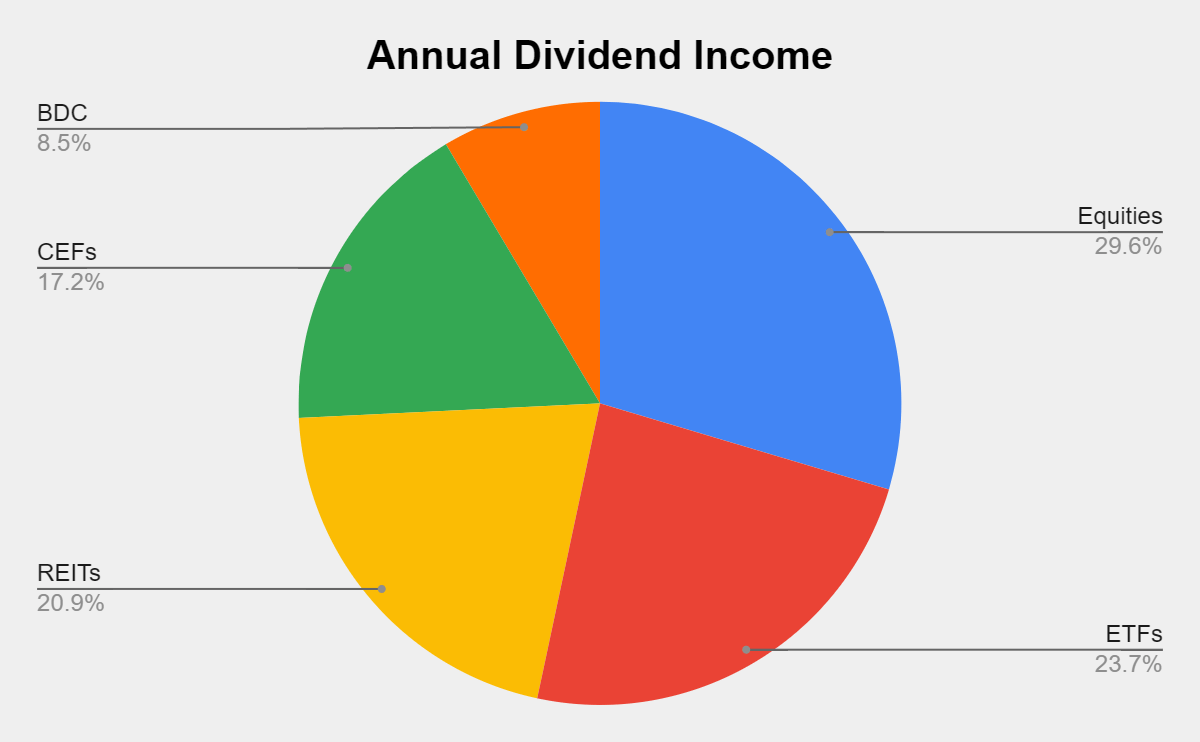
Here's how much dividend income is generated per investment basket:
- Equities $294.27 (29.61%)
- ETFs $235.80 (23.73%)
- REITs $207.61 (20.89%)
- CEFs $171.24 (17.23%)
- BDCs $84.87 (8.54%)
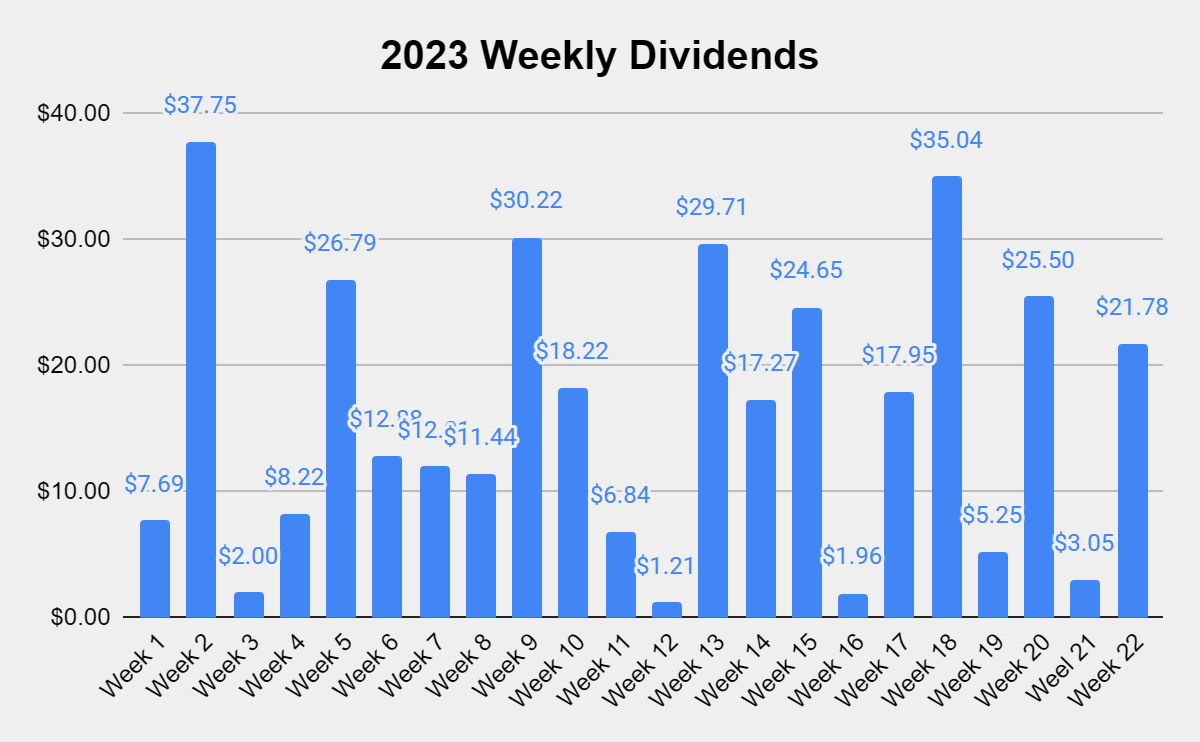
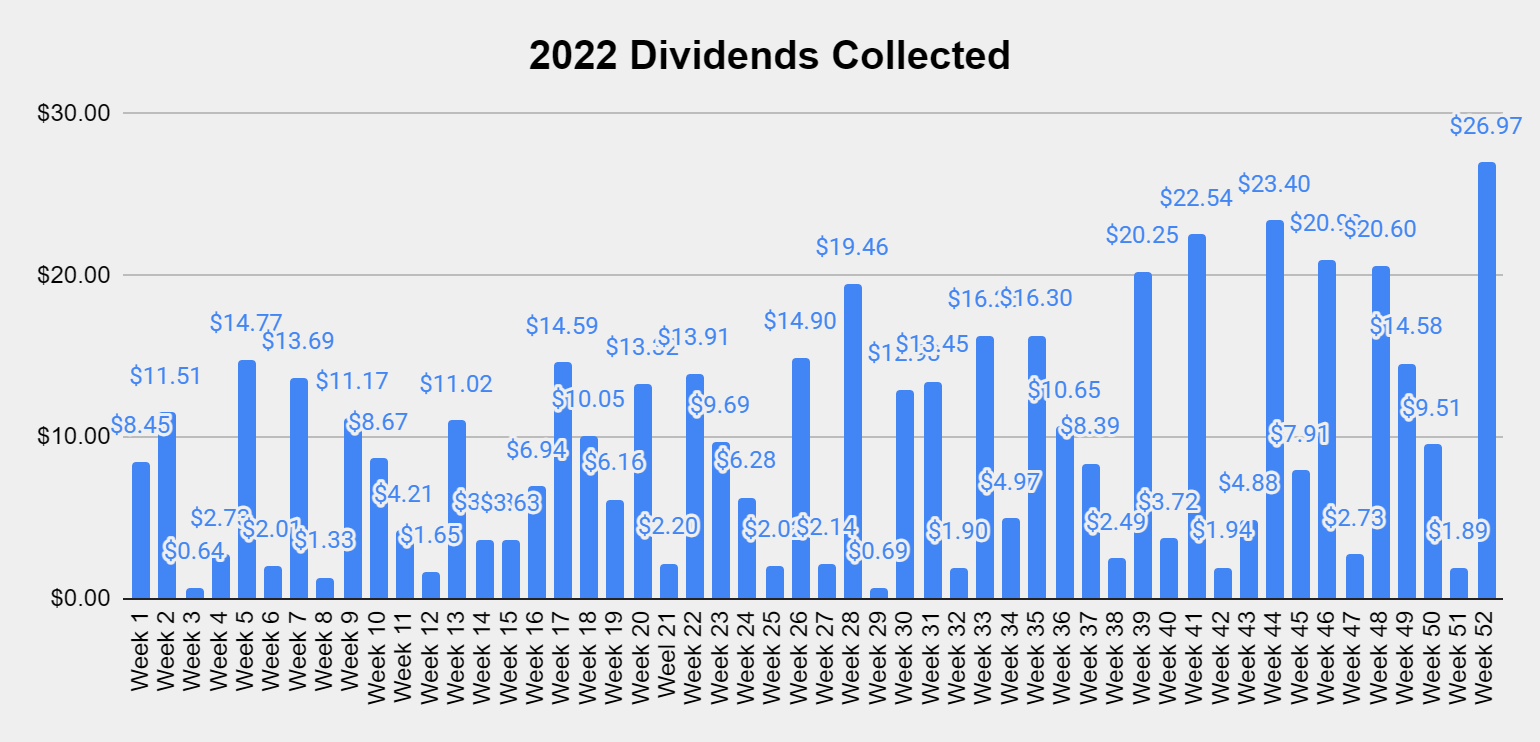
Collecting dividends can serve many functions in a portfolio. Some investors utilize dividends to supplement their income and live off of them. I'm building a dividend portfolio for myself 30 years into the future. In 2022, I collected $490.76 in dividend income from 533 dividends. In week 22 of 2023, I collected $21.78 in dividends, and in 2023 I generated $357.43 in dividend income. YTD, I have generated 72.83% of my 2022 dividend income from 266 dividends which is 49.91% of the dividends generated throughout 2022.
These dividends allow me to gain additional equity in my investments while increasing my future cash flow in down markets. This style of investing isn't for everyone, but if you're looking to generate consistent cash flow while mitigating downside risk, this method has worked for me. I'm hoping to collect around $1,000 in dividends in 2023, which will be reinvested.
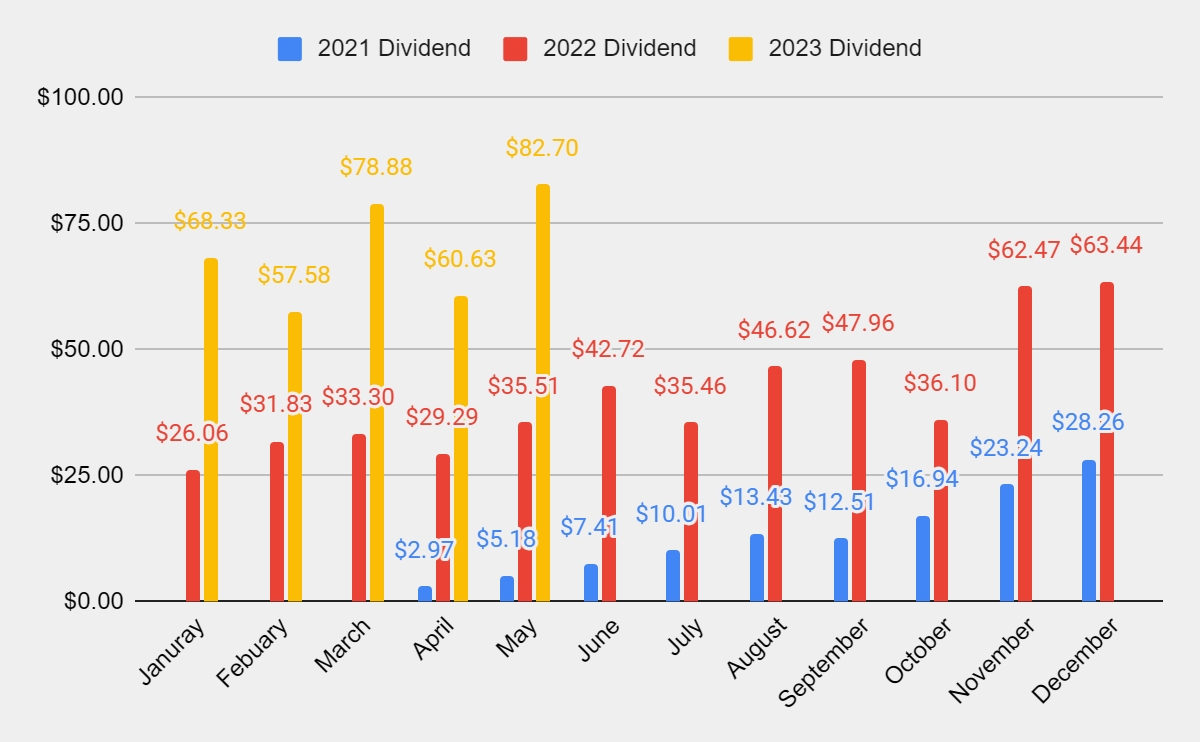
May has officially ended, and it was my largest month of dividend income to date. Throughout May, the Dividend Harvesting Portfolio produced 57 individual dividends and generated $82.70 in income. This is an increase of 132.89% YoY as my dividend income in May of 2023 jumped $47.19 from May of 2022.
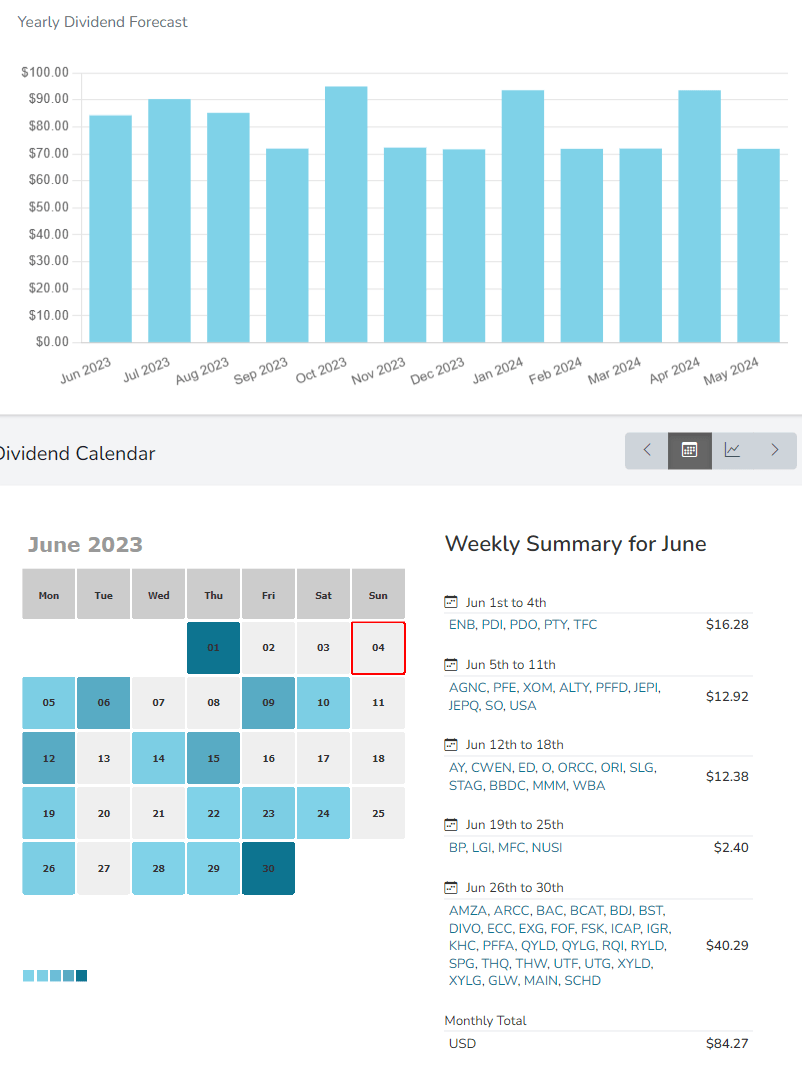
I found a tool that can track and visualize my monthly and weekly dividend income. I plan on showing this graph rather than the full year as it's a better visualization than what I had created. I really enjoy the payout calculator feature as this allows me to see my estimated monthly and weekly income and view every dividend rolling in one place. In the first several days of June, some big positions, such as Enbridge ( ENB ) generated its dividend. I am looking forward to more than 50 positions generating dividends as the month progresses. June should be another $80+ month of dividend income.
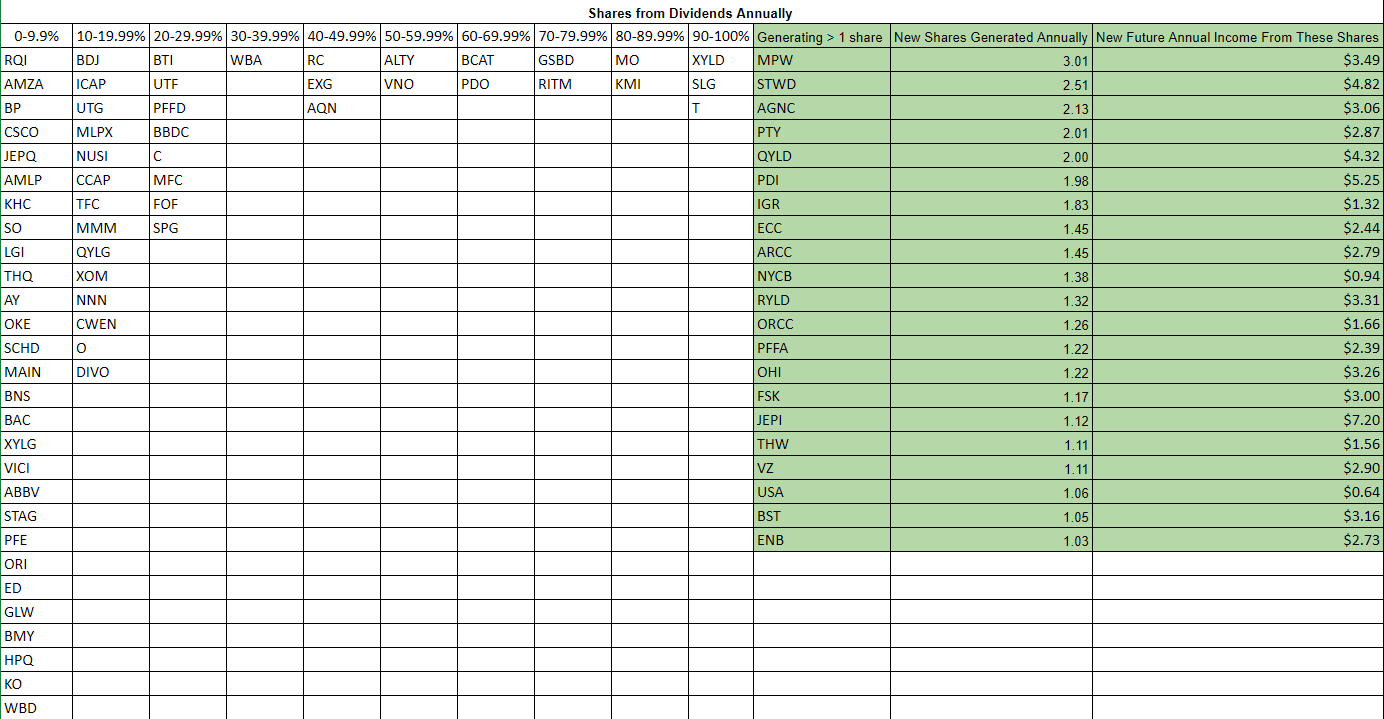
I changed this graphic a bit, so if you missed last week's article, please let me know what you think. I have broken this into two sections, positions not generating at least one share per year through its dividend and positions that are. In the section for the positions that are, I have shaded it green and added how many shares annually are being generated and the new future dividend income those new shares will generate. There are currently 22 positions generating at least one new share annually from their dividends, and the new annual dividend income being generated from these shares is $63.09. This changed from last week as ENB and FSK entered this group, and SL Green Realty ( SLG ) exited.
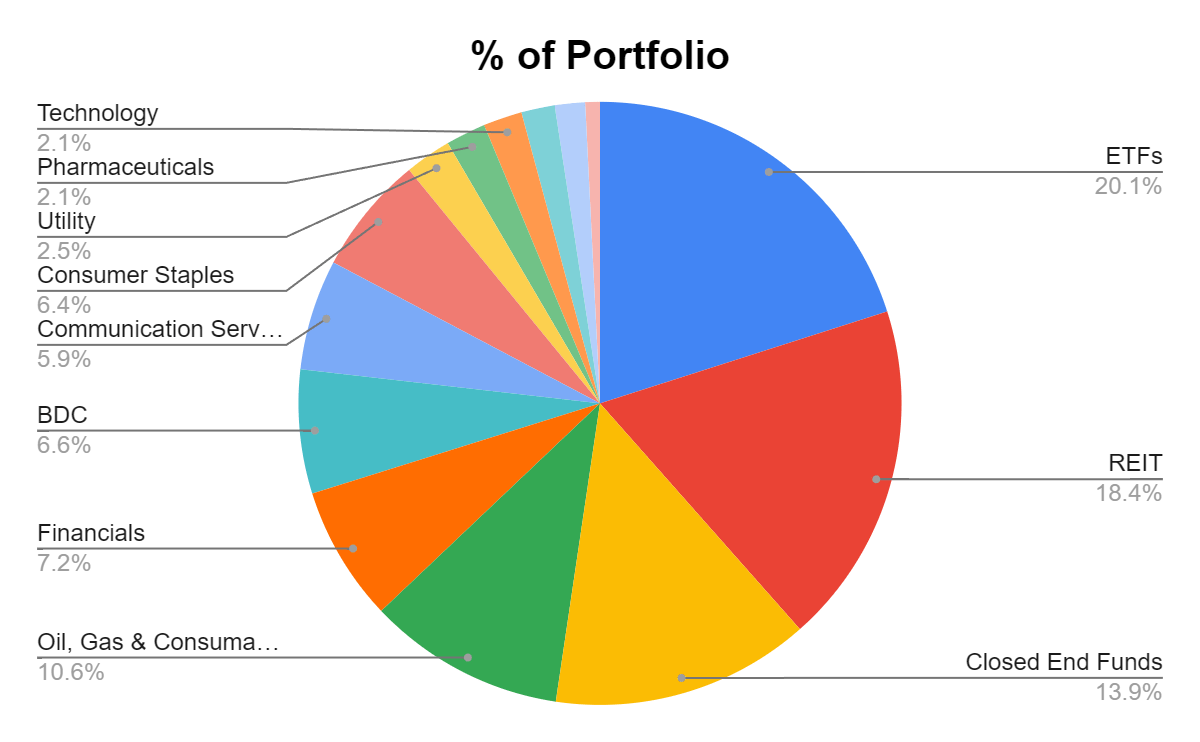
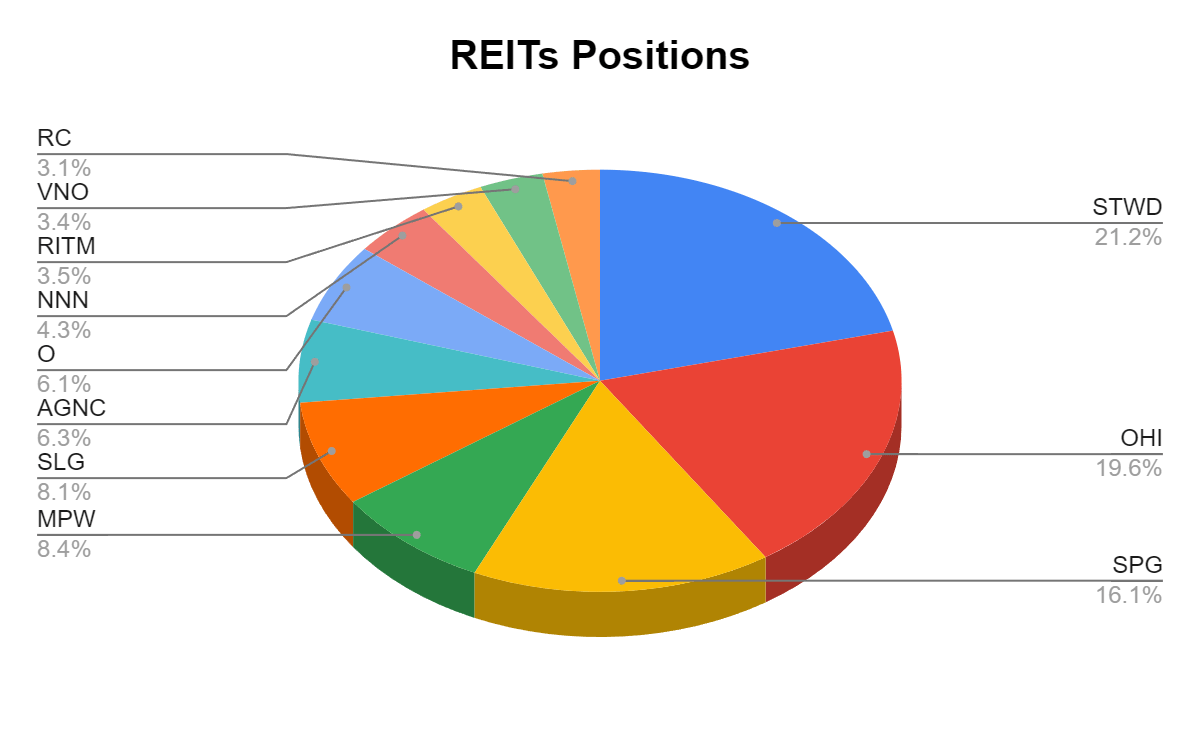
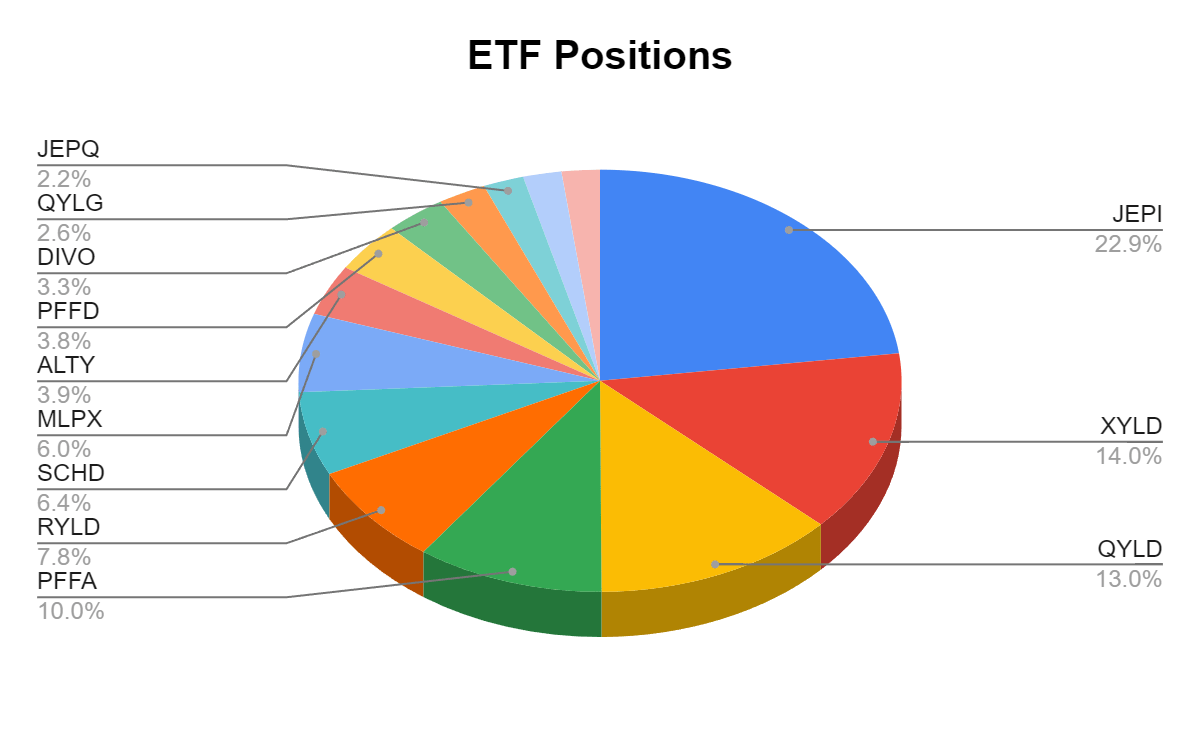
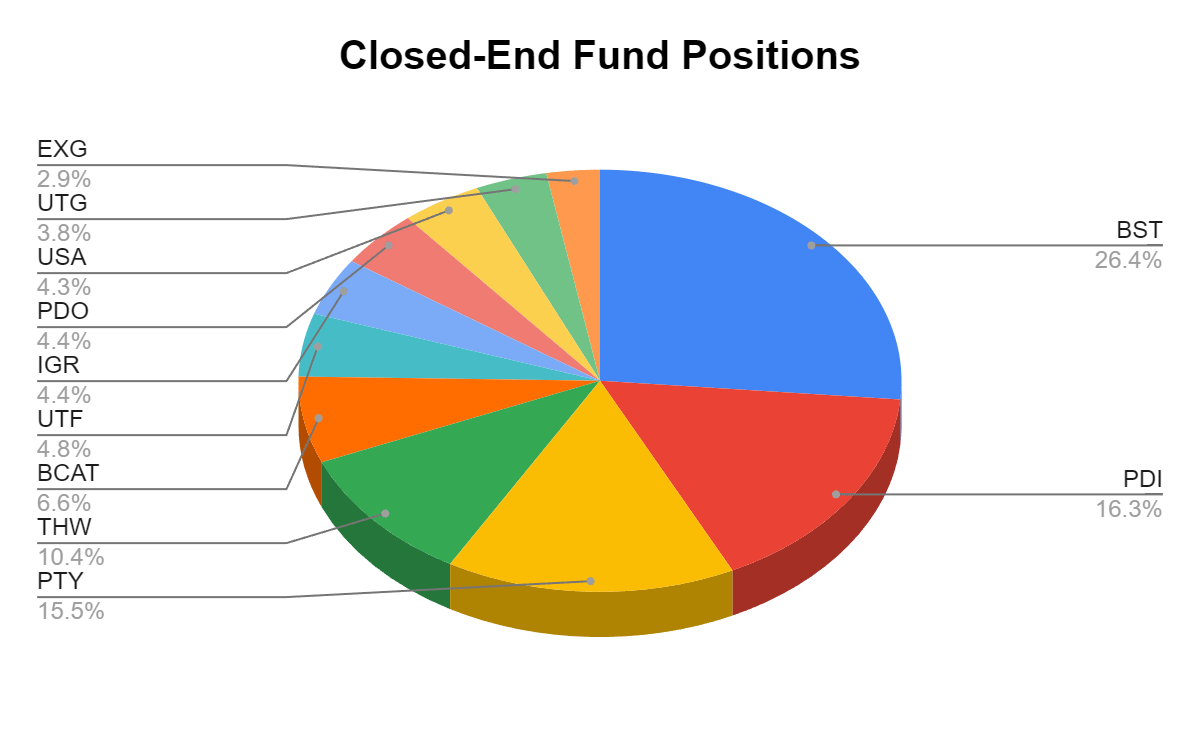
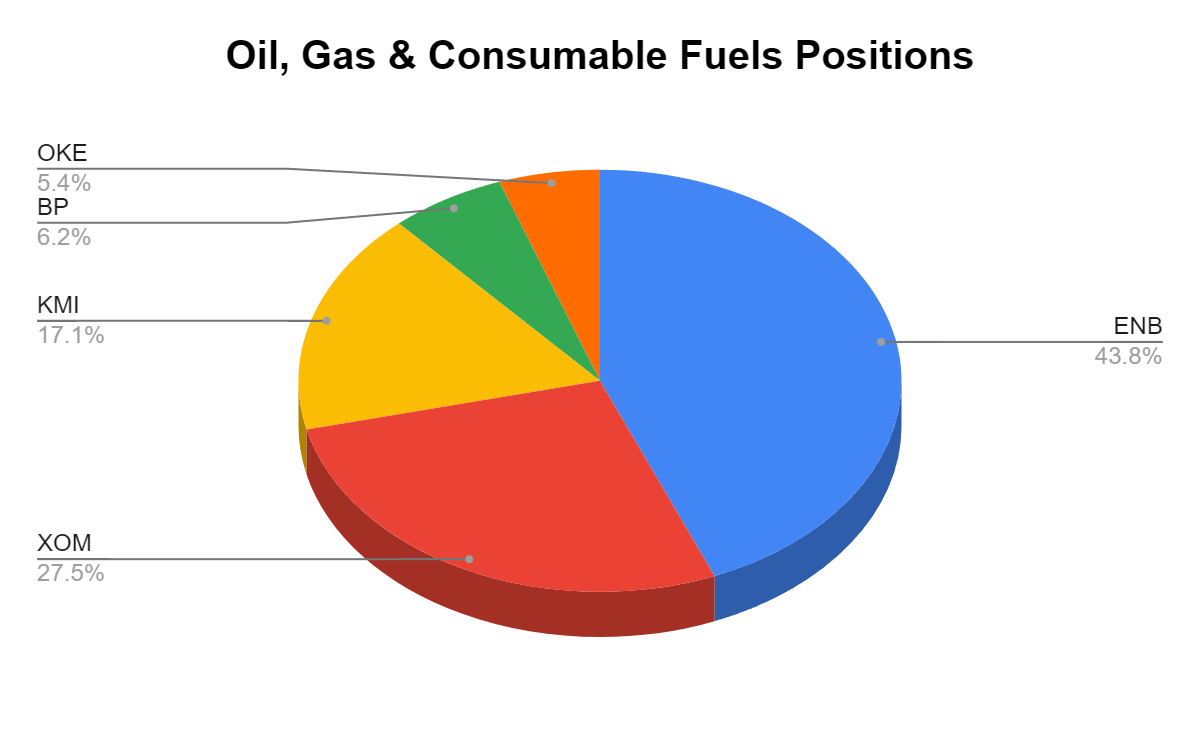
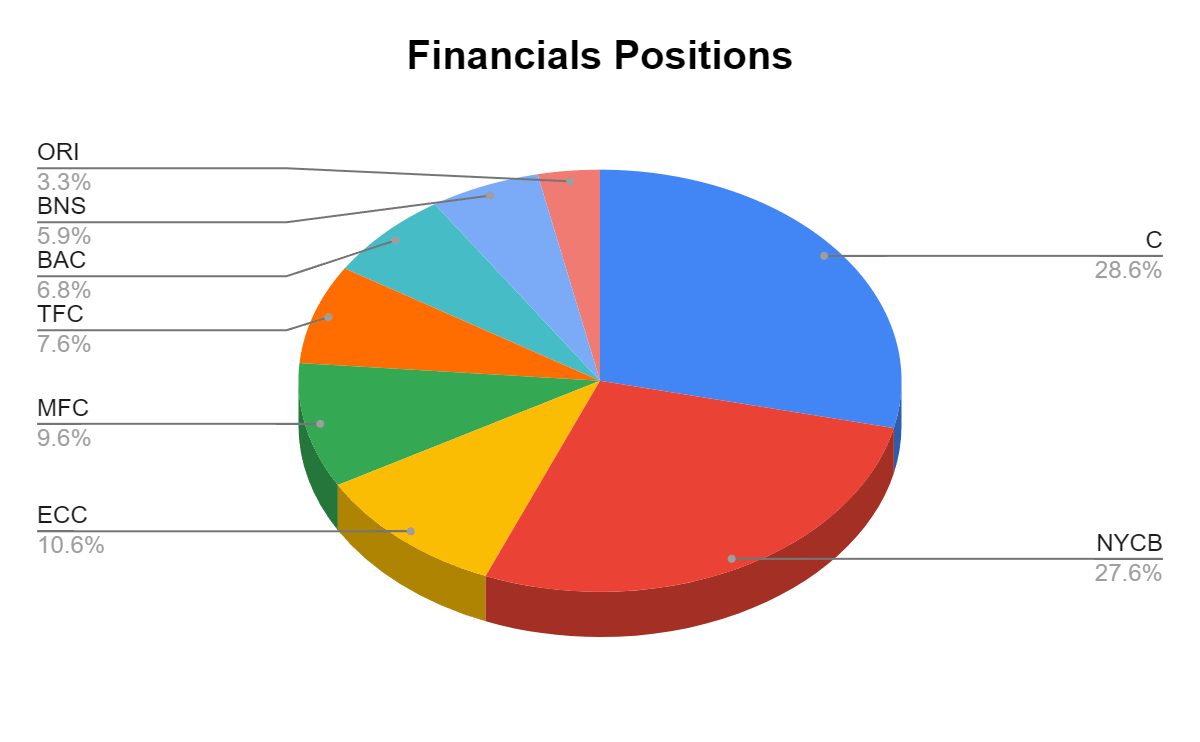
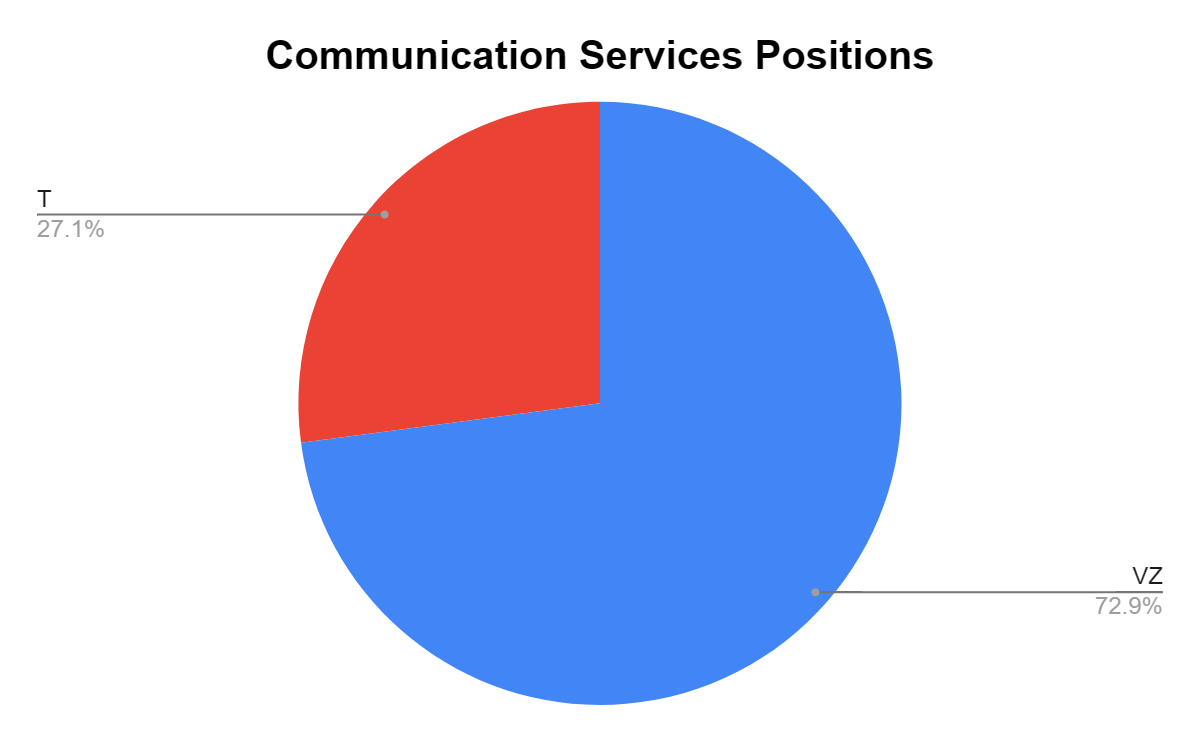
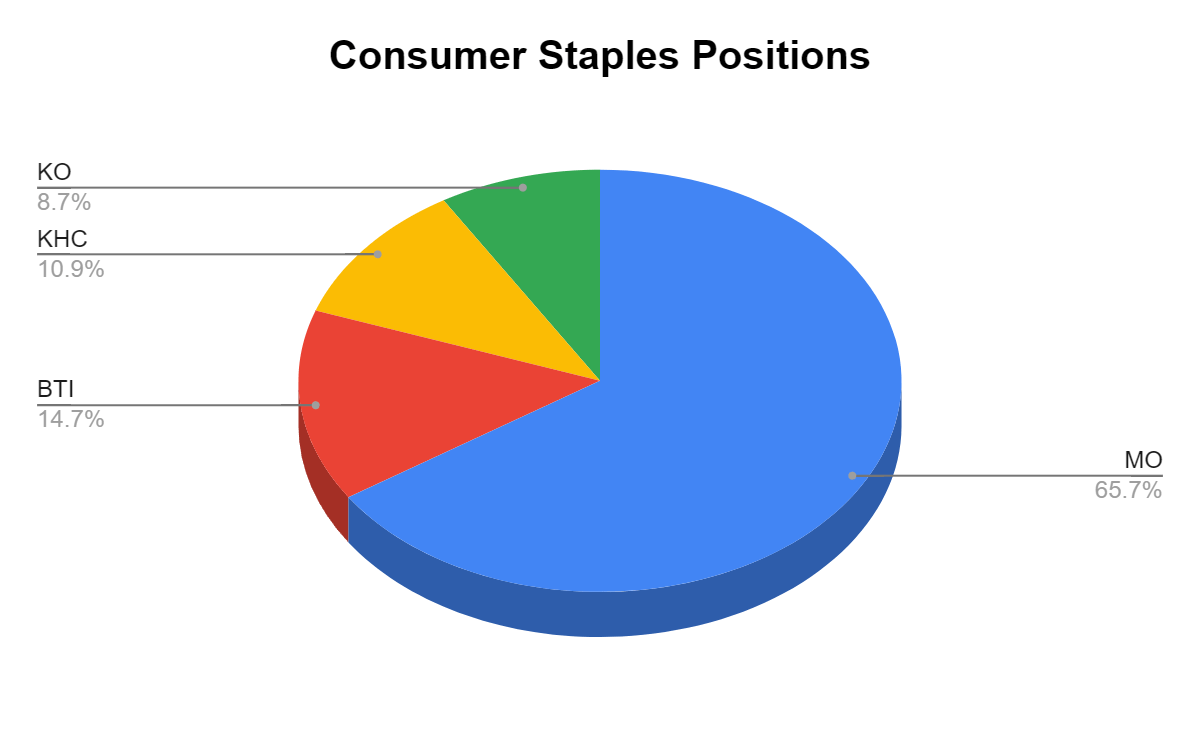
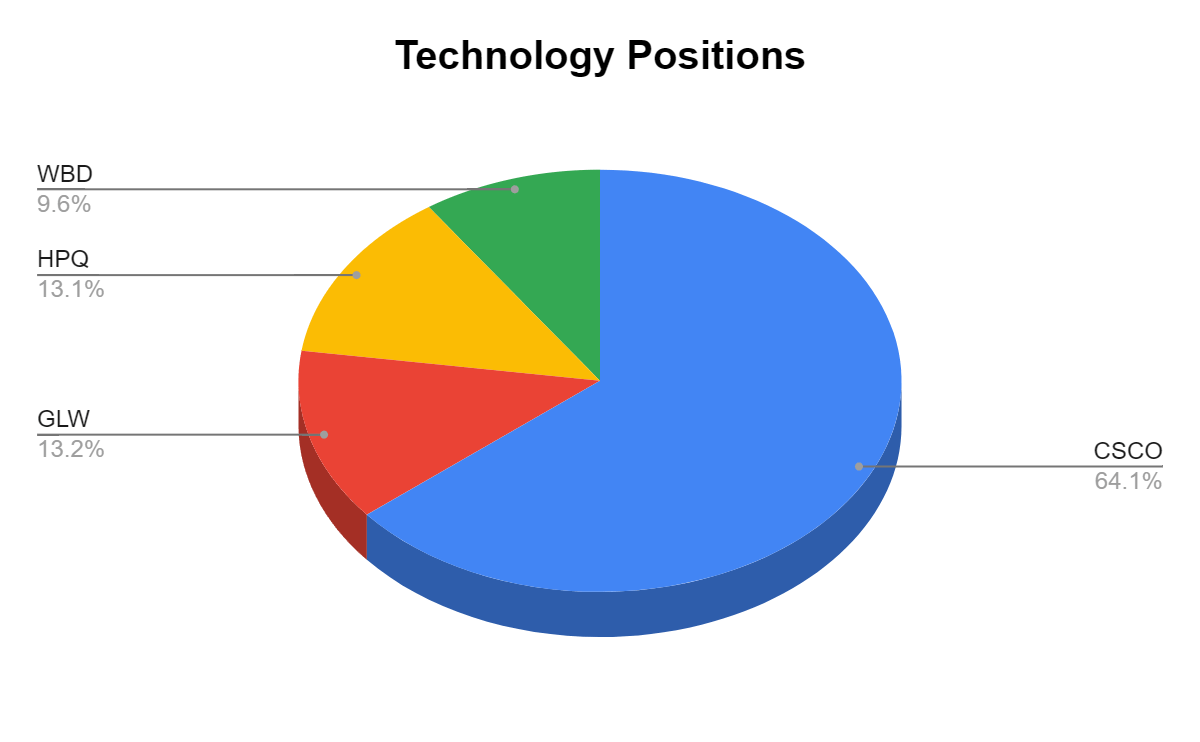
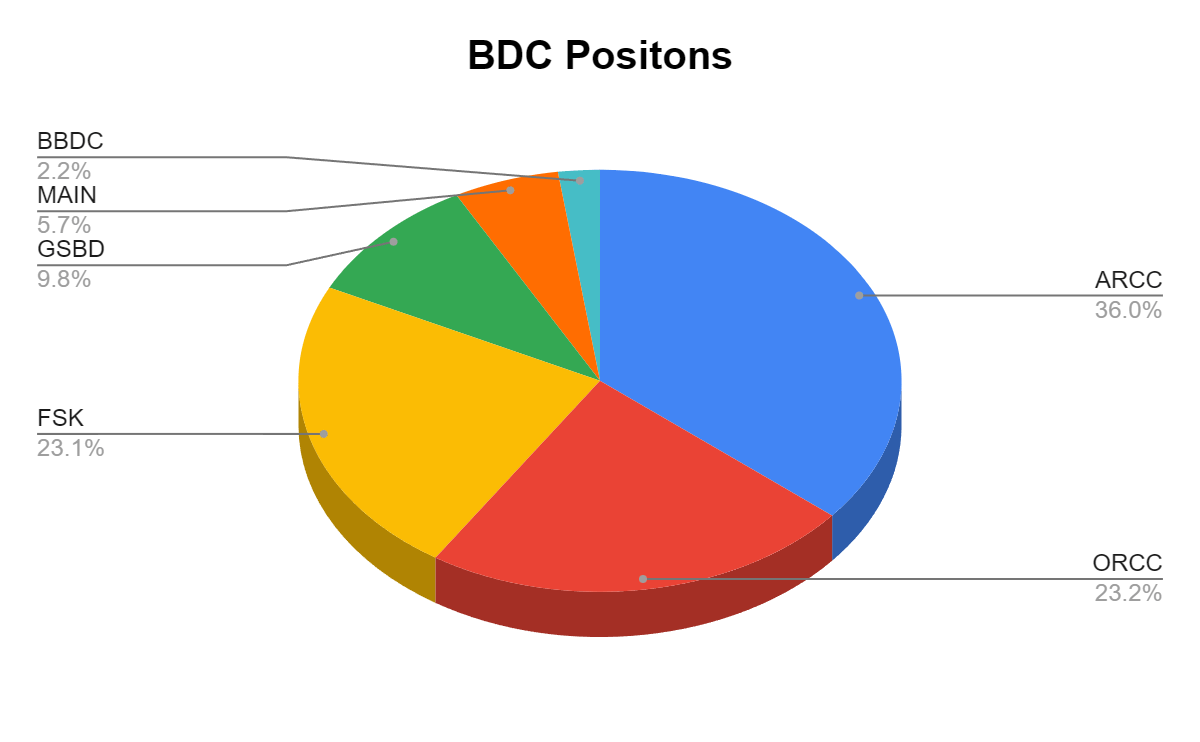
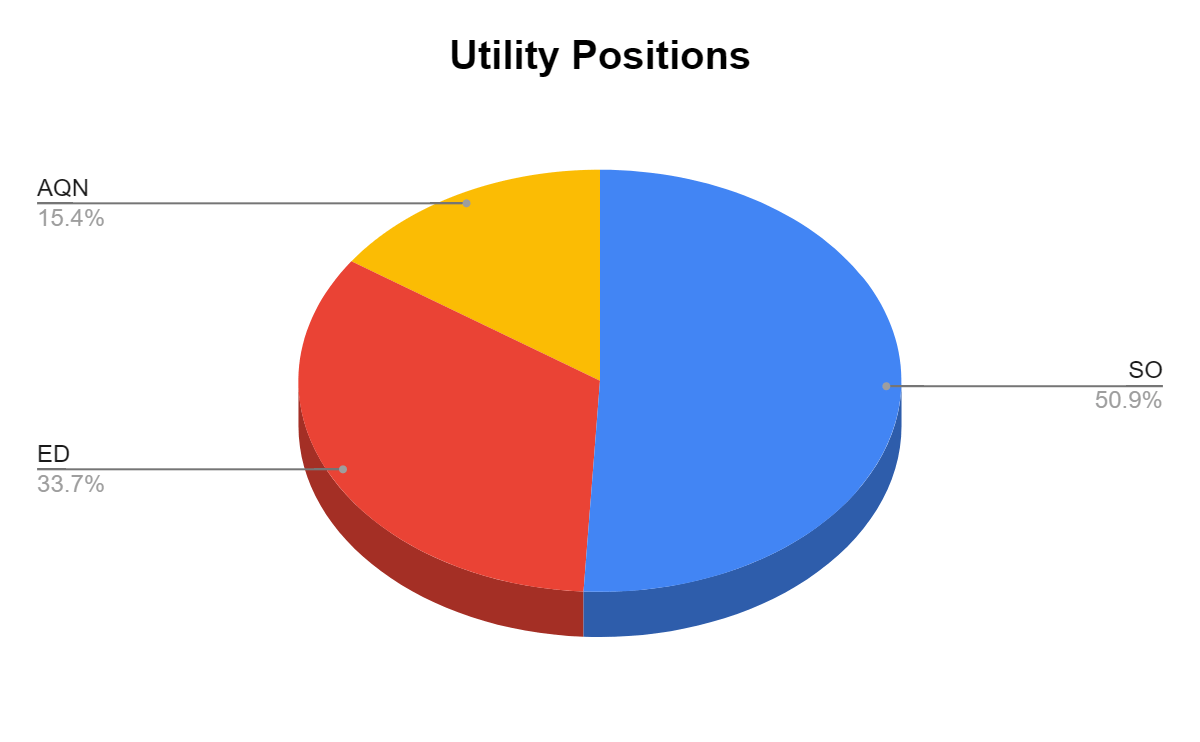
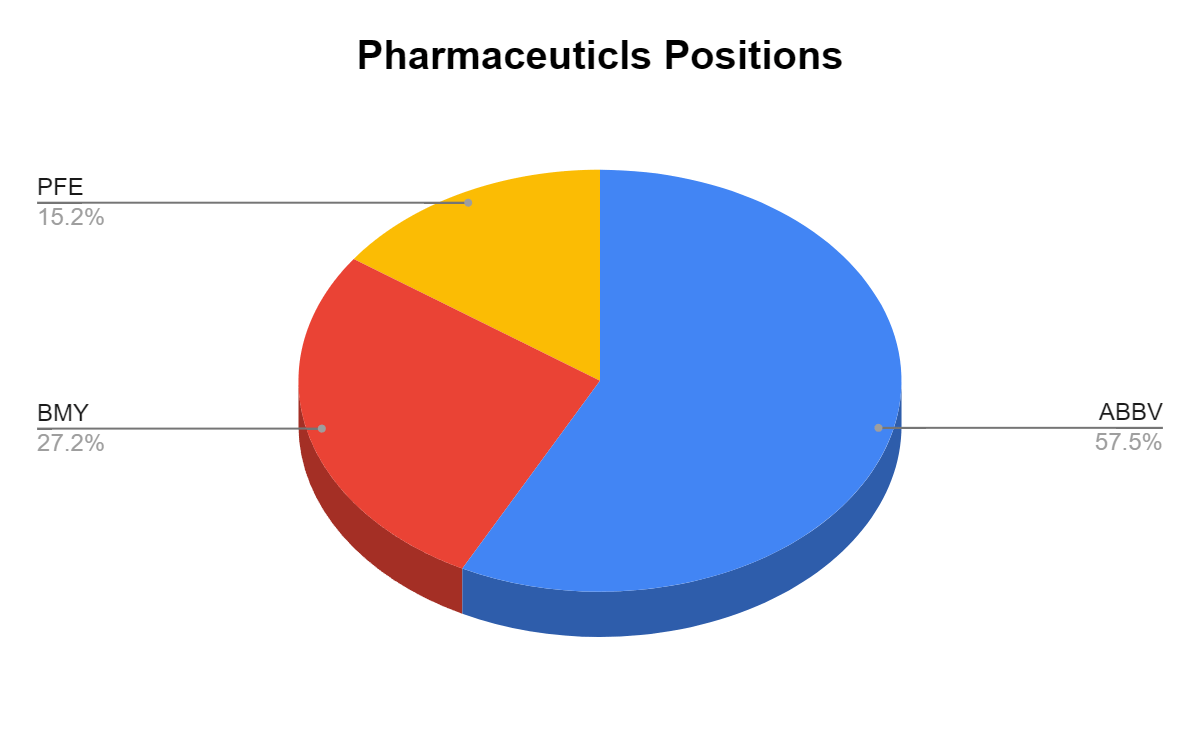
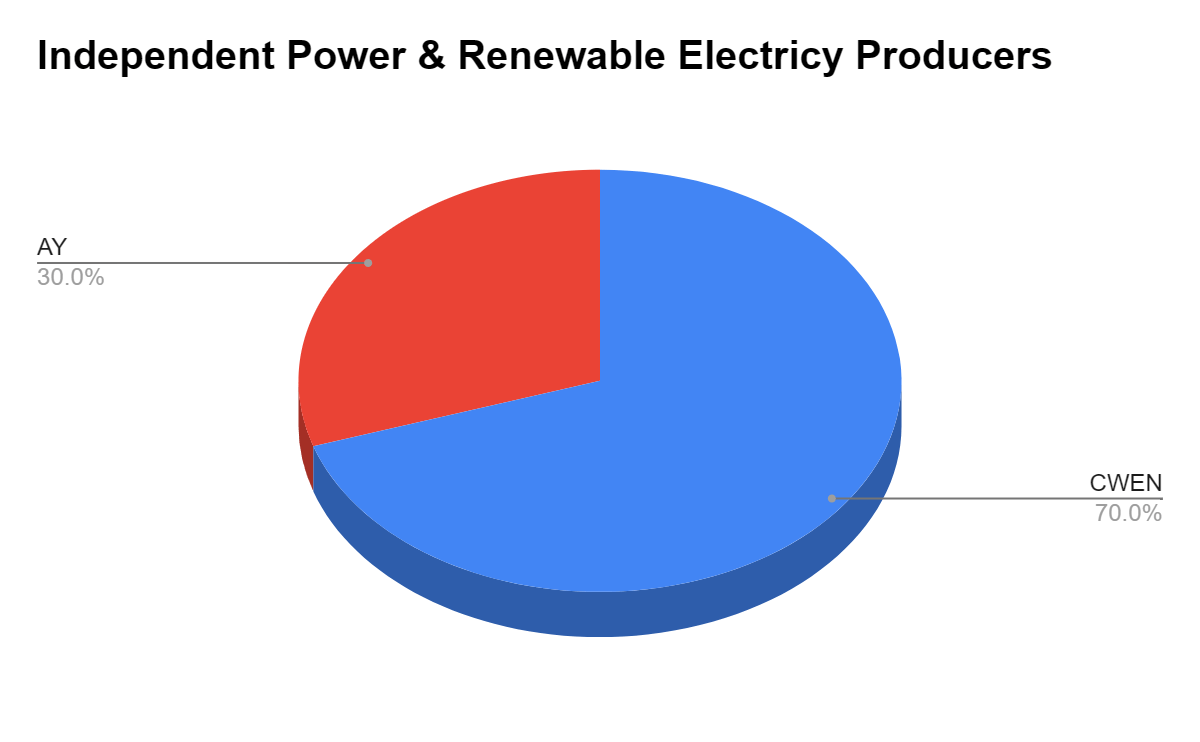
The Dividend Harvesting Portfolio Composition
Many of the readers have asked if I could break down the individual positions within these sectors. I created pie charts for each individual sector and have illustrated how much each position represents of that sector of the Dividend Harvesting portfolio. Since I only have one position in Food & Staple Retailing and Industrials, I did not make a chart for those. 3M ( MMM ) and Walgreens Boots Alliance ( WBA ) represent 100% of those sectors. The charts will follow the normal portfolio total I have constructed. Please keep the ideas coming, as I am happy to add as much detail to this series as I can.
ETFs continue to get closer to the 20% threshold, but in week 118, ETFs still remained the largest section of the Dividend Harvesting Portfolio's composition. ETFs are right on the border and it has been challenging not adding to this sector. Individual equities make up 41.01% of the portfolio and generate 29.61% of the dividend income, while exchange-traded funds ("ETFs"), closed-end funds ("CEFs"), real estate investment trusts ("REITs"), business development companies ("BDCs"), and exchange-traded notes ("ETNs") represent 58.99% of the portfolio and generate 70.39% of the dividend income.
I have a 20% maximum sector weight, so when a singular sector gets close to that level, I make sure capital is allocated away from that area to balance things out. This is the first time I have exceeded 20% in a single sector of the portfolio. I will be allocating capital away from ETFs for a while to get this sector under 20%.
| Industry |
| Investment |
| Portfolio Total |
| % of Portfolio |
| ETFs |
| $2,359.52 |
| $11,758.95 |
| 20.07% |
| REIT |
| $2,162.92 |
| $11,758.95 |
| 18.39% |
| Closed End Funds |
| $1,631.38 |
| $11,758.95 |
| 13.87% |
| Oil, Gas & Consumable Fuels |
| $1,243.30 |
| $11,758.95 |
| 10.57% |
| Financials |
| $852.06 |
| $11,758.95 |
| 7.25% |
| BDC |
| $780.61 |
| $11,758.95 |
| 6.64% |
| Consumer Staples |
| $746.86 |
| $11,758.95 |
| 6.35% |
| Communication Services |
| $697.24 |
| $11,758.95 |
| 5.93% |
| Utility |
| $292.16 |
| $11,758.95 |
| 2.48% |
| Pharmaceuticals |
| $252.12 |
| $11,758.95 |
| 2.14% |
| Technology |
| $244.54 |
| $11,758.95 |
| 2.08% |
| Industrials |
| $211.21 |
| $11,758.95 |
| 1.80% |
| Food & Staple Retailing |
| $190.48 |
| $11,758.95 |
| 1.62% |
| Independent Power & Renewable Electricity Producers |
| $92.32 |
| $11,758.95 |
| 0.79% |
| Cash |
| $2.23 |
| $11,758.95 |
| 0.02% |
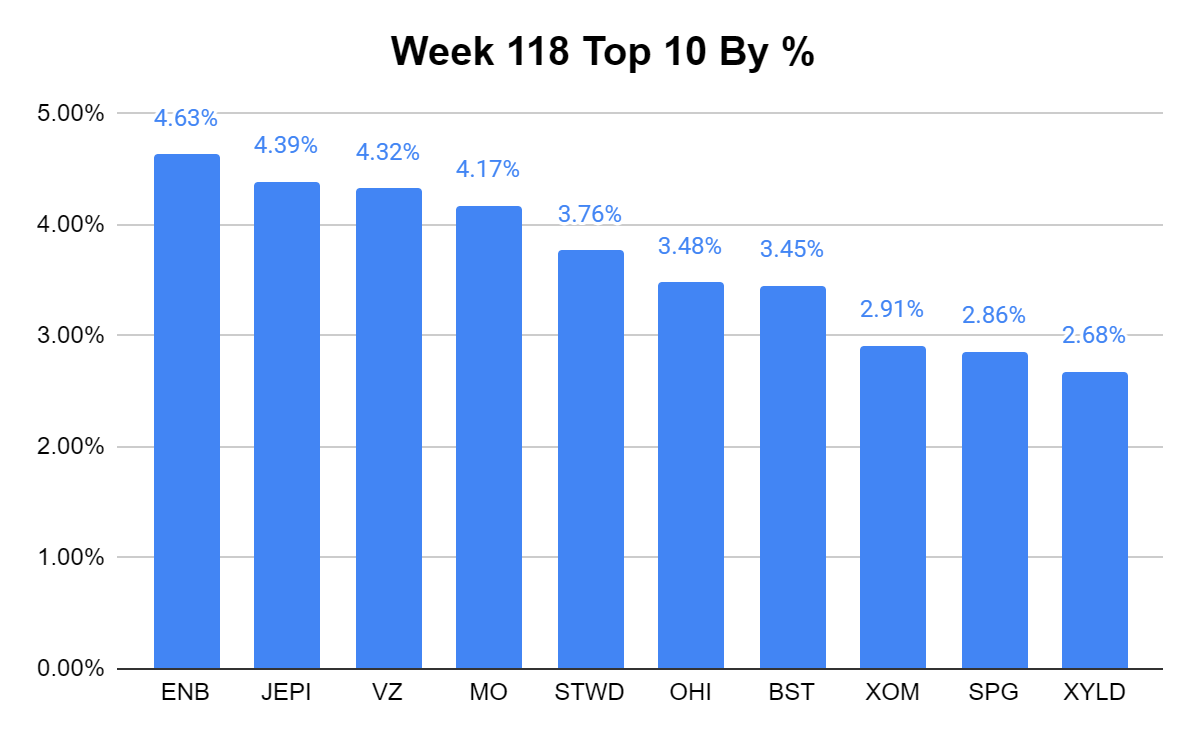
In week 118, ENB became my largest holding as Verizon fell to 3 rd upon news of AMZN possibly offering mobile service with Prime . We will see what happens, but I don't think this is going to occur.
Week 118 Additions
In week 118, I added to the following positions:
Altria Group
- I still need another share or 2 of MO to get it to generate a new share annually through its dividends. Personally, I am impartial to their underlying businesses as Adults make a personal choice about consuming tobacco and alcoholic products. MO is committed to increasing EPS and the dividend annually, and I feel MO is undervalued. I will be adding shares over the next several weeks.
FS KKR Capital Corp
- FSK has become one of my favorite BDCs and had recently declared a special dividend of $0.15 which will be paid in 3 installments in addition to its Q2 distribution of $0.70. FSK also trades at a discount to its net asset value ((NAV)) of $24.93, which makes it interesting.
Week 119 Gameplan
I am looking at my dividend generated annually chart and I am leaning toward adding a share to SLG, Global X S&P 500 Covered Call ETF ( XYLD ), AT&T ( T ), and Kinder Morgan ( KMI ).
Conclusion
Week 120 is right around the corner, so please leave all your suggestions in the comments, as I will be adding a position from the reader suggestions. I have a feeling that another milestone is reached in week 119 as the Dividend Harvesting Portfolio may hit $1,000 of projected annual dividends. Next, I will be working on generating $100 per month of dividend income, and continuing building out this portfolio. I am not trying to beat the market, instead, I am building a portfolio from the ground up that can withstand relentless economic factors and changing market dynamics. This style of investing isn't for everyone, as it's income-focused rather than looking for capital appreciation. With that in mind, I am happy with how this portfolio is progressing, and if we get another good week, The Dividend Harvesting Portfolio should be back in the green.
For further details see:
Dividend Harvesting Portfolio Week 118: $11,800 Allocated, $993.79 In Projected Dividends