CA - Dream Industrial REIT: Snoozing At A Hold
2023-12-30 07:12:18 ET
Summary
- Dream Industrial REIT is an owner and manager of distribution, logistics, and industrial assets in Canada, the US, and Europe.
- The company has seen strong growth in its portfolio and outperformed market indices in recent years.
- We don't see any margin of safety in DIR and believe Granite offers a higher quality portfolio at a comparable valuation with greater growth prospects.
Summary
Dream Industrial REIT ( DIR.UN:CA / DREUF ), part of the Dream family of companies, is an owner and manager of a portfolio of distribution, urban logistics, and light industrial assets in Canada, the US, and Europe. Like most Dream entities, it screens cheap. Upon closer inspection, DIR appears fairly valued and offers little margin of safety. We still believe in the industrial market fundamentals but see Granite (GRP.UN) as a more attractive option.
History
Since 2018, DIR has acquired more than $4Bn worth of properties while divesting ~$300MM of non-core assets. Its 5-year total return of ~28% outperformed the TSX Composite Index by ~7 points and the TSX Capped REIT index by ~41 points.
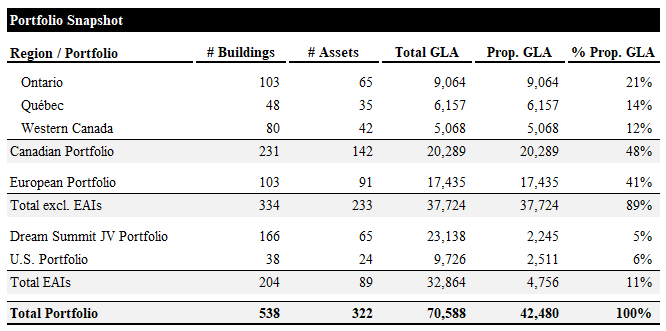
In November '22, DIR announced it had formed a JV with GIC, the Singaporean Sovereign Wealth Fund, to acquire Summit Industrial Income REIT in a ~$5.9Bn all-cash deal. DIR took a 10% stake in the JV, with GIC holding the remaining 90%. The acquisition closed on February 17, '23. DIR also acts as the JV's manager, providing property management and other backend services. Since closing, the JV has been active in acquiring properties and development sites and has executed leases on over 1.8MM sq ft of GLA at +100% leasing spreads. Despite the fanfare and marketing materials, DIR's 10% stake makes this JV a relatively small contributor to the overall portfolio, only accounting for ~5% of proportionate GLA and ~4% of total gross assets (n.b., based on carrying value of its stake).
Portfolio Snapshot
DIR's owned portfolio consists of 233 properties with ~37.7MM sq ft of gross leaseable area ("GLA"), roughly evenly split between Canada and Europe. Its Dream Summit and US JVs own 89 properties with ~32.9MM sq ft of GLA (n.b., ~4.8MM at DIR's share), representing ~11% of total prop GLA.
Its top 10 tenants account for ~11% of gross recurring revenue and ~8% of GLA. Of the 10, we could only verify credit ratings for 2: Auchan Supermarche (BBB-), Amazon Canada (AA for Amazon), and DHL ((A)). While these 3 are not a large enough sample size to estimate the tenant base's overall creditworthiness, it works out a BBB+ weighted average credit rating (n.b., A for Granite REIT with 7 out of 10 tenants rated). This indicates that the overall credit profile of DIR's tenants is lower than that of other major Canadian industrial REITs.
Top Tenants Summary (Empyrean; DIR)
Given that the top tenants account for such a small share of the overall tenant base, and the nature of industrial assets (e.g., mission-critical and scarce), we don't see this as a concern of great importance; however, it is certainly a point in favor of other industrial REITs, like Granite.
Recent Performance
Earnings and Cash Flow Evolution
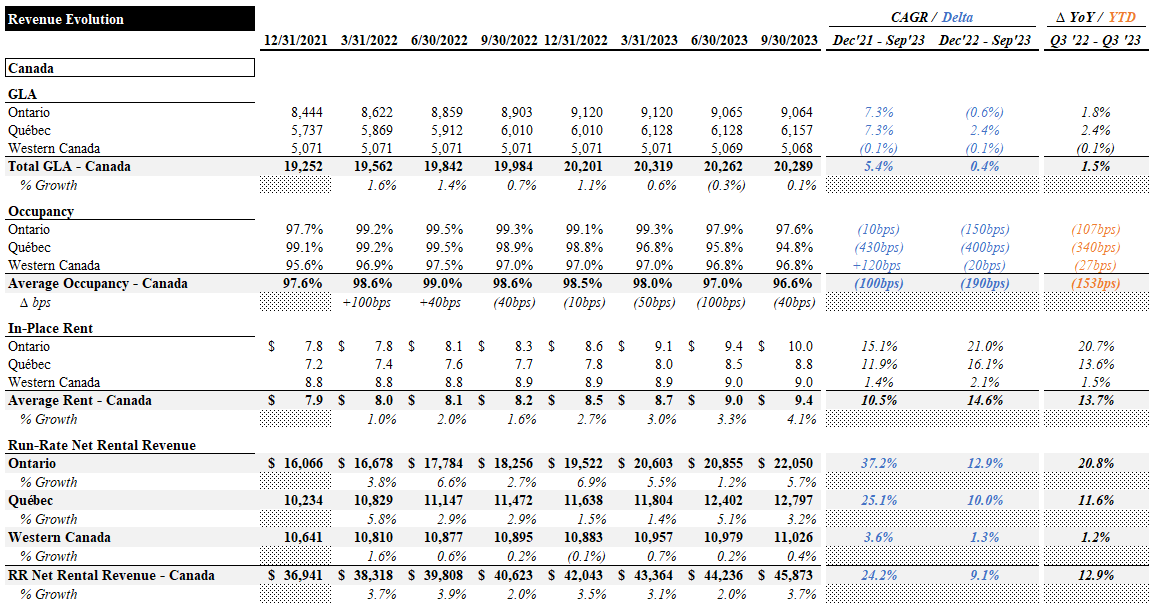
In this section, we unpack the drivers of DIR's earnings and cash flow evolution from year-end '21 to Q3 '23. In the table below, we imputed run-rate rental revenue for its portfolio by geography based on GLA, in-place rent (n.b., in CAD), and occupancy.
Starting with the Canadian portfolio, GLA increased by ~7% in Ontario and Quebec while remaining virtually flat in Western Canada. Occupancy decreased modestly in Ontario, remained virtually unchanged in Western Canada, and decreased materially in Quebec. Rent growth has been phenomenal in Ontario and Quebec, growing at a ~15% and ~12% CAGR, respectively. Rents in Western Canada grew at a modest ~1% CAGR.
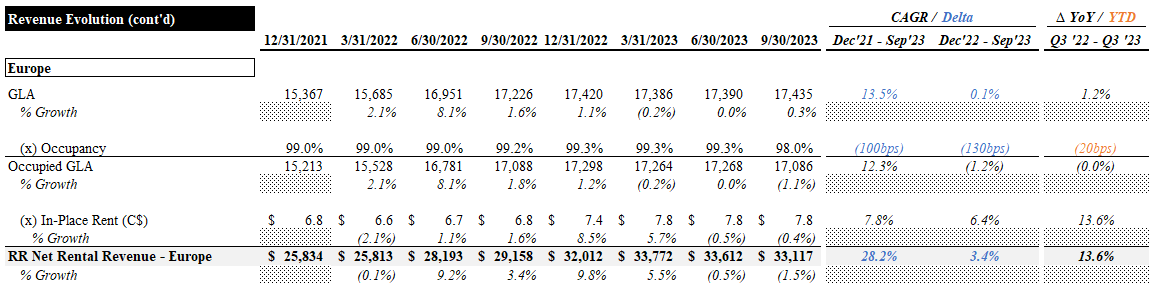
European GLA increased ~13% with virtually no change in occupancy. Rents grew at a ~8% CAGR.
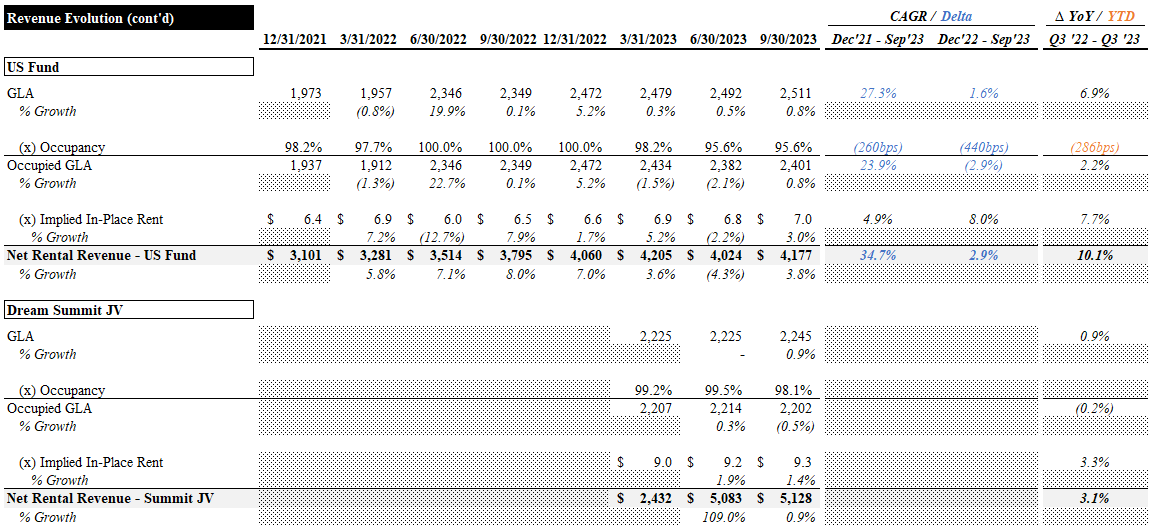
The US Fund saw GLA increase ~27% with a ~300bps degradation in occupancy. Rents grew at a ~5% CAGR. The Dream Summit JV is still in its infancy but has seen a ~1% increase in GLA, stable occupancy, and a ~3% increase in rents.
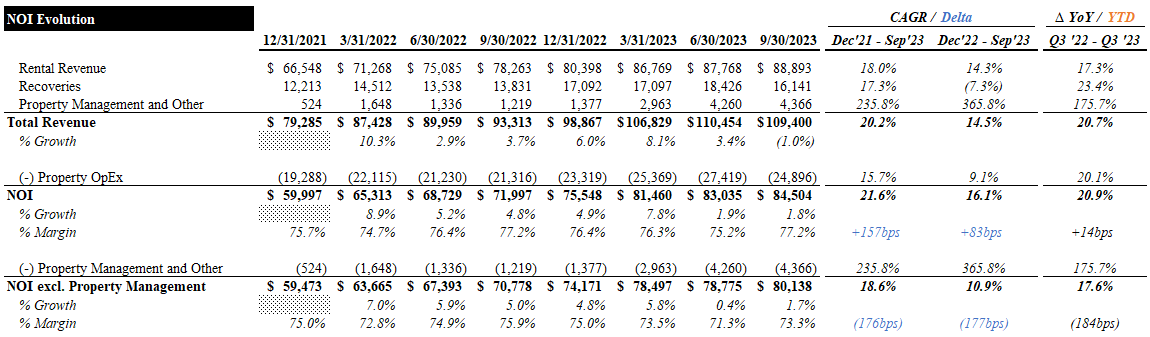
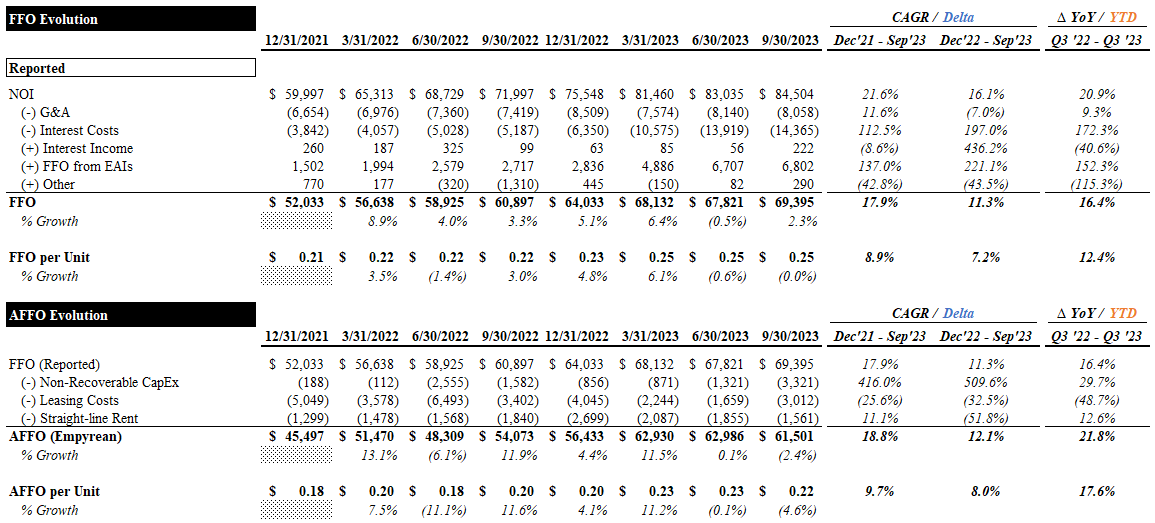
Reported rental revenue has grown at a ~20% CAGR, significantly faster than recoveries (n.b., ~17% CAGR). Property management and other income have increased ~8-fold, aided by the contributions of the Summit JV starting in Q1 '23. Opex increased at a ~16% CAGR, driving modest NOI margin expansion. Excluding property management and other income, NOI grew at a ~19% CAGR and NOI margins were diluted by ~200bps.
FFO has grown at a ~18% CAGR (n.b., ~9% for FFO per unit, driven by a ~15% growth in the unit count). This growth was driven by positive operating leverage on the G&A line, and FFO from equity accounted investments (n.b., "EAIs" includes US Fund and Summit JV) and partly offset by significant growth in interest costs.
As DIR does not report AFFO, we calculated our own by adjusting reported FFO for non-recoverable capex, leasing costs, and straight-line rent adjustments. AFFO grew at a ~19% CAGR (n.b., ~10% on a per unit basis).
Based on the above FFO and AFFO per unit, payout ratios have improved from ~81% (FFO) and ~92% (AFFO) to ~69% and ~78%, roughly in line with Granite.
NAV Evolution
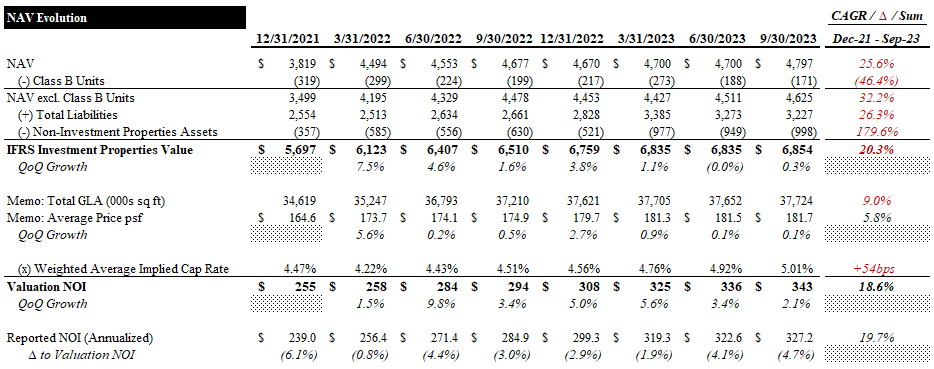
In this section, we unpack DIR's NAV evolution drivers from year-end '21 to Q3 '23. DIR's reported NAV, which includes the carrying value of the Class B units, has increased ~26% over this period (n.b., ~32% excluding the Class B units). This growth was driven by a ~20% increase in the value of its investment properties (i.e., the Canadian and European portfolios), despite ~54bps of cap rate expansion and a ~180% growth in other assets (n.b., this line includes the value of its stake in the US Fund and Summit JV). Liabilities increased ~26% (n.b., Net Debt / Assets increased ~350bps from 31.6% to 35.1%).
A ~19% CAGR in its implied valuation NOI offset the cap rate expansion to drive a ~6% CAGR in the portfolio's implied price psf. We used DIR's reported implied cap rate, rather than its regular cap rates, for this analysis and our valuation. We used the implied cap rates as they were more closely aligned with market cap rates and reflected more conservative NOI assumptions.
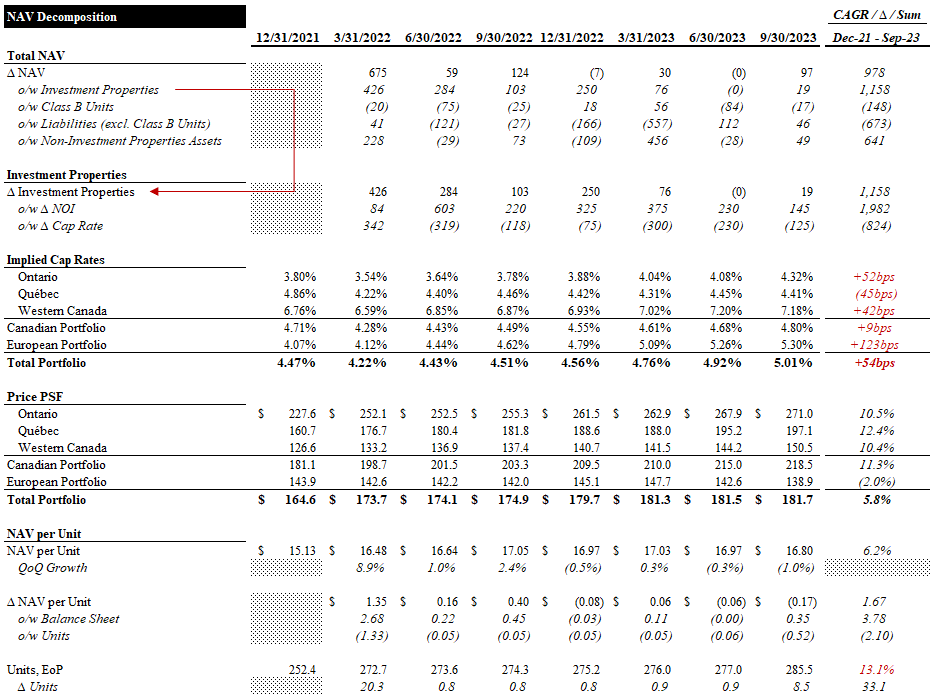
The table below further unpacks the drivers of DIR's NAV evolution. Europe, Ontario, and Western Canada saw the most significant cap rate expansion (n.b., +123bps, +52bps, and +42bps, respectively). Surprisingly, Quebec saw 45bps of cap rate compression. Implied price psf increased at low double-digit CAGRs across the Canadian portfolio but declined slightly in Europe.
Reported NAVPU grew at a ~6% CAGR, as the NAV growth was diluted by a ~13% increase in the unit count. While the overall NAV growth was only possible with the unit issuance to fund acquisitions, unitholders ultimately care far more about NAVPU. One way to simplistically assess the benefit of this equity-financed growth is to compare the NAVPU growth with the implied price psf growth. While there are drawbacks to this approach (i.e., the price psf is impacted by changes in the portfolio as a result of acquisitions and dispositions), it should be a fairly good approximation with the available data. The NAVPU CAGR of ~6.2% is ~30bps higher than the price psf CAGR of ~5.8%. While this indicates that the issuances were accretive, it is disappointing. Over 5 years, this 30bps delta would drive <2% of incremental NAVPU growth. The assets DIR has acquired are generally in attractive markets and have significant loss-to-lease rent growth opportunities, which could drive greater accretion in time. For now, we see this as a point in favor of Granite over DIR. While DIR's reported NAVPU CAGR is significantly higher than Granite's, we are skeptical of DIR's reported NAV (discussed in Valuation). We also note that Granite has been a net repurchaser of units, whereas DIR has been a net issuer despite trading at a discount to Granite on a P/FFO and P/AFFO basis.
Valuation
Granite trades for 14.2x and 16.1x LQA FFO and AFFO, respectively (n.b., 14.4x and 15.9x LTM, respectively). FFO guidance for FY23 implies ~10% YoY growth (n.b., 14.3x FFO). Its $0.70 annual distribution (n.b., unchanged since 2013) yields ~5%. Based on our NAV estimate, the market is pricing it at a ~1% discount and a ~5.3% implied cap rate.
Valuation Summary (Empyrean; DIR)
Our central case is based on estimated market cap rates for each geographical segment of the portfolio (source for Canada , US ). Our cap rate assumption for the European portfolio is likely generous, ~10bps tighter than our assumption for Granite's Dutch assets. Note that DIR does not disclose the cap rates it uses for the US FUnd and Summit JV.
Our upside case uses DIR's reported "implied cap rates", which are based on YTD annualized NOI, rather than its IFRS cap rates. It's reported IFRS cap rates are generally significantly higher than market rates but imply NOI considerably higher than we believe is reasonable for an NTM forecast (n.b., NTM NOI is the most common approach to the numerator in the cap rate). Therefore, we see implied cap rates as the correct figure for comparability with market cap rates and peers (e.g., Granite). While the conservatism in the cap rate is somewhat offset by an aggressive NOI assumption, we believe DIR's IFRS value is too high. Our valuation of investment properties for Granite was ~12% lower than its IFRS value vs ~19% for DIR. In reality, the value gap for DIR is likely higher, as our cap rate assumptions, particularly for Europe, are on the optimistic side. We also note that DIR's reported price psf is ~$182 (n.b., excluding JVs), ~28% higher than Granite's ~$142. While this comparison is difficult excluding DIR's US assets (n.b., DIR does not disclose enough data to calculate price psf for the US JVs), we believe the difference is significant enough to prove our point. The gap is especially concerning when we consider that DIR has greater exposure to Europe (n.b., ~48% of prop GLA and ~35% of IFRS value vs ~28% GLA and ~25% IFRS value for Granite), a market in which DIR has seen greater value degradation than Granite, and the overall lower quality of the DIR portfolio compared to Granite.
Cap Rate Assumptions (Empyrean; DIR)
The major balance sheet adjustments for our NAV calculation are shown below.
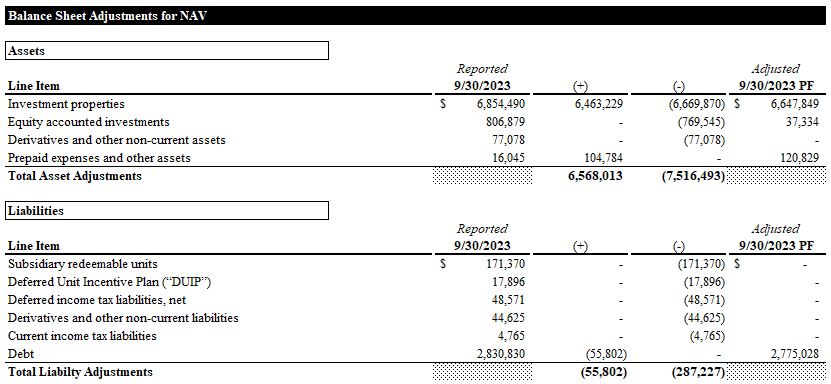
Our target price is based on a 5% discount to our NAVPU. This reflects the slightly lower quality of DIR's tenants, greater European exposure, and propensity for unit issuance. Even without the discount, DIR does not offer a margin of safety under our central case. In the upside case, we see ~7% upside.
Target Prices (Empyrean; DIR)
If it were not for the continued strength of the industrial market and significant loss-to-lease opportunity (discussed below), we would likely give DIR a Sell rating. However, these factors are undoubtedly in DIR's favor, and the valuation does not appear excessive. Therefore, we give it a Hold and recommend investors interested in Global industrial exposure through a Canadian REIT look into Granite. Our recent report on Granite can be viewed here .
Risks / Catalysts
Despite record deliveries of new supply, Canada's industrial market remains exceptionally strong. CBRE reports that net leasing activity remained steady in Q3 while new supply outpaced net absorption by the largest quarterly margin in 14 years. This drove availability rates to rise across nearly all markets, with the national availability rate increasing 40bps QoQ to ~2.5%. This trend may soon inflect, as construction activity has eased from record levels, decreasing slightly QoQ to ~44MM sq ft as pre-leasing activity continues to slow. Market rent growth slowed again in Q3 but remains positive, rising ~12% YoY and approaching pre-pandemic growth rates.
While many European countries are grappling with a recessionary economic environment, DIR's assets continue to see healthy rent growth as it burns down its loss-to-lease.
Below, we see DIR's leasing spreads over the past 5 quarters, averaging ~43%.
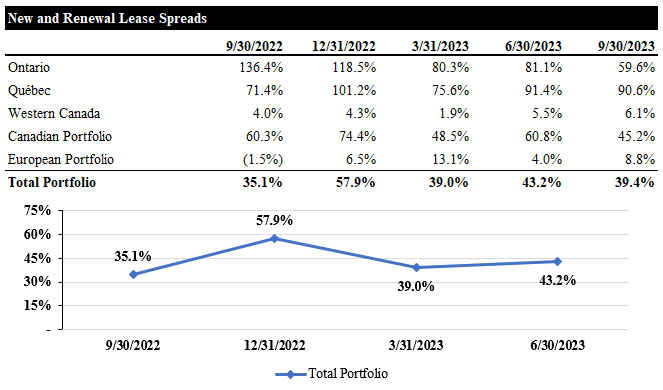
Market rents are ~60% higher than in-place rents in Ontario and Quebec, but only ~3% higher in Western Canada (n.b., ~48% higher on average across the Canadian portfolio). European market rents are only ~8% higher than in-place rents in DIR's portfolio.
Loss-to-Lease (Empyrean; DIR)
While rising new supply in Canada threatens to slow market rent growth, market rent growth remains in the positive double digits. Additionally, DIR has a significant loss-to-lease opportunity that should support strong topline growth as leases expire.
Europe will likely prove more challenging. While DIR has a modest loss-to-lease, slowing economic growth will likely tamper growth in this segment.
Management Business
We did not include a separate value for DIR's property management agreements in our valuation, as we have done for other REITs (e.g., Tricon and CTO ). This is due to the small size of this income stream in the context of the entire business (n.b., property management income accounted for only ~3% of NOI in Q3). Additional growth in this line could provide additional upside to our target price.
Conclusion
On the surface, DIR appears to be a cheap(er) way to gain exposure to the industrial market. After diving deeper into the portfolio and financials, we think the discount is warranted due to the lower quality of the portfolio, exposure to Europe, and reliance on equity-funded growth. We continue to like industrial market fundamentals but see a better opportunity in Granite.
For further details see:
Dream Industrial REIT: Snoozing At A Hold